

I will admit that I am not much of a chart reader, and prefer to focus on fundamental analysis instead. But Apple stock’s graph seems to suggest that shares have reached a pivotal moment. Will they find market support from here, or keep correcting further?
Valuation floor
A few weeks ago, I pointed out that Apple seemed to have found a valuation floor. That is: over the previous six months, since the company’s blowout fiscal third quarter earnings results, the stock had consistently rebounded whenever the price-to-earnings ratio approached 33 times (based on trailing four-quarter earnings).
The rationale behind the idea of a floor can be explained as follows: market participants have different thoughts on what might be considered a good price to pay on Apple. If enough of them believe that 33 times earnings is a reasonable multiple, demand will rush in and support the stock at those levels.
Early in March, shares breached the hypothetical floor and landed at 31.5 times for a moment – only to recover back to 33 times once again, a few days later. It is unclear whether the floor thesis has been disproved by the breach, or reinforced by the fact that shares found enough demand to recover again.

Apple – Price/Earnings.
More than a definitive sign either way, I believe that the testing of the valuation floor warrants some monitoring. Losing the support could be bad news for bulls, and possibly indicative that Apple shares may have run out of demand at a P/E of 33 times.
Breaching the 150-day moving average
The other chart pattern speaks to momentum. It is generally understood that a stock trading above a certain moving average is a bullish sign, and so is the crossing of two averages (for example, the 50- and the 150-day) on the way up.
The graph below shows Apple’s share price movements over the past 12 months, alongside the 50-day and 150-day moving average lines. Notice that the grey line has served as a solid base from which the stock traded through most of last year. It signaled a good entry point in April 2020, and supported shares through the sideways movement of October and November.
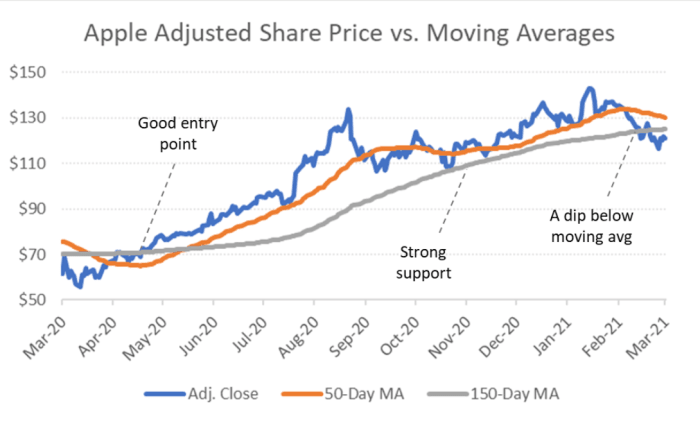
Apple adjusted share price vs. Moving averages.
One potential problem is that the stock has now breached the 150-day moving average on the way down, and it did so for the first time since the beginning of the COVID-19 bear market. This could be a sign of loss of momentum, as bearishness reinforces itself and pushes the stock price lower.
Twitter speaks
Chart analysis is controversial, as it can be easy to spot a pattern where one does not exist. So, I asked the Twitter-verse for its opinion on the subject:
Read more from the Apple Maven:
(Disclaimers: the author may be long one or more stocks mentioned in this report. Also, the article may contain affiliate links. These partnerships do not influence editorial content. Thanks for supporting The Apple Maven)


