


Unlike previous bull market rallies, Bitcoin’s (BTC) current momentum appears to be unfolding without signs of excessive market euphoria. Several key indicators suggest that this ongoing rally may be more sustainable than those in the past, hinting that BTC could have more room to grow before encountering a significant correction.
Bitcoin Quietly Hits New Record High
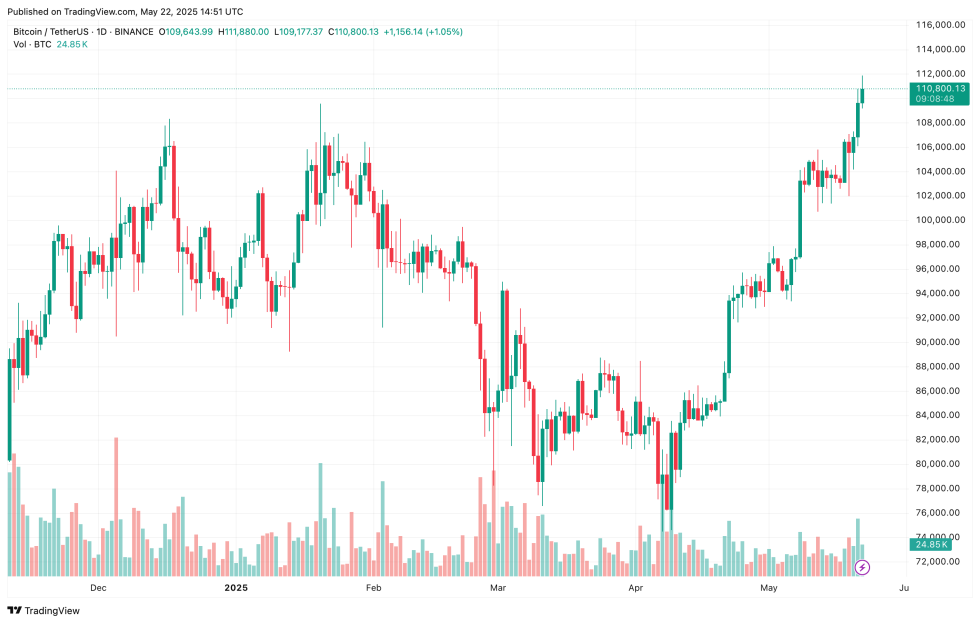
BTC reached a fresh all-time high (ATH) yesterday – trading above $111,000 – yet market conditions remained relatively calm, with little indication of the overheating typically seen during previous market tops.
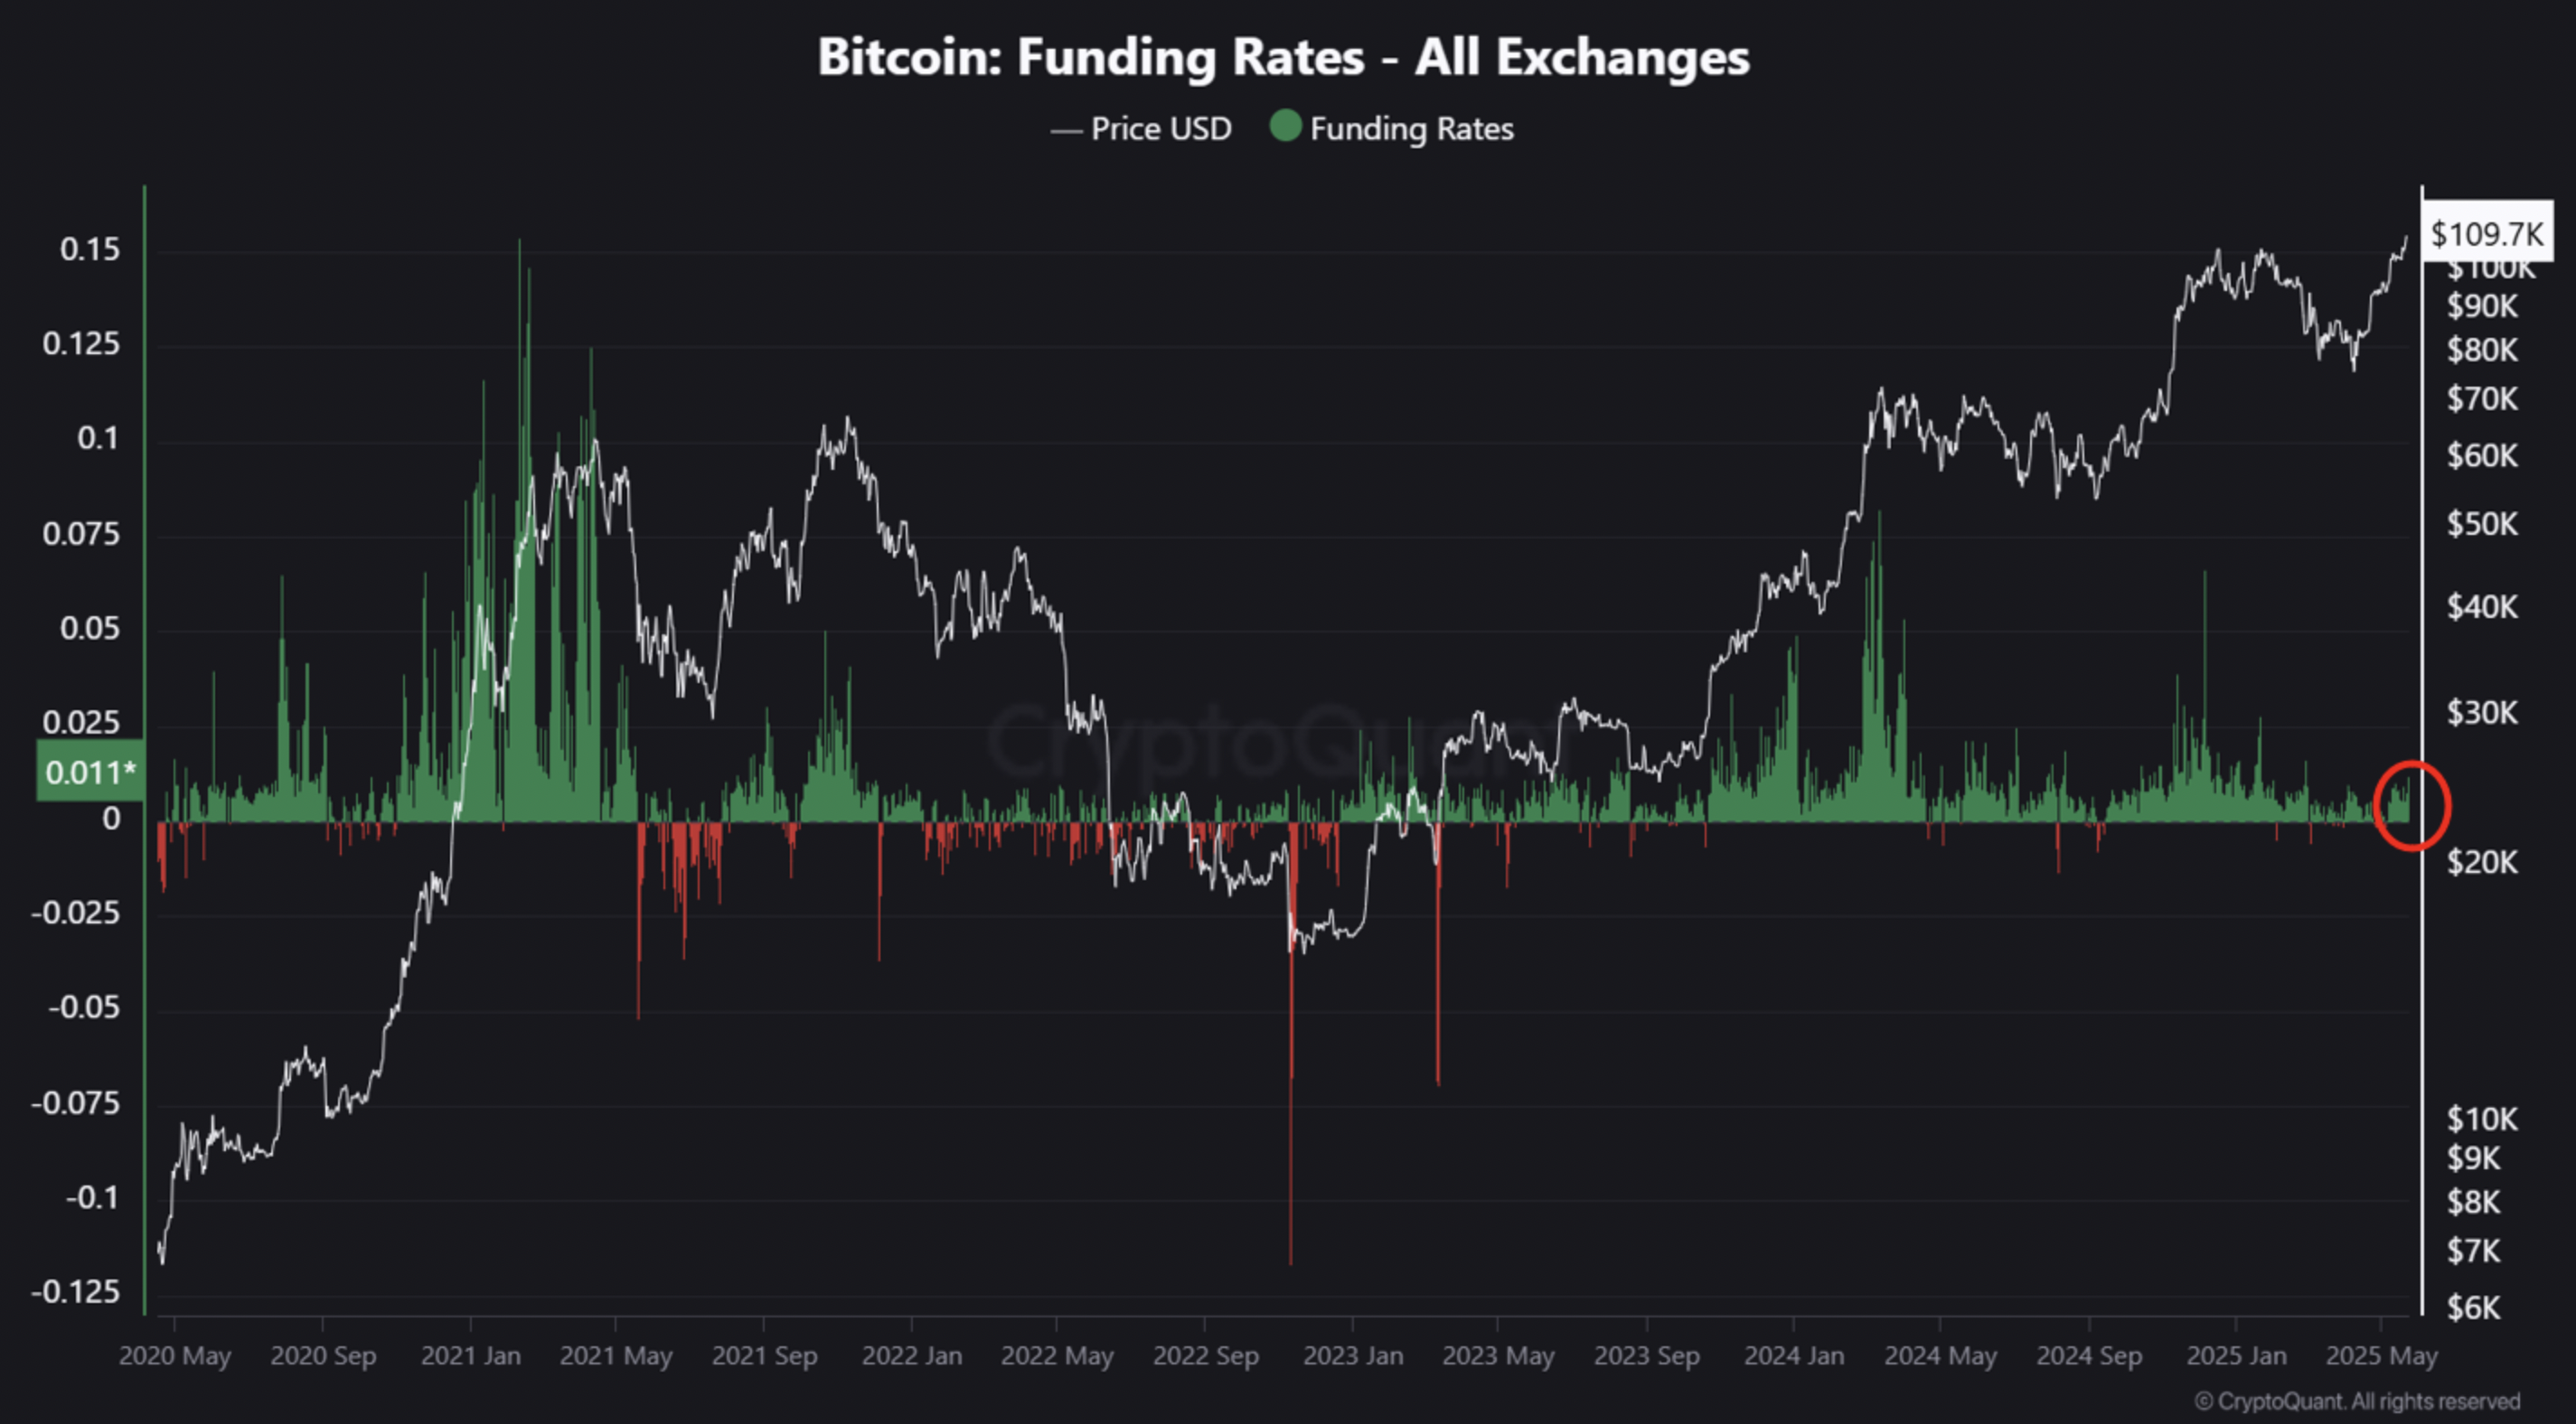
In a recent CryptoQuant Quicktake post, contributor Crypto Dan noted that funding rates – often used to gauge speculative activity – have remained subdued despite the recent ATH. While long positions have increased, their levels are still significantly lower than during prior bull cycle peaks.
Dan added that by examining the proportion of BTC traded within the last one week to one month, short-term capital inflow into the Bitcoin market can be determined. During the current rally, such short-term capital inflows into BTC have not been as high as seen in previous rallies.
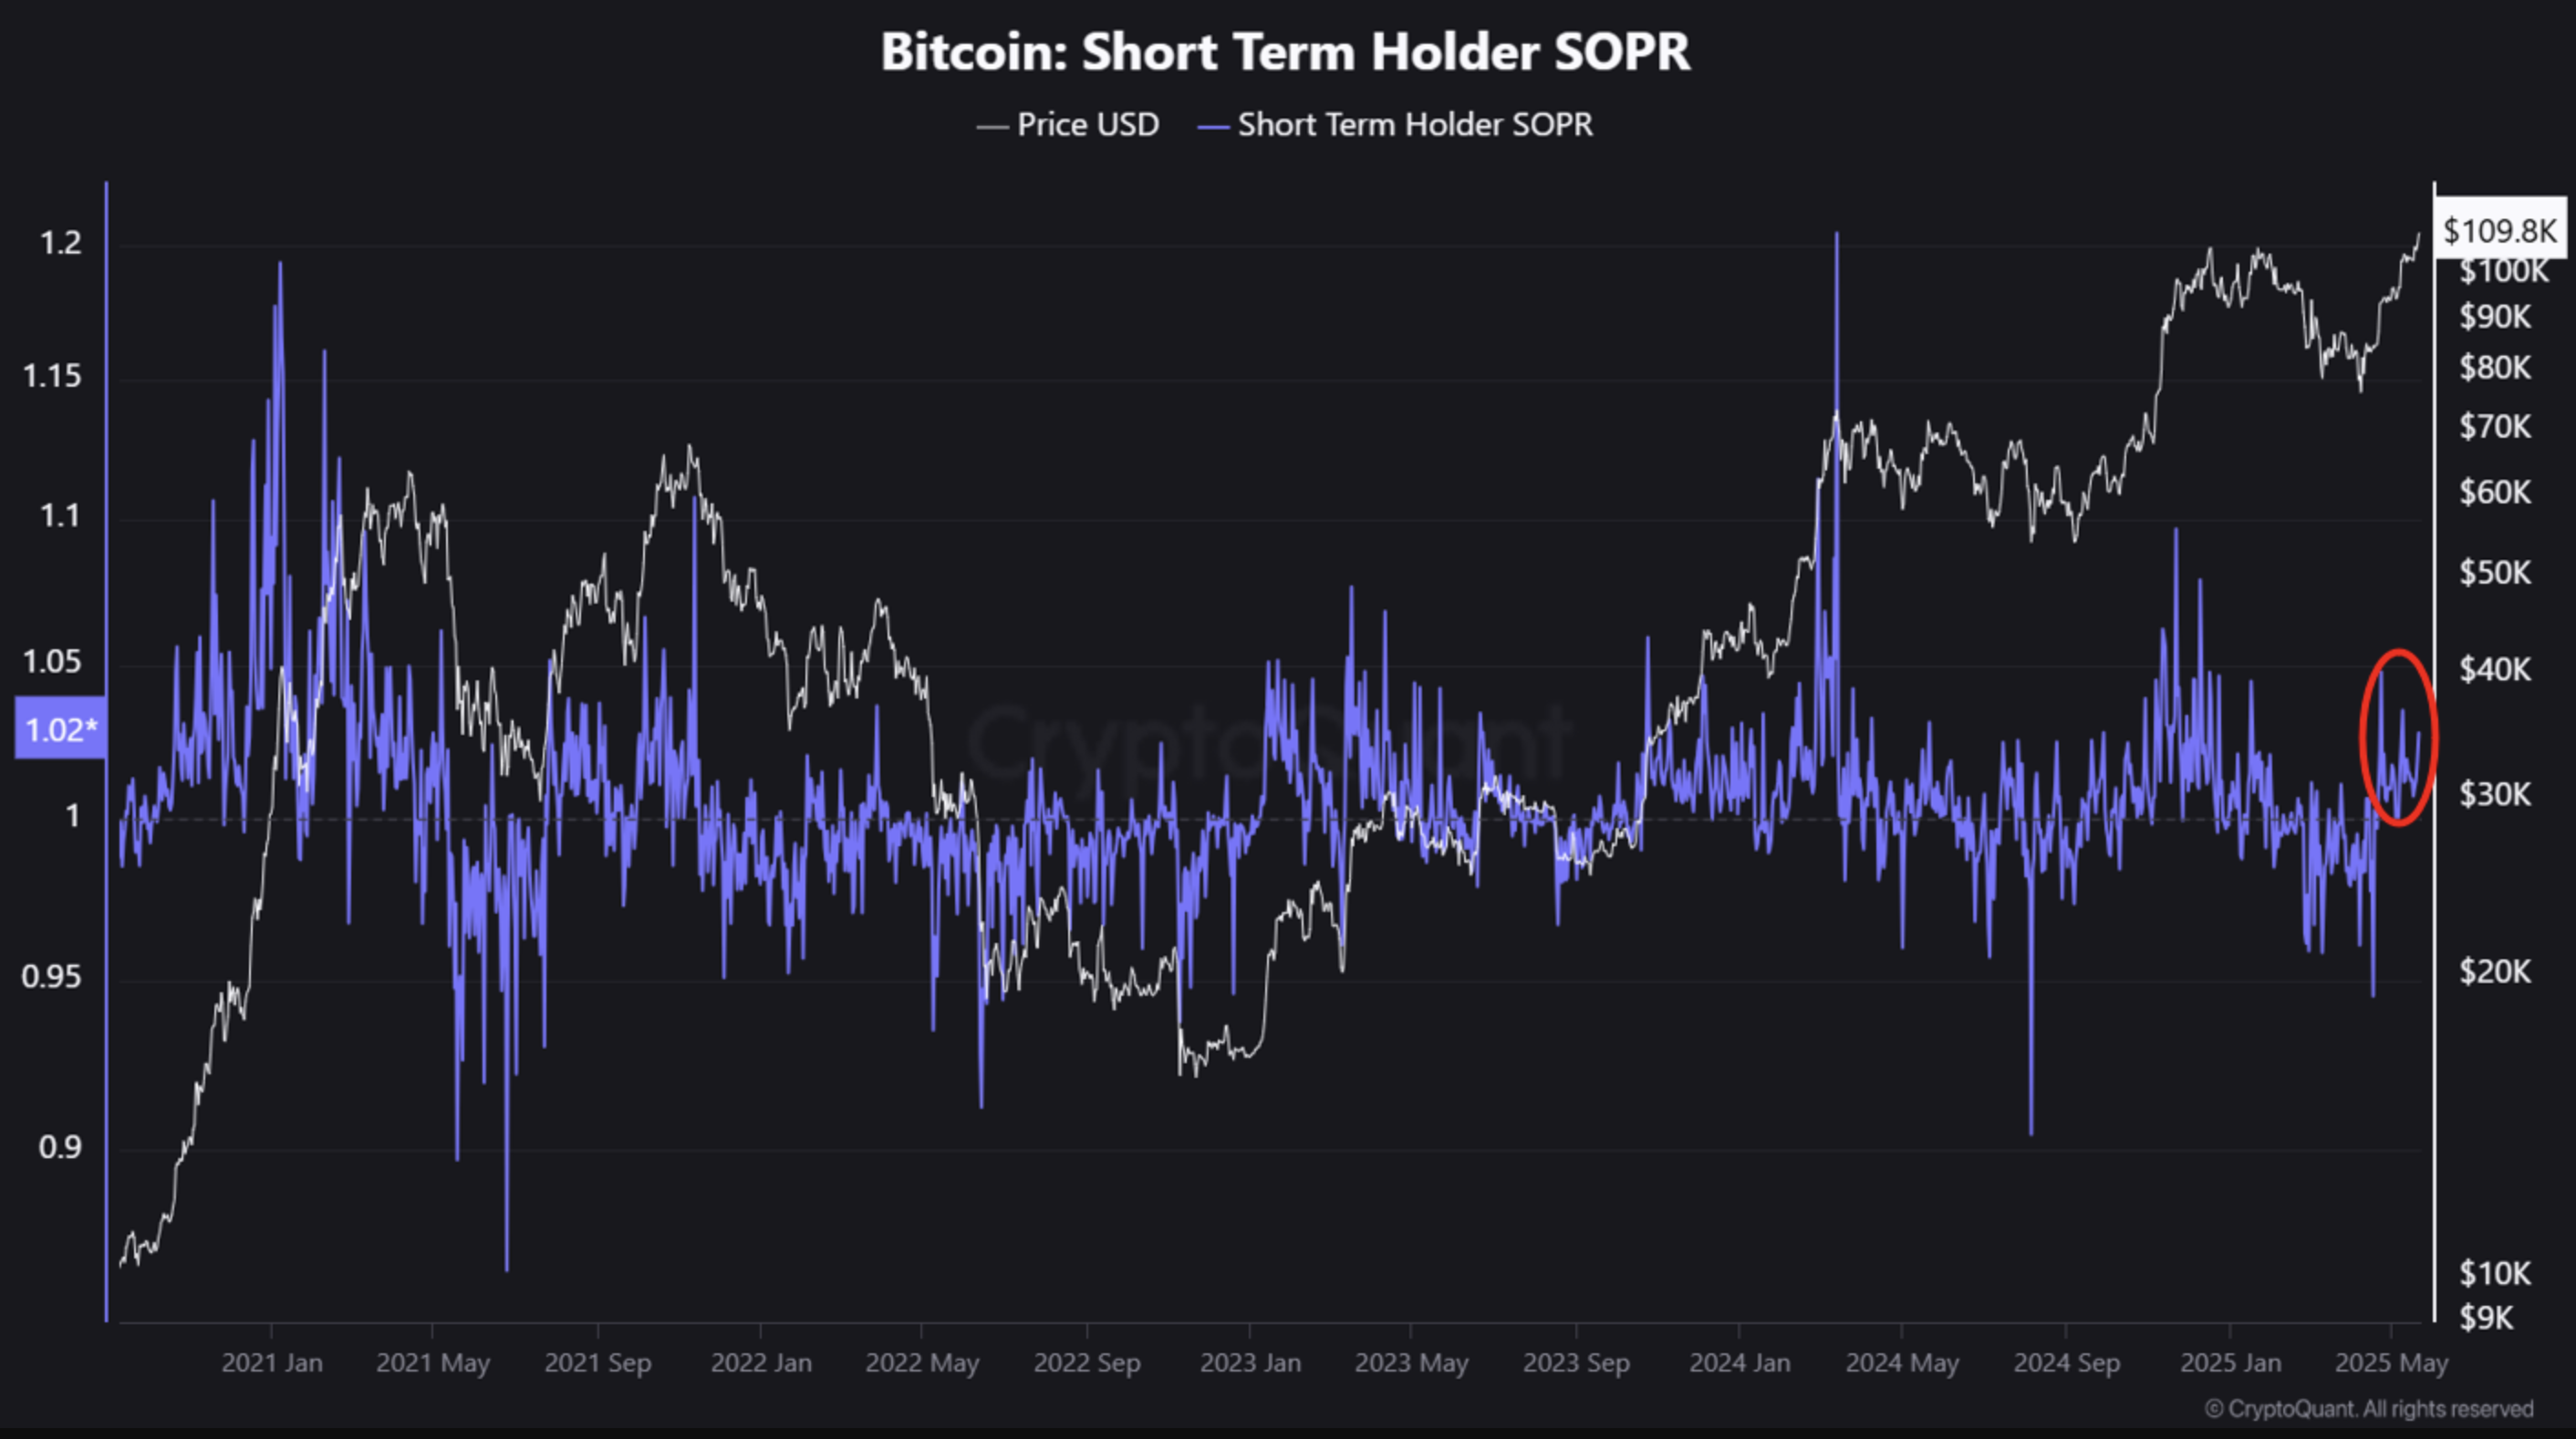
While some short-term holders have realized profits, the scale of this profit-taking is far lower than in March or November 2024, both of which were followed by sharp pullbacks and billions in trader liquidations.
Notably, old Bitcoin whales have been largely inactive in terms of profit-taking, even as the price has reached successive new highs. This reluctance to sell may indicate that major holders are expecting further appreciation in BTC’s price.
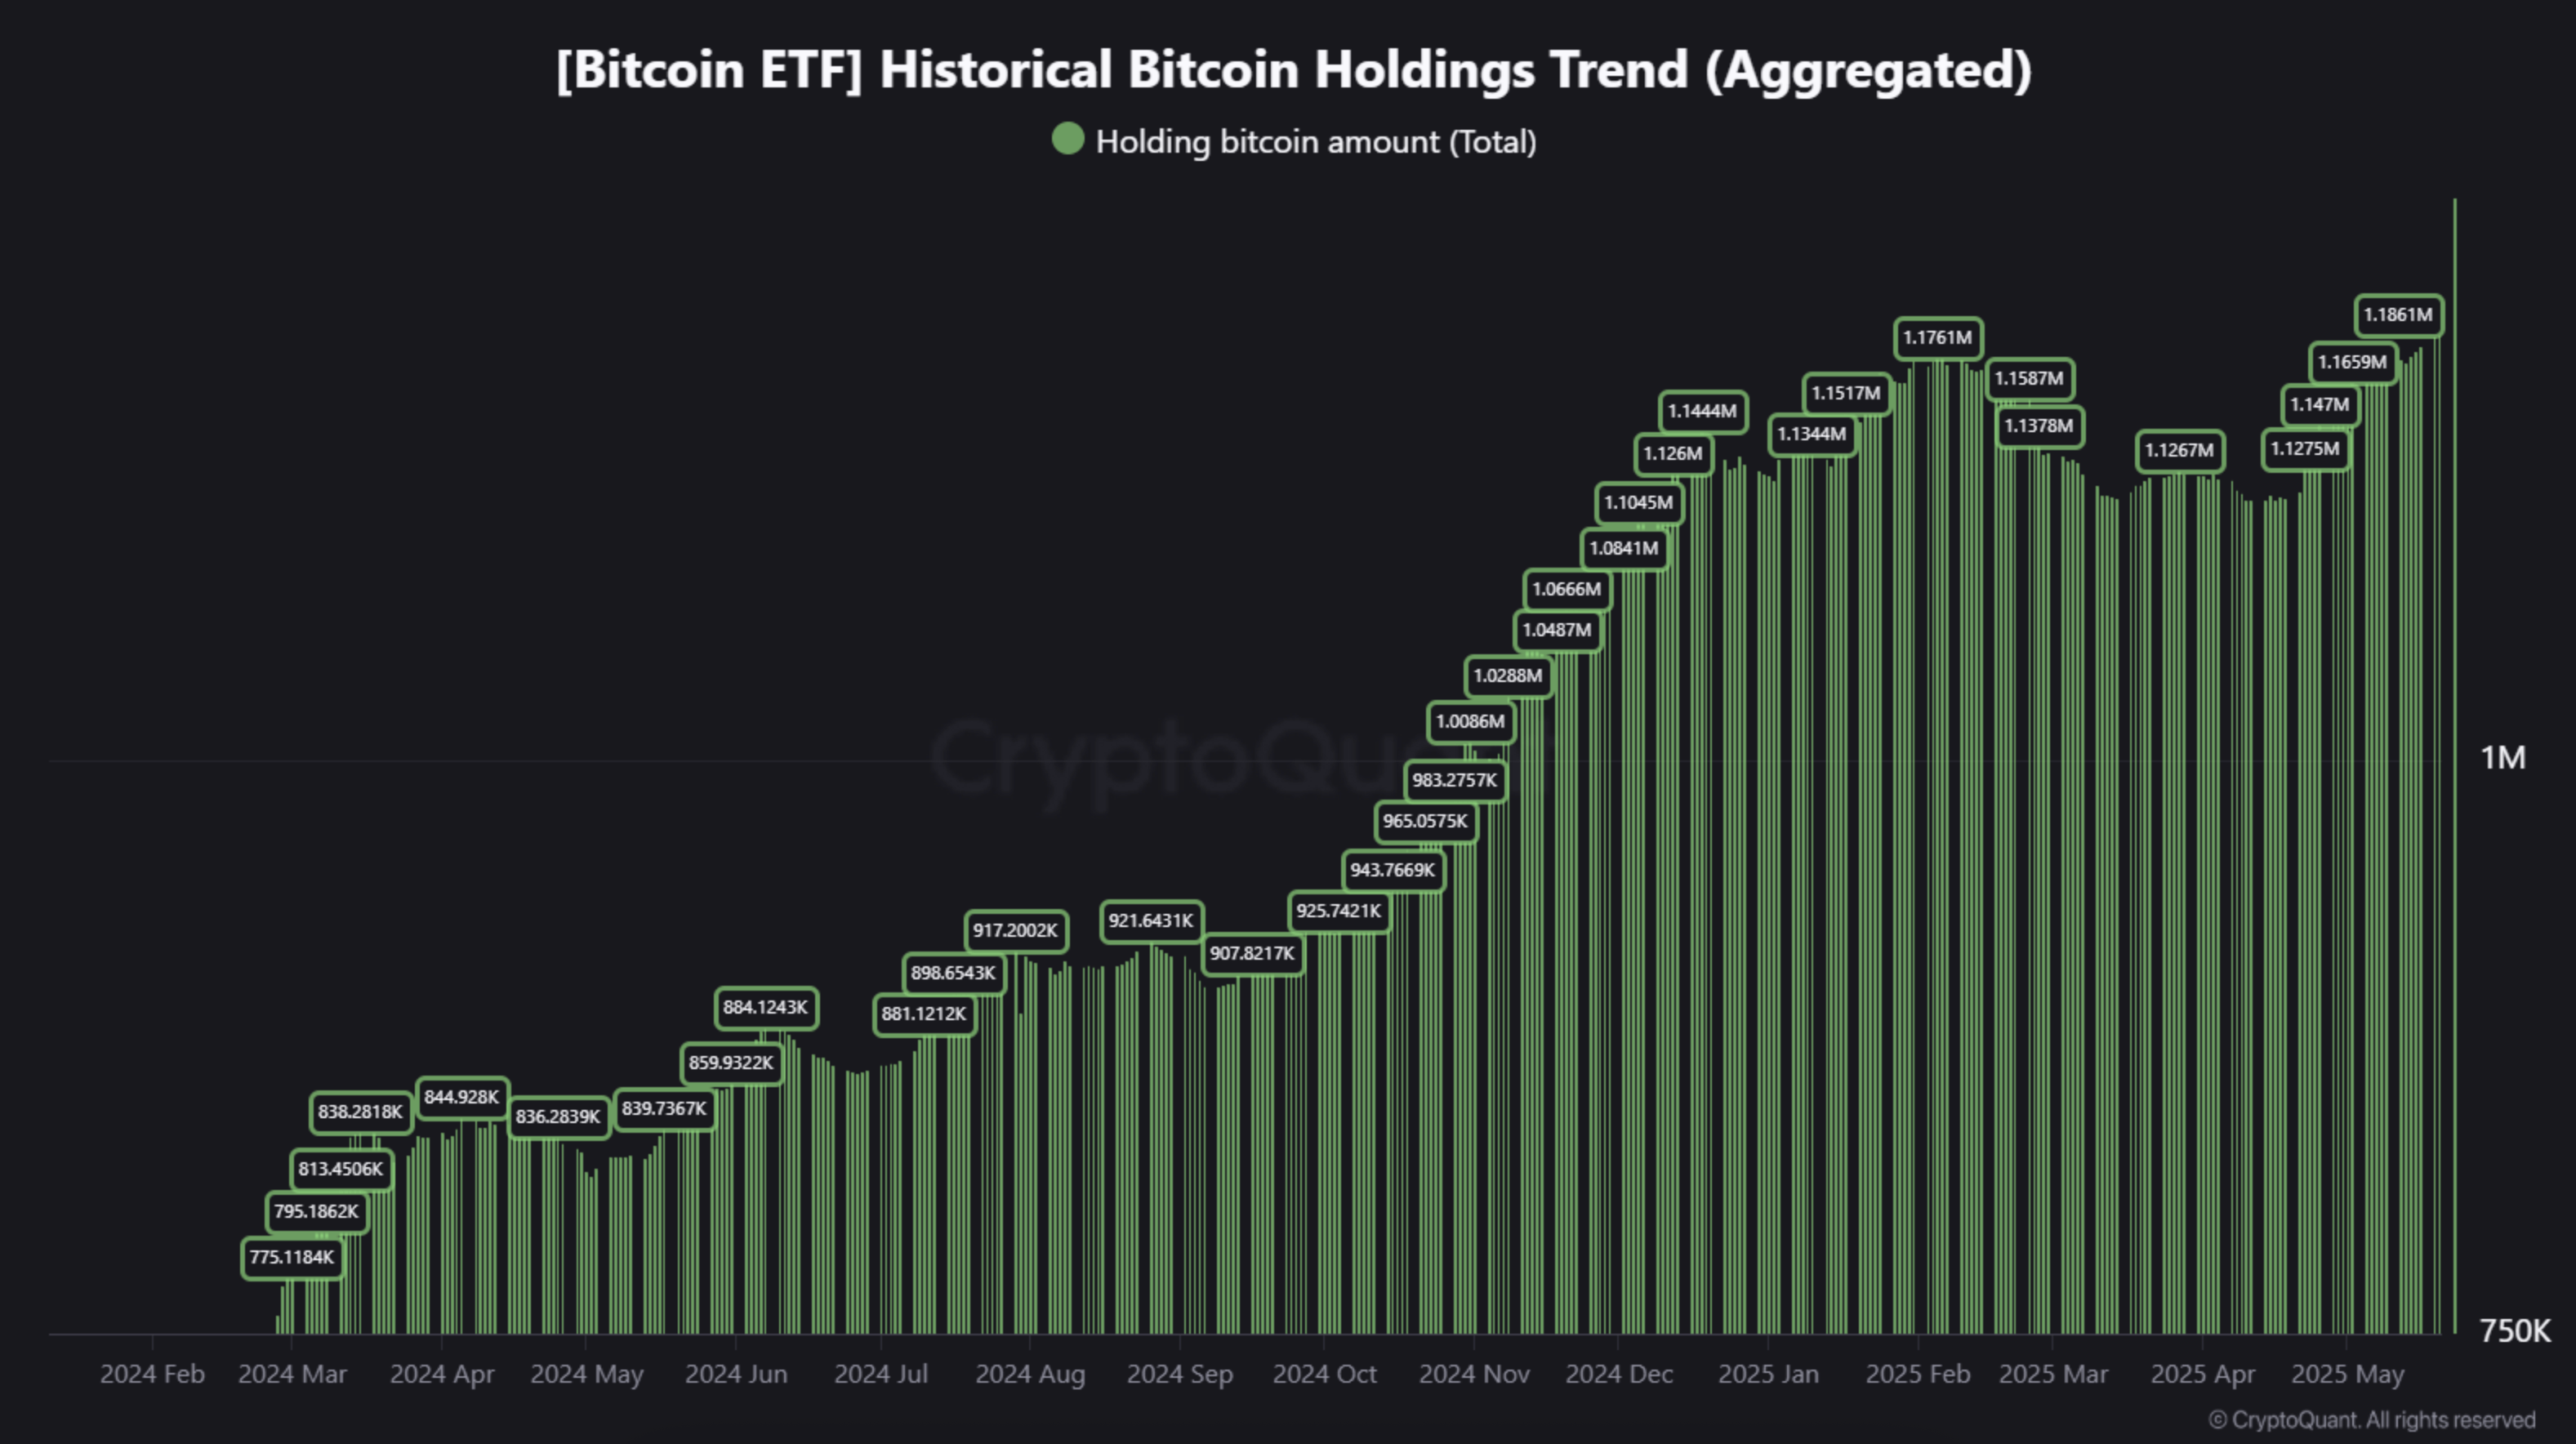
Meanwhile, institutional demand continues to grow, especially through US-based spot Bitcoin ETFs. According to data from SoSoValue, the total net assets held in these ETFs now amount to approximately $129 billion, which represents around 6% of Bitcoin’s total market cap.
Key Price Levels To Watch Out For
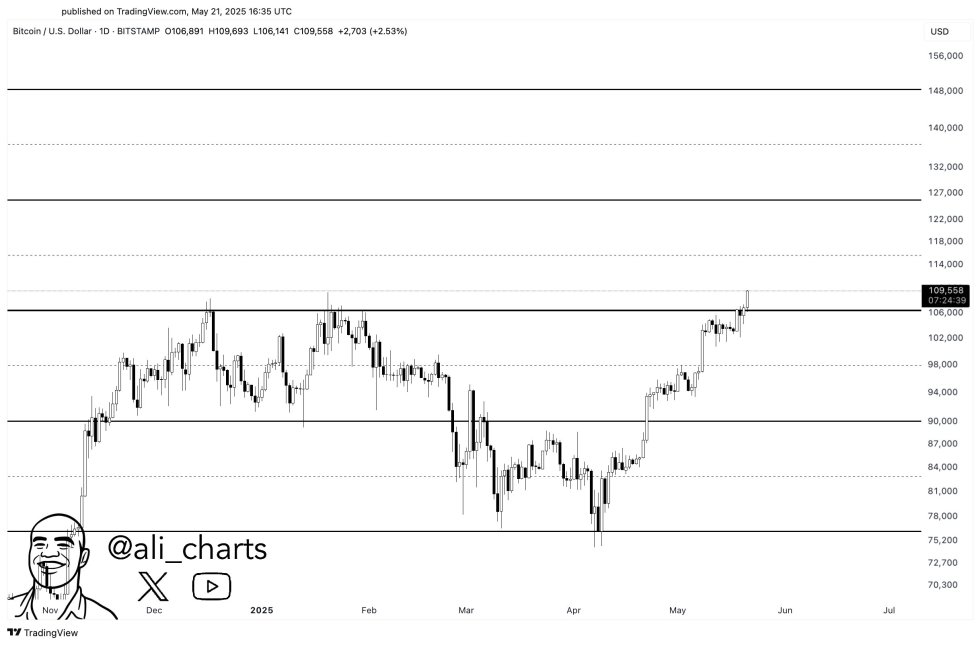
In a separate X post, noted crypto analyst Ali Martinez highlighted several key levels to monitor as BTC enters uncharted price territory. The analyst outlined $116,000, $126,000, $136,000, and $148,000 as next price levels to watch out for.
Similarly, other analysts point toward positive technical indicators that may propel BTC to even higher-highs. For instance, Titan of Crypto recently noted that BTC is nearing a bullish Golden Cross formation on the weekly chart.
Additionally, crypto analyst Ted Pillows recently stated that BTC may have entered the final phase of a Wyckoff Accumulation pattern, with the next leg potentially pushing the price as high as $120,000. At press time, BTC trades at $110,800, up 3% in the past 24 hours.
Featured Image from Unsplash.com, charts from CryptoQuant, X, and TradingView.com
Editorial Process for bitcoinist is centered on delivering thoroughly researched, accurate, and unbiased content. We uphold strict sourcing standards, and each page undergoes diligent review by our team of top technology experts and seasoned editors. This process ensures the integrity, relevance, and value of our content for our readers.


