

Bitcoin, S&P 500, Gold, Technical Analysis, Retail Trader Positioning – Talking Points
- Bitcoin may resume rally as short bets accumulate
- The S&P 500 may also follow a similar path higher
- Gold prices weakening, but recent uptrend holding
In this week’s session on IG Client Sentiment (IGCS), I discussed the outlook for Bitcoin, the S&P 500 and gold. IGCS is typically a contrarian indicator. For a deeper dive into where these assets may go, including a deeper discussion of technicals and fundamentals, check out the recording of the session above.
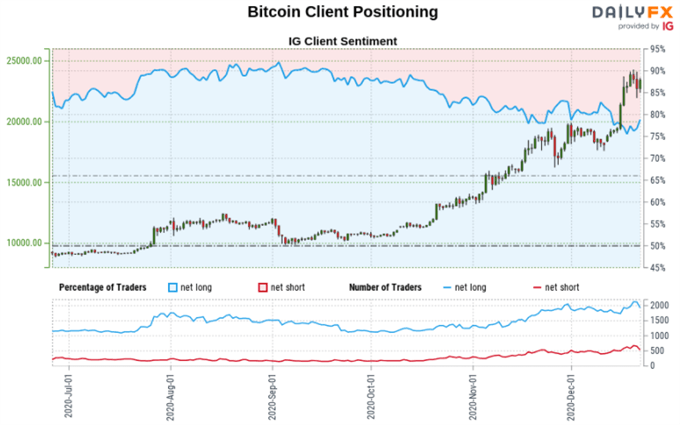
Bitcoin Sentiment Outlook – Bullish
The IGCS gauge implies that roughly 77% of retail traders are net long Bitcoin. Exposure to the downside has increased by 5.49% and 15.08% over a daily and weekly basis respectively. Recent changes in sentiment warn that the current price trend may soon reverse higher despite the fact traders remain netlong.

Recommended by Daniel Dubrovsky
How is IG Client Sentiment a contrarian indicator?
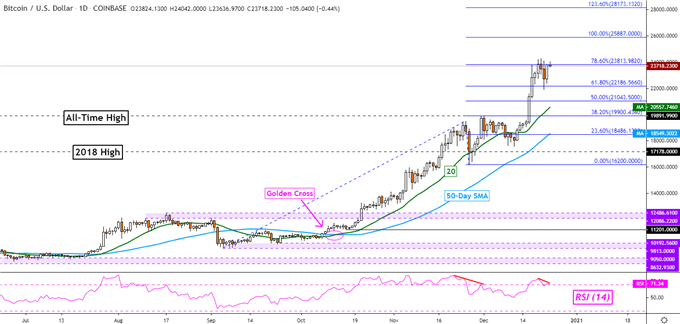
Bitcoin Technical Analysis
Bitcoin’s remarkable journey higher over the past couple of months is facing the 78.6% Fibonacci extension at 23813 on the daily chart below. Further upside progress may be met with negative RSI divergence, an ominous sign of fading momentum that could threaten a turn lower towards support.
BTC/USD Daily Chart
Bitcoin Chart Created in Trading View
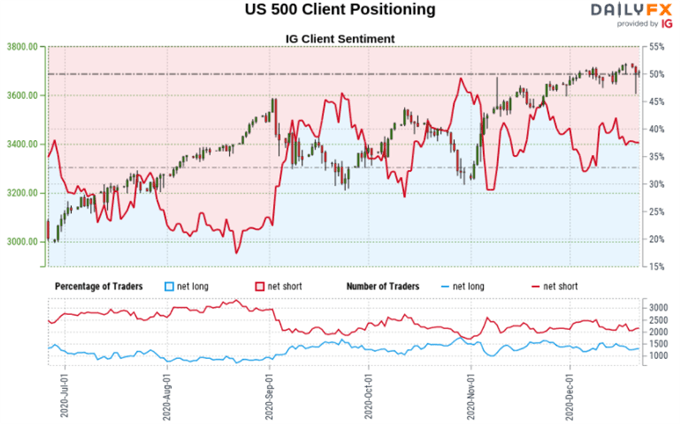
S&P 500 Sentiment Outlook – Bullish
The IGCS gauge implies that about 39% of retail traders are net long the S&P 500. Upside exposure has decreased by 2.16% and 11.66% over a daily and weekly basis respectively. The combination of current sentiment and recent changes offers a stronger bullish contrarian trading bias.

Recommended by Daniel Dubrovsky
Check out our fresh outlook for stocks in the first quarter!
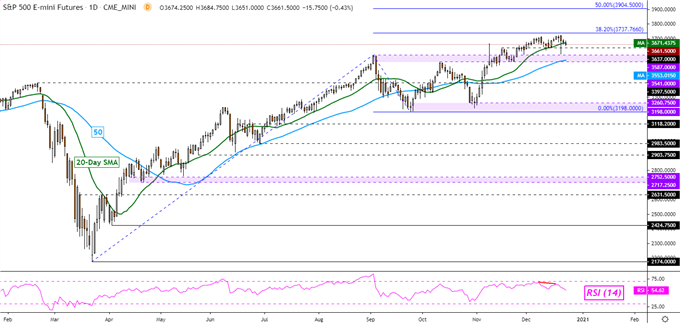
S&P 500 Technical Analysis
S&P 500 futures have turned lower recently after stopping short of the 38.2% Fibonacci extension at 3737. This also follows negative RSI divergence, warning that further losses may be in store. A break under the 20-day Simple Moving Averaged (SMA) could open the door to testing the 50-day one.
S&P 500 Futures Daily Chart
S&P 500 Chart Created in Trading View
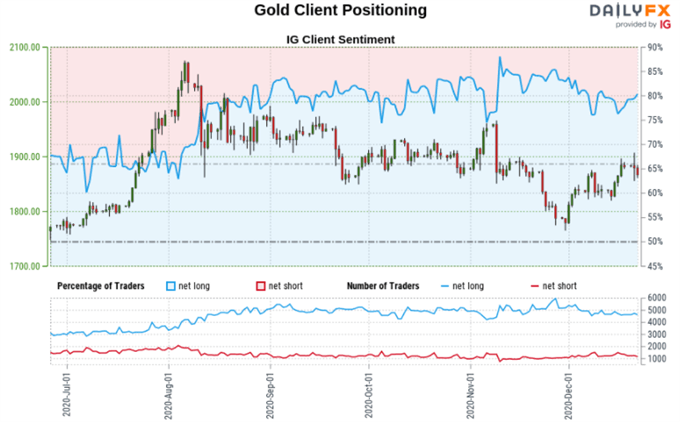
Gold Sentiment Outlook – Bearish
The IGCS gauge implies that about 82% of retail investors are net long gold. Downside exposure has decreased by 7.17% and 23.10% over a daily and weekly basis respectively. The combination of current sentiment and recent changes offers a stronger bearish contrarian trading bias.
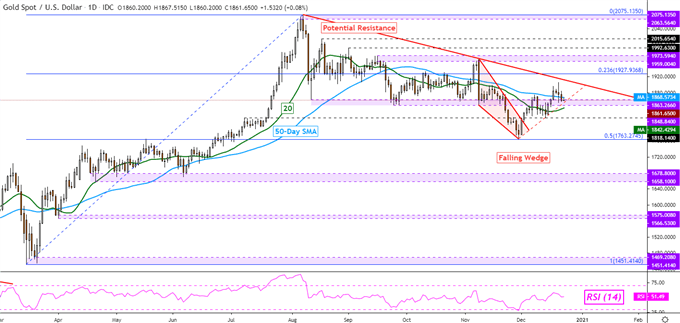
Gold Technical Analysis
Following recent losses, gold prices remain in a short-term uptrend from late November, supported by a rising trendline. XAU/USD struggled to hold a push above the 50-day SMA after taking out the 20-day one. A fall under the latter may open the door to extending losses.
XAU/USD Daily Chart
Gold Chart Created in Trading View
*IG Client Sentiment Charts and Positioning Data Used from December 23rd Report
— Written by Daniel Dubrovsky, Currency Analyst for DailyFX.com
To contact Daniel, use the comments section below or @ddubrovskyFX on Twitter


