Bitcoin (BTC/USD) Price Analysis:
- Bitcoin prices continue to rise after breaking above the psychological level of $50,000
- BTC/USD now appears to be aiming for another fresh all-time high
- US Dollar weakness continues to support short-term price action
Bitcoin bulls have managed to regain control over short-term price action, allowing the major cryptocurrency to maintain the upward trajectory that has persisted since late last year.
Despite the existing dichotomy between precious metals and cryptocurrencies, recent price action suggests that Bitcoin may portray safe-haven characteristics, particularly as an inflationary hedge, competing with the likes of Silver and Gold. Although both retailers and institutions continue to support the potential adoption of digital currencies as a medium of exchange, BTC/USD price action continues to be driven by speculation, along with prevailing flows of the global reserve currency, the US Dollar.


Recommended by Tammy Da Costa
Improve your trading with IG Client Sentiment Data
Bitcoin (BTC/USD) Technical Analysis
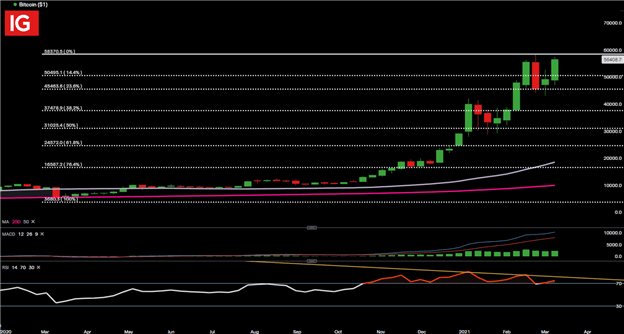
A pullback in prices from February’s all-time high proved to be a mere pullback rather than a change in trend. Although US Dollar weakness has helped to buoy gains for Bitcoin bulls, the technicals suggest that the potential of a fresh all-time high being reached in the near-term remains on the cards, at least for now.
Since reaching a new high on 21 February 2021, upward momentum faltered, resulting in a depreciation of approximately $10,000. Now, after re-engaging above the key psychological level of $50,000, bulls look eager to retest February levels of $58,000, currently providing resistance. For now, both the RelativeStrength Index (RSI) and the Moving Average Convergence/Divergence (MACD) remain in oversold territory on the weekly chart, while recent divergence of the RSI may be suggestive of diminishing momentum, which may provide bears with an opportunity to push back, towards the $50,000 mark.


Recommended by Tammy Da Costa
Download Your free Bitcoin Trading Guide
Bitcoin (BTC/USD) Weekly Chart
Chart prepared by Tammy Da Costa, IG
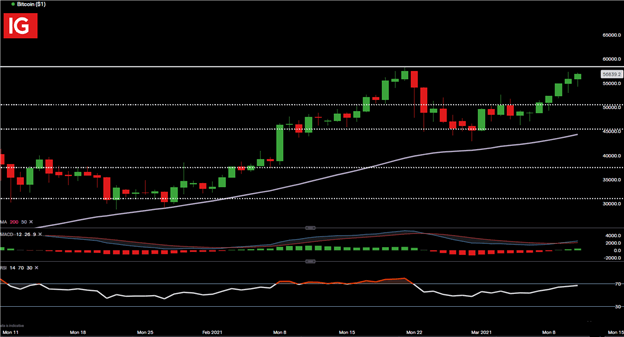
Meanwhile, on the daily chart, price action remains above the 50 Day Moving Average, providing additional support for short-term price action, with a MACD crossover occurring above the zero line. Meanwhile, the RSI is currently within range but is nearing 70, threatening oversold territory.


Recommended by Tammy Da Costa
Discover the importance of confidence in trading
Bitcoin (BTC/USD) Daily Chart
Chart prepared by Tammy Da Costa, IG
— Written by Tammy Da Costa, Market Writer for DailyFX.com
Contact and follow Tammy on Twitter: @Tams707


