Leonid Sukala/iStock via Getty Images
In our last Bitcoin (BTC-USD) market analysis, we discussed the potential for a bearish reflexive rally. This rally indeed began March 13th, and now investors want to know how much higher Bitcoin can go.
Why Is Bitcoin Going Up?
To analyze Bitcoin’s recent price trend, there are a three indicators I am watching closely. This includes:
- BTC exchange balances
- Glassnode’s – Accumulation Trend Score
- BTC 1+ year old supply
Throughout 2022, Bitcoin’s price has remained rangebound and volatile due to an overall lack of demand. However, 2 weeks ago something in the air shifted, and onchain indicators have flashed bullish ever since.
Currently, demand for Bitcoin seems to have increased dramatically due to two reasons:
- The Fed’s 25 bp rate hike removed uncertainty from the market.
- There is rising speculation regarding an upcoming US Bitcoin spot ETF.
Additionally, the Terra Luna (LUNA-USD) Foundation recently began purchasing Bitcoin in $100+ million daily purchases. All this spot demand has caused Bitcoin’s price to grind higher since mid-March.
Exchange Balances
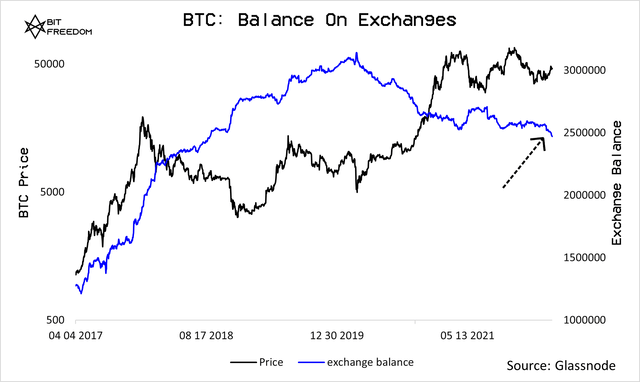
One of the most fundamental ways to analyze demand for Bitcoin is by tracking exchange balances. As we can see, BTC exchange balances have recently began falling sharply:
BTC exchange balance (Glassnode)
These outflows have caused the exchange balance to break below its year-long consolidation range. If this is the start of a new downward sloping trend, then price can be expected to push higher.
Accumulation Trend Score
Exchange balances clearly show that Bitcoin’s scarcity is increasing. But who is buying?
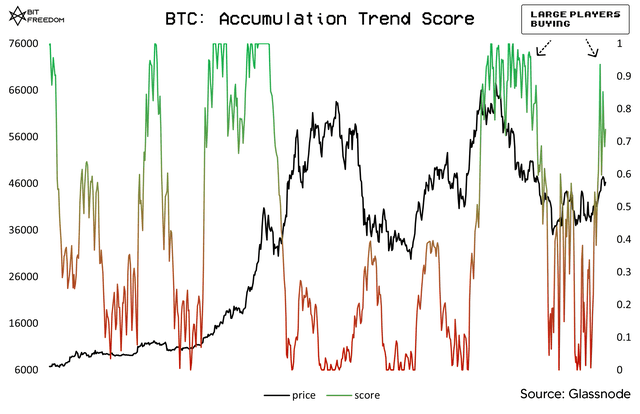
We can chart institutional demand for Bitcoin through Glassnode’s Accumulation Trend Score. This score reflects the relative size of entities that are actively accumulating (green) vs. distributing (red):
Accumulation trend score (Glassnode)
According to Glassnode:
-
A score closer to 1 reflects that, over the last month, big participants (or a big part of the network) have been accumulating coins.
-
A score closer to 0 reflects that, over the last month, big participants haven’t been accumulating coins or that they have been selling them.
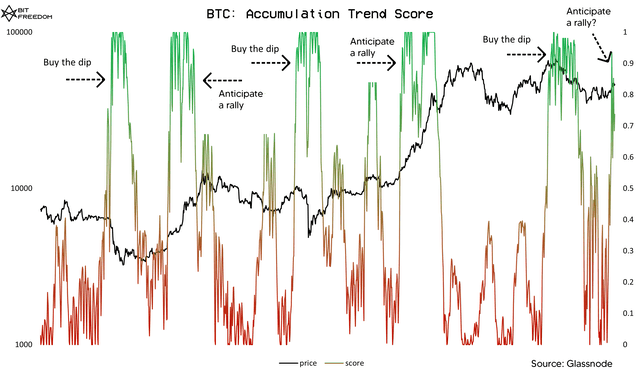
As we can see in the chart above, a majority of Bitcoin’s circulating supply has shifted to being accumulated, rather than sold. Typically, Bitcoin accumulation periods last for a couple months, and they occur as a result of large players either ‘buying the dip’ or ‘anticipating a rally’. The chart below identifies all the rallies and dips that have caused large Bitcoin holders to go on buying sprees:
Accumulation trend score (Glassnode)
Currently, it appears that institutions are anticipating a parabolic price rally. Notably, the last time the Accumulation Trend Score flashed green while Bitcoin’s price simultaneously moved bullish occurred between September and October 2020.
Coinciding with the data in the chart above, Coinshares reported last week that digital asset investment products saw their largest inflows since December 2021. To my understanding, institutions and sovereign wealth funds are most likely buying BTC in preparation for the release of a US Bitcoin spot ETF.
In fact, CEO of Galaxy Digital (OTCPK:BRPHF) Mike Novogratz hinted recently that he believes a spot ETF could release this year. Does he know something we don’t?
BTC 1+ Year Old Supply
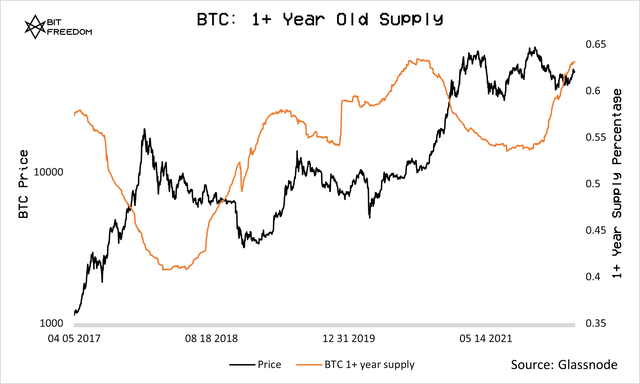
Lastly, the percentage of Bitcoin’s supply aged 1+ years also typically acts as a leading indicator for parabolic price rallies. This supply (BTC aged 1+ years) is important because coins that reach this age are considered ‘less liquid’, or less likely to be sold. As we can see in the chart below, the last two times that the 1+ year old supply reached over 60% of the circulating supply, this subsequently lead to large price increases:
Bitcoin 1+ year supply percentage (Glassnode)
Summary
All this points to a bullish outlook for Bitcoin in the long term. Institutional demand is clearly present; however, momentum traders and retail investors are yet to enter back into the crypto market.
To outline everything covered:
- Bitcoin has been rapidly leaving exchanges since mid-March.
- Large players including institutions, sovereign wealth funds, and the Terra Luna Foundation are observably buying Bitcoin in massive quantities.
- The supply of ‘long-term’ or 1+ year old Bitcoin is increasing parabolically, and it has recently crossed the 60% mark for the third time ever.


