
Pgiam/iStock via Getty Images
Investment Thesis
Technology’s takeover of the process activity of investing – continuity of equity pricing and transactions – some time ago created the separate, but essentially attached markets providing for large volume, irregularly serviced, quick & quiet, honest, legal public transactions needed by multi-billion-$ portfolios of “institutional investment” organizations.
They are accomplished by sheltering Market-Maker firms’ necessary temporary risk-taking activities with price-change “insurance” provided by “derivative” securities of options, futures, swaps, and other exotic legal contracts. The related, but separate markets making those available and effective also provide dynamic information about the coming-price expectations of the users of those markets reflecting both sides of the underlying transactions causing their existence.
That extensive flow of expectations allows and encourages direct comparisons of Risk and Reward across widely diverse opportunity sets. This article particularly explores a comparison of Apple, Inc. (NASDAQ:AAPL) stock and Seagate Technology (STX) stock, among several related competitors, all as seen by Market-Makers responding to institutional investor volume transaction orders..
Description of Primary Investment Interest
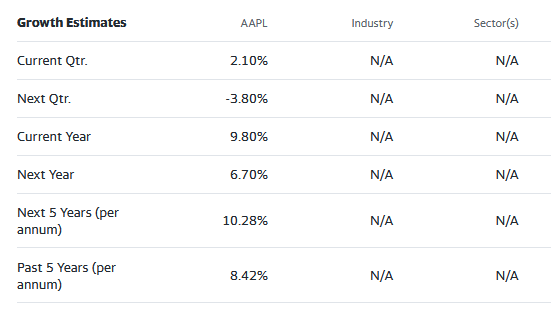
“Apple Inc. designs, manufactures, and markets smartphones, personal computers, tablets, wearables, and accessories worldwide. It also sells various related services. In addition, the company offers iPhone, a line of smartphones; Mac, a line of personal computers; iPad, a line of multi-purpose tablets; AirPods Max, an over-ear wireless headphone; and wearables, home, and accessories comprising AirPods, Apple TV, Apple Watch, Beats products, HomePod, and iPod touch. The company serves consumers, and small and mid-sized businesses; and the education, enterprise, and government markets. It distributes third-party applications for its products through the App Store. The company also sells its products through its retail and online stores, and direct sales force; and third-party cellular network carriers, wholesalers, retailers, and resellers. Apple Inc. was incorporated in 1977 and is headquartered in Cupertino, California.”
Source: Yahoo Finance
Yahoo Finance
Description of Secondary Investment Interest
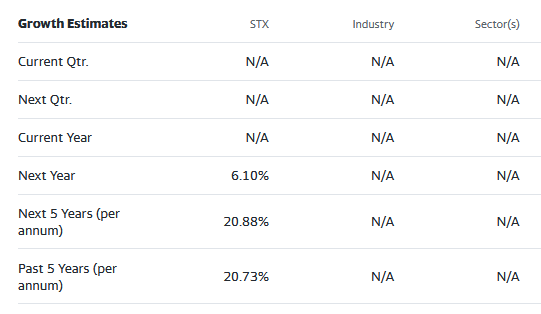
“Seagate Technology Holdings plc provides data storage technology and solutions in Singapore, the United States, the Netherlands, and internationally. The company offers hard disk and solid state drives, including serial advanced technology attachment, serial attached SCSI, and non-volatile memory express products; solid state hybrid drives; and storage subsystems. Seagate Technology Holdings plc was founded in 1978 and is based in Dublin, Ireland.”
Source: Yahoo Finance
Yahoo Finance
The Competitive Investment Picture
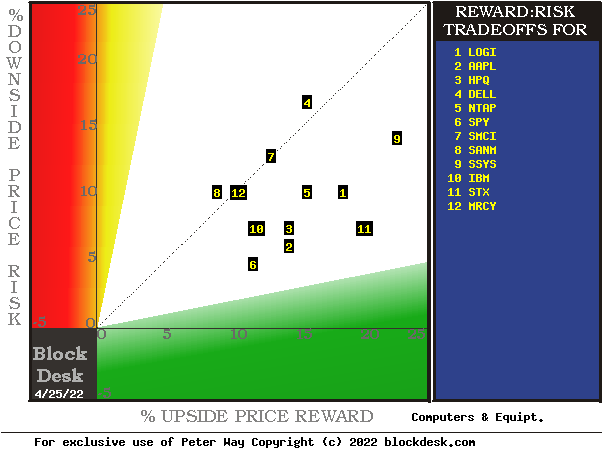
Here are Prospective Reward and Risk perceptions of the Institutional Investing community implied by hedging actions impacts on related derivative securities. These reflect substantial real-money commitments making it possible to take multi-million-$ positions in the furtherance of intended performances in typical billion-$ client investment portfolios.
Figure 1
blockdesk.com
(used with permission)
Upside price rewards are from the behavioral analysis (of what to do right, not of errors) by Market-Makers [MMs] as they protect their at-risk capital from possible damaging future price moves. Their potential reward forecasts are measured by the green horizontal scale.
The risk dimension is of actual price drawdowns at their most extreme point while being held in previous pursuit of upside rewards similar to the ones currently being seen. They are measured on the red vertical scale.
Both scales are of percent change from zero to 25%. Any stock or ETF whose present risk exposure exceeds its reward prospect will be above the dotted diagonal line.
Our principal interest is in AAPL at location [2] and secondarily in STX at [11]. A “market index” norm of reward~risk tradeoffs is offered by SPY at [6]. Some comparison difficulties of Figure 1 are more apparent in Figure 2, particularly where questions of “how likely” some competitive advantages may be to achieve.
Figure 2

blockdesk.com
(used with permission)
Figure 2’s purpose is to attempt universally comparable answers, stock by stock, of a) How BIG the price gain payoff may be, b) how LIKELY the payoff will be a profitable experience, c) how soon it may happen, and d) what price drawdown RISK may be encountered during its holding period.
Readers familiar with our style of analysis may now want to skip down to Recent Trends in Price Range Expectations
The price-range forecast limits of columns [B] and [C] get defined by MM hedging actions to protect firm capital required to be put at risk of price changes from volume trade orders placed by big-$ “institutional” clients.
[E] measures potential upside risks for MM short positions created to fill such orders, and reward potentials for the buy-side positions so created. Prior forecasts like the present provide a history of relevant price draw-down risks for buyers. The most severe ones actually encountered are in [F], during holding periods in effort to reach [E] gains. Those are where buyers are most likely to accept losses.
[H] tells what proportion of the [L] sample of prior like forecasts have earned gains by either having price reach its [B] target or be above its [D] entry cost at the end of a 3-month max-patience holding period limit. [ I ] gives the net gains-losses of those [L] experiences and [N] suggests how credible [E] may be compared to [ I ].
Further Reward~Risk tradeoffs involve using the [H] odds for gains with the 100 – H loss odds as weights for N-conditioned [E] and for [F], for a combined-return score [Q]. The typical position holding period [J] on [Q] provides a figure of merit [fom] ranking measure [R] useful in portfolio position preferencing. Figure 2 is row-ranked on [R] among candidate securities, with STX in top rank.
Recent Trends in Price Range Expectations
Figure 3
blockdesk.com
(used with permission)
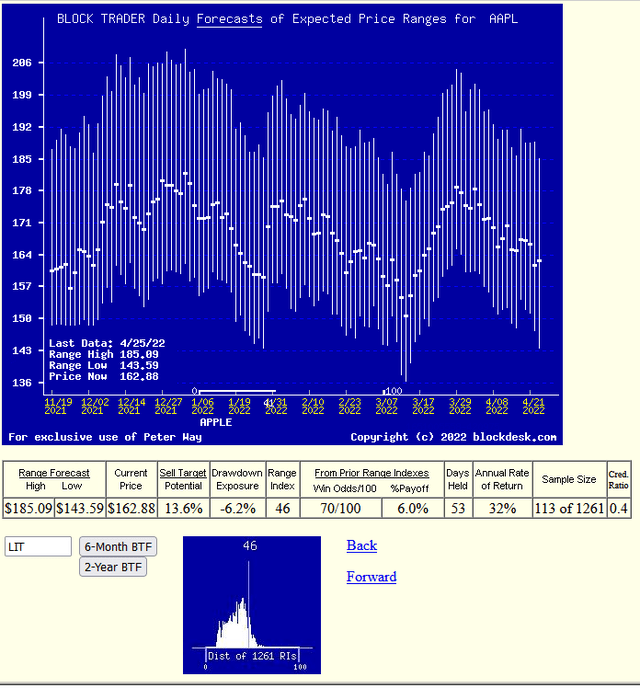
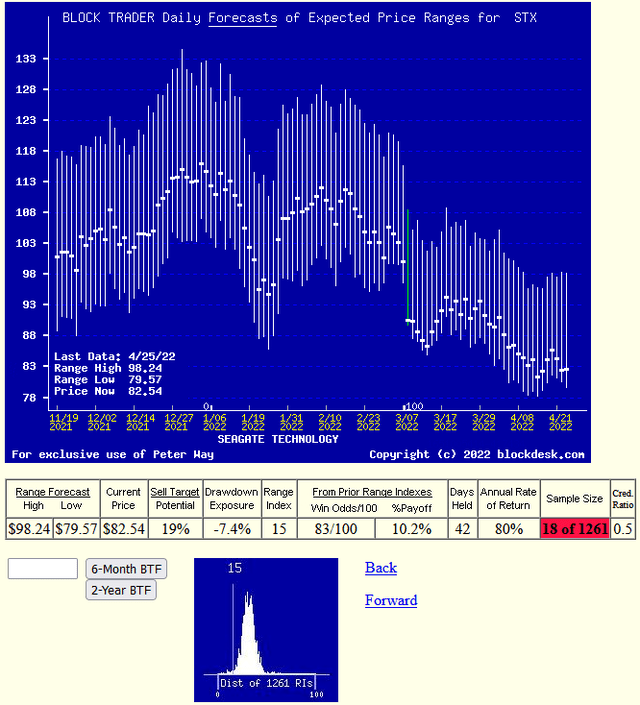
Our graphics showing stock price data repeatedly through time are often mistaken to be “technical analysis CHARTS” of purely PAST historical data. Instead, the vertical lines here are FORECASTS of COMING PRICE RANGES implied by the actions taken in the market-making community to provide protection for capital required to be at risk while achieving pricing continuity through times of transactions. The ranges are split into explicit upside and downside fractions at the points of the forecast day’s closing market price, as described for Figure 2. Range Index [RI] is the operative measure.
Those splits make clear the opposing price expectations trends in each issue being evaluated. The experienced subsequent market price actions of prior forecasts with up-to-down balances like today’s provide guidance as to likely coming experiences.
Figure 4 offers the same just past six month time period for STX as seen in Figure 3 for AAPL.
Figure 4
blockdesk.com
(used with permission)
The higher Win Odds, shorter holding period to greater % Payoff, and larger CAGR rates of prior forecast rewards urge capital commitments at this time to be directed into near-term investments in STX rather than AAPL unless tax considerations prohibit.
Conclusion
This analysis leads to an investment choice under active investing strategy of preferring Seagate Technology over Apple, Inc. stock.


