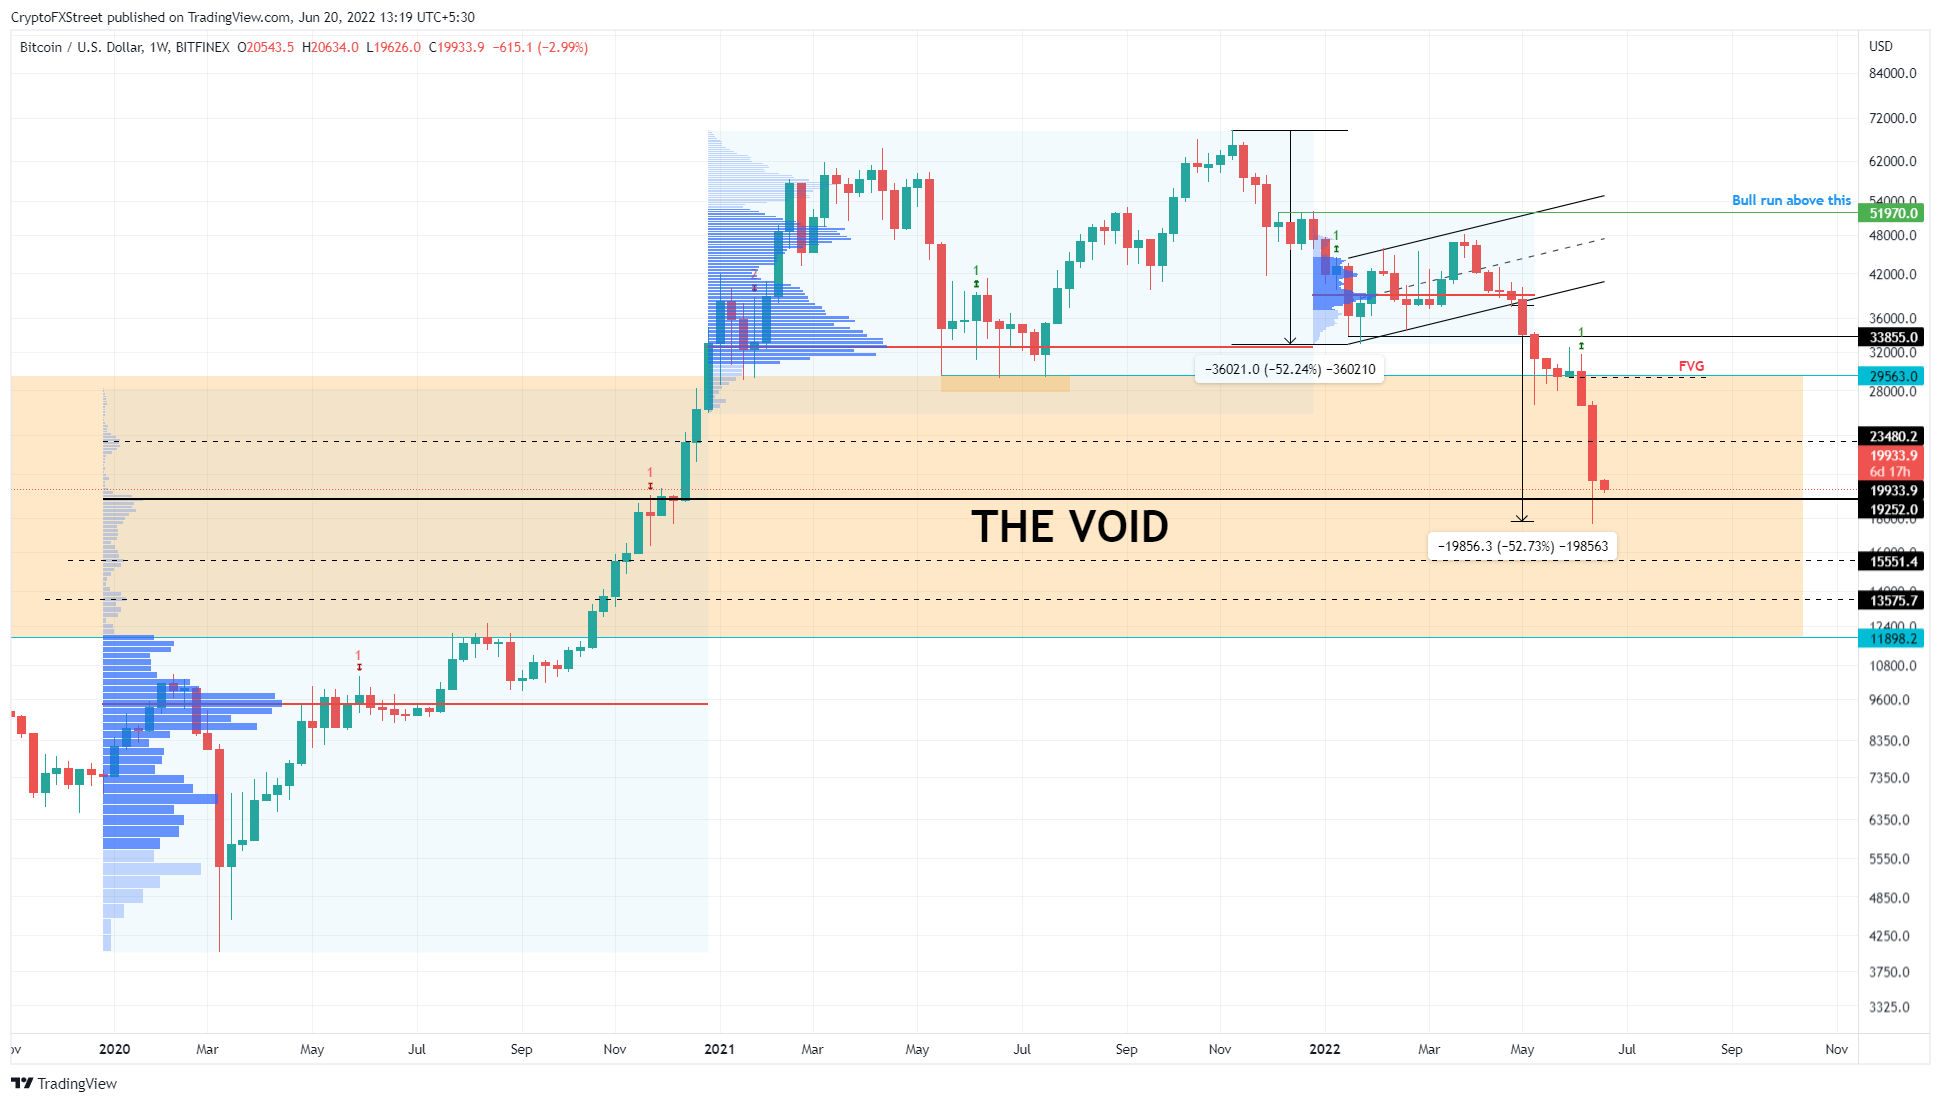
- Bitcoin price stabilizes around $19,252, which is the midpoint of the Void, extending from $29,563 to $11,898.
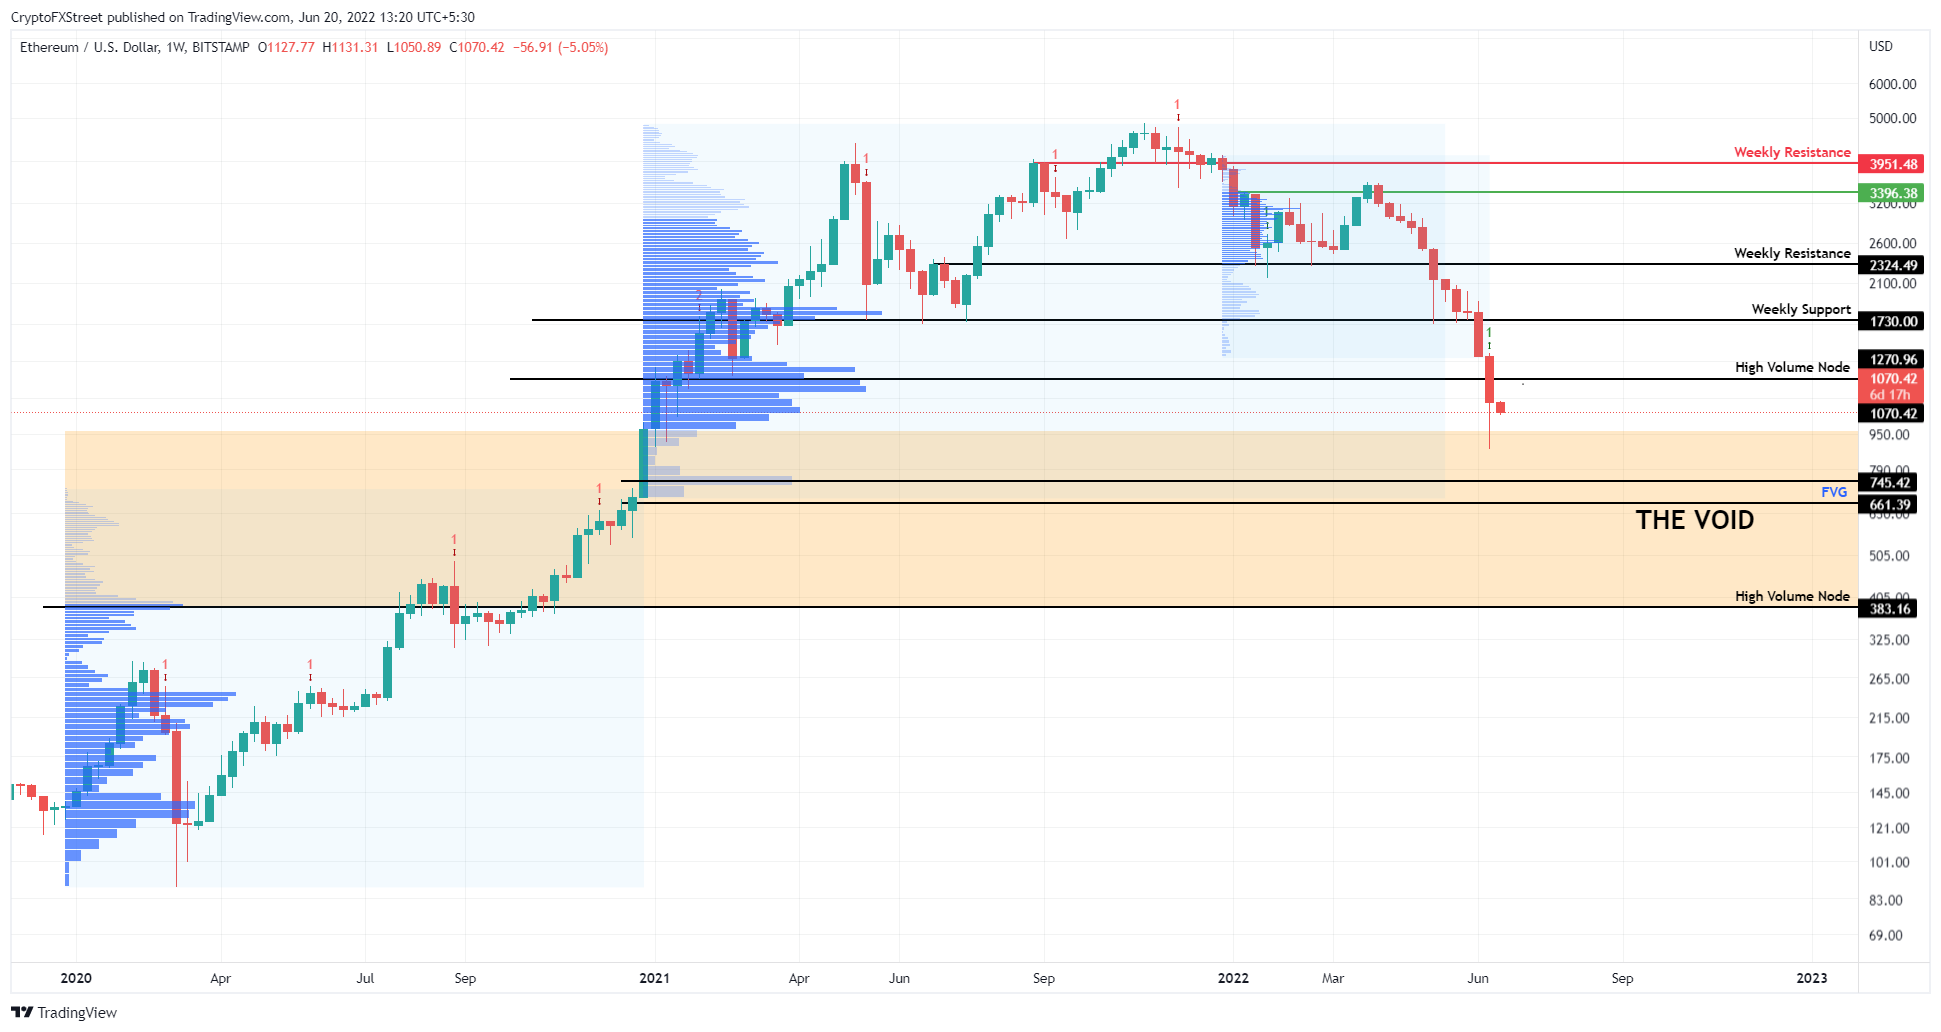
- Ethereum price retracts quickly as it dips into the low volume profile area, ranging from $964 to $383.
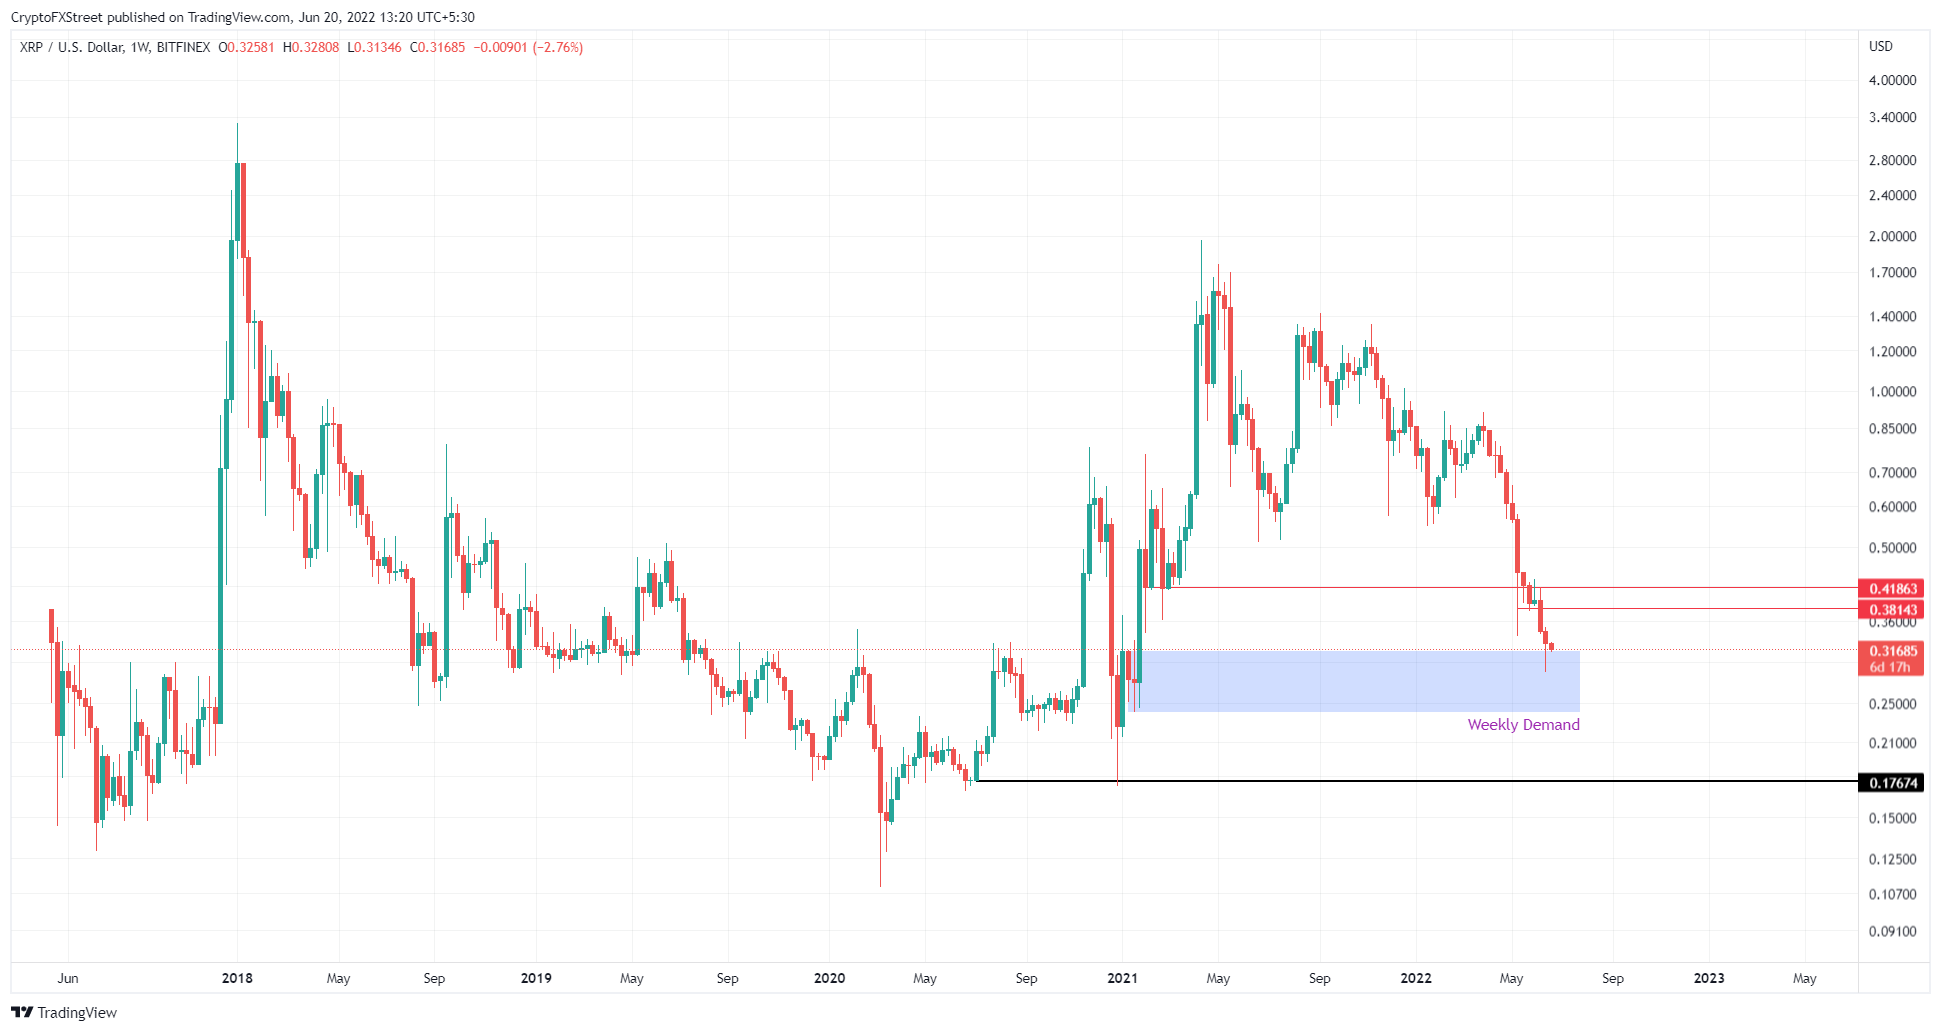
- Ripple price drives into the weekly demand zone, stretching from $0.240 to $0.315.
Bitcoin price has shown incredible elasticity after it snapped back after dipping below a stable support level. This quick but small recovery has caused some altcoins – not Ethereum and Ripple – to bounce massively. Synthetic (SNX) price has rallied 121% over the last day or so.
Bitcoin price stands up against bears
Bitcoin price dipped below the $19,252 support level and set a swing low at $17,605 over the last two days. This sudden drop was met with buying pressure from sidelined bulls that eventually pushed the weekly candlestick up by 16% from the swing low.
As a result, the weekly candlestick showed -22% returns instead of -33%. Interestingly, this bounce has also pushed BTC above the $19,252 support level, suggesting that the bulls could be planning a recovery rally.
Going forward, if this momentum continues, there is a chance that the Bitcoin price might climb higher and retest the $23,480 hurdle. This run-up would constitute a 17% gain from the current position – $20,055.
While this up move might seem bullish, investors need to understand that the macro outlook is predominantly bearish.
BTC/USD 1-week chart
Although things are looking ‘on the fence’ for Bitcoin price, there is a possibility that a sudden spike in selling pressure could produce a weekly candlestick close below $19,252, thus invalidating BTC’s recovery thesis. In such a case, the big crypto will crash 20% to revisit the $15,551 support floor.
Ethereum price at inflection point
Ethereum price has recovered 28% since setting a swing low at $880 over the last week. Now, with the start of a new week, ETH has seen more selling, suggesting that the downtrend could continue.
Since ETH has breached the $1,270 high volume node, the chances of it dipping down to the next high volume node at $745 seem likely. This move will allow help for the smart contract token to fill the price inefficiency aka Fair Value Gap (FVG), extending up to $661.
In case of a minor uptrend, the $1,270 resistance barrier will stifle momentum, leading to rejection and a pullback for Ethereum price.
ETH/USD 1-week chart
Regardless of the bearish outlook, if Ethereum price produces a weekly candlestick close above $1,270, it will invalidate the bearish outlook. This development should provide buyers another chance at a recovery rally to $1,730.
Ripple price continues to slide lower
Ripple price dipped into the $0.240 to $0.315 weekly demand zone and then recovered 13% from the lowest point at $0.287. However, the fresh start to the week is already seeing heavy pressure by sellers. Fortunately for XRP price, the demand zone is a significant source of support and is less likely we will see a massive sell-off.
However, if Ripple price pierces the 50% point of this weekly demand zone at $0.275, it will indicate that the sell orders are far exceeding the existing buy orders, suggesting that the bears are back in control.
In such a case, investors can wait for a weekly candlestick close below $0.40 to confirm the incoming downtrend. A breakdown of this barrier will potentially crash XRP price by 26% to 0.176.
XRP/USD 1-week chart
It is also possible Ripple price could witness a bounce off the $0.240 to $0.315 weekly demand zone triggering a recovery rally to $0.381. If XRP price produces a weekly candlestick close above $0.418, it will dent the ongoing bearish thesis and breathe hope into sidelined buyers.


