Nikada/iStock Unreleased via Getty Images
Chart created by writer from C Trader.
Apple Inc. (NASDAQ:AAPL) has been in a long term uptrend which appears to have come to an end during late April 2022. It then saw a clear lower low on a macro timeframe, contributed to by rising inflation globally, coupled with supply chain issues. This article covers Apple’s break of its previous low and how it can potentially land at $117 next.
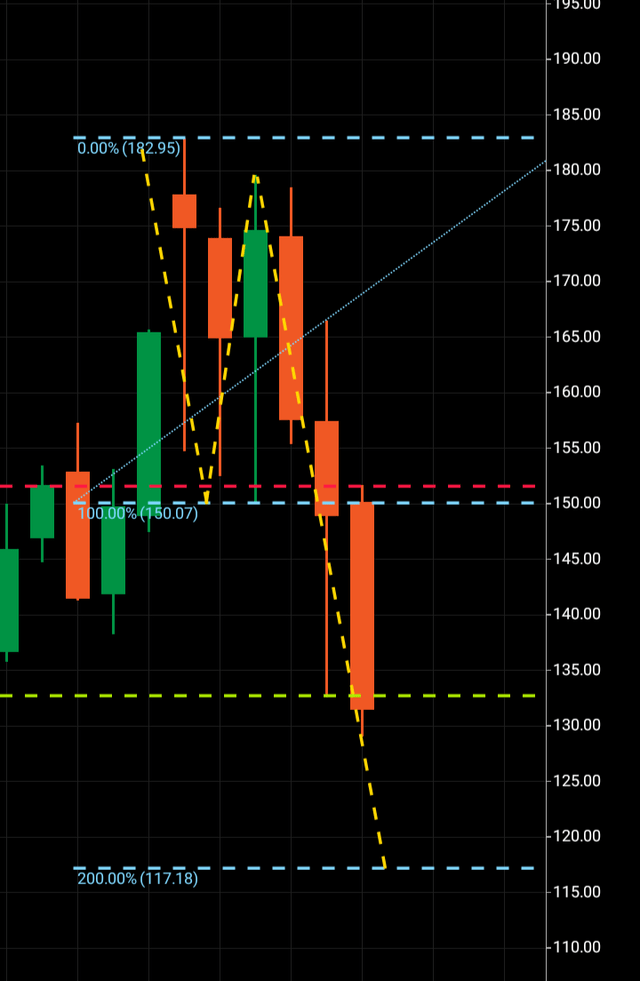
Apple is in a three wave structure where, if wave three numerically replicates wave one, it will land at $117. Apple topped out in this current structure at $182. Dropping to $150 to form the now wave one downwards before seeing an attempt to break above $182 but ultimately failing at the $179 region. This can now be interpreted as the macro wave two, with a drop below $150 confirming the wave three. So far, Apple has bottomed in the current pattern at $132.
Firstly we can look at the monthly chart to identify the three macro waves in play. Then, we move to the weekly chart to examine the latest break down.
In the monthly chart above, we can see wave one $182-$150. Wave two, $150-$179. A clear break below $150 technically commences the wave three. We can also see the initial attempt at creating support at $132. Now we can move to the weekly structure to examine this latest lower low.
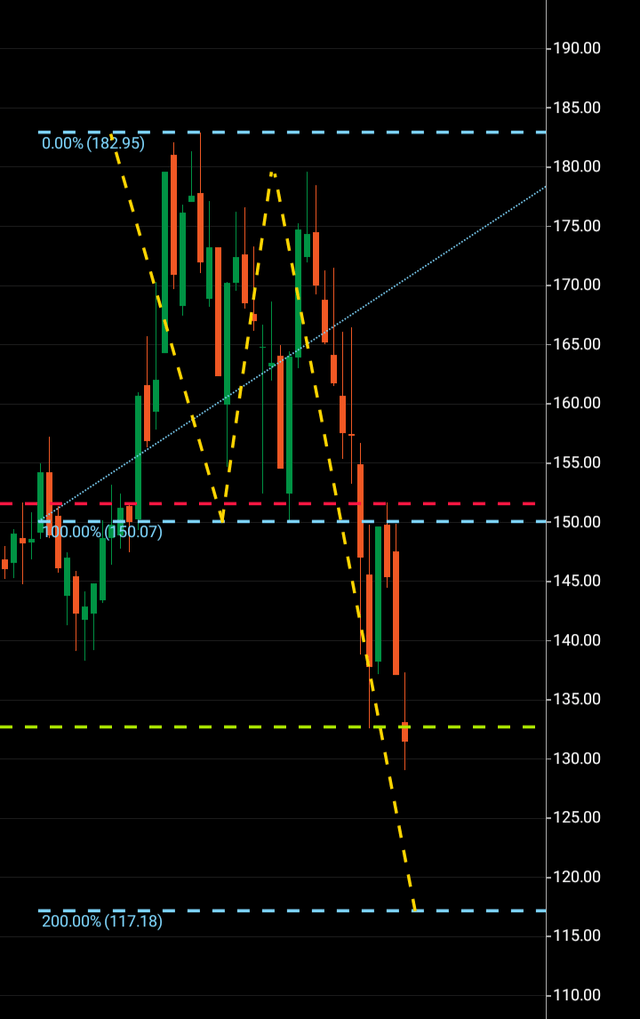
Here, it is possible to identify the macro wave two high at $179 in more detail, with a clear drop to the $132 region before finding a bullish weekly candle. In order for a three wave pattern to form, ideally a bullish candle is needed in a bearish set up. This is the signal that confirms the mismatch between buyers and sellers.
In a bullish pattern, the opposite is needed, a bearish rejection which then would confirm the mismatch in an upward structure. This break of $132 is specifically relevant, as with the bullish candle formation it technically creates an internal wave inside the macro chart that can see Apple potentially go lower again. However, concentrating on the monthly chart, it is clear Apple has broken lower again from its previous support.
If wave three numerically copies wave one, Apple will land at $117, where I will be then looking for three wave patterns lending to its next immediate direction. I would expect Apple to complete its third wave and land at target in the next 90-120 days. An immediate move above $153, which is the high of the bullish weekly candle, would lower the probability of the third wave completing and a break above $182 before touching $117, rendering the third wave a fail. Given the advances Apple has made downwards since its break of $150, I have listed a strong sell for this equity.
About the Three Wave Theory
The three wave theory was designed to be able to identify exact probable price action of a financial instrument. A financial market cannot navigate it’s way significantly higher or lower without making waves. Waves are essentially a mismatch between buyers and sellers and print a picture of a probable direction and target for a financial instrument. When waves one and two have been formed, it is the point of higher high/lower low that gives the technical indication of the future direction. A wave one will continue from a low to a high point before it finds significant enough rejection to then form the wave two. When a third wave breaks into a higher high/lower low the only probable numerical target bearing available on a financial chart is the equivalent of the wave one low to high point. It is highly probable that the wave three will look to numerically replicate wave one before it makes its future directional decision. It may continue past its third wave target but it is only the wave one evidence that a price was able to continue before rejection that is available to look to as a probable target for a third wave.


