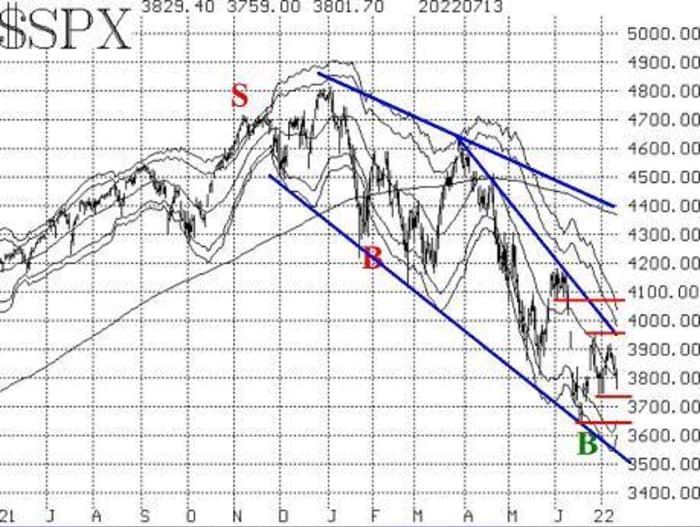
The S&P 500 index continues to trade in a bear market. The S&P chart has clear downtrend lines, surrounding a series of lower highs and lower lows. That is our definition of a bear market. Recent rally attempts, based on oversold buy signals coming out of the June lows, have not had much success.
Currently there is SPX
SPX,
support at 3740, which will likely be tested soon — perhaps today. Then there is support at the year-to-date lows of 3630.
Lawrence McMillan
Meanwhile, there is resistance at the late June rally highs of 3930. A move higher than that is going to run into the declining “modified Bollinger Bands.” But in the classic sense, there is also resistance at 4017 (where the June gap is closed) and then at 4070 – the bottom of the early June trading range.
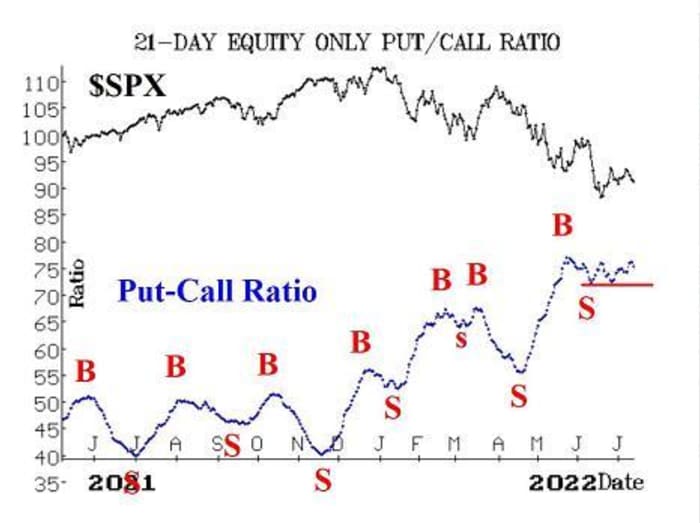
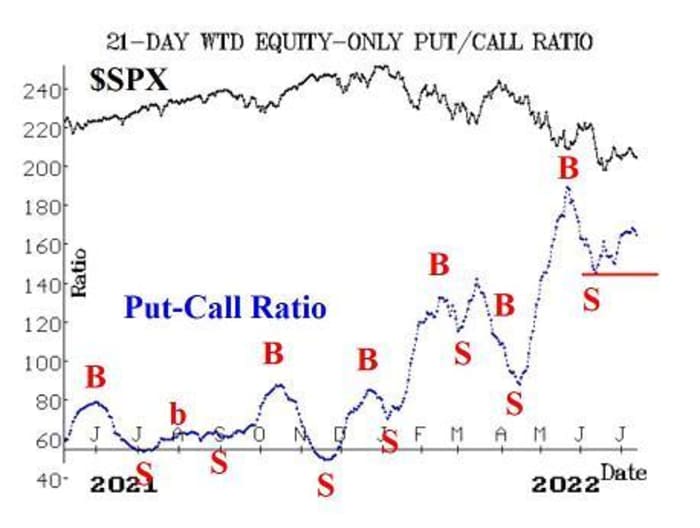
Equity-only put-call ratios continue to remain on sell signals. In reality, they are sort of meandering sideways, but won’t give confirmed buy signals unless they break down below their early June lows. Those levels are marked with a horizontal red line on the accompanying charts.
Lawrence McMillan
Lawrence McMillan
Market breadth has been one of the more positive indicators, as both breadth oscillators last gave buy signals on July 1 and have somewhat surprisingly held onto them since then. That is, despite the market struggling with economic numbers, breadth has not been bad.
However, today’s action may finally roll these breadth oscillators back over to sell signals in an oversold state.
New 52-week highs continue to be few in number. Most days see only single-digits in the “new highs” count on the NYSE. As a result this indicator remains on a sell signal.
VIX
VIX,
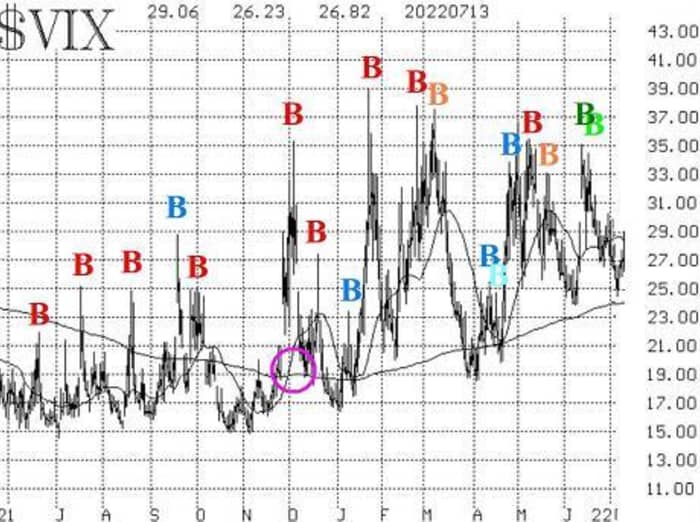
remains in a world of its own. It has declined substantially since the latest “spike peak” buy signals of mid-June, and those signals have not yet been stopped out. A 3.00-point or greater rise, over any three-day or shorter period, would stop them out.
Lawrence McMillan
Meanwhile, VIX dropped down toward its rising 200-day moving average but did not close below it. Thus, the intermediate-term signal – the trend of VIX – remains bearish for stocks. That 200-day MA is currently at 24 and rising, and if VIX were to close below there, that would stop out the sell signal (it would not, however, create a buy signal).
The construct of volatility derivatives remains modestly positive for stocks, in that the term structure of the VIX futures continues to slope upward.
In summary, we continue to maintain a “core” bearish position in line with the downtrend in SPX and the uptrend in VIX. We will trade confirmed buy signals around that “core” position.
New recommendation: Apple
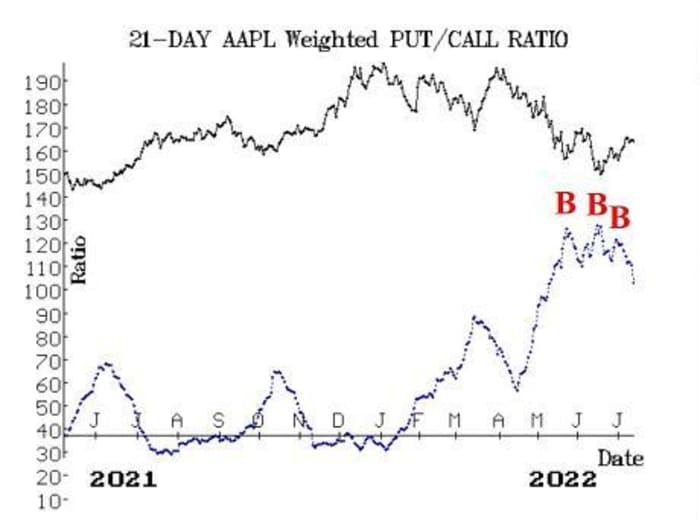
A put-call-ratio buy signal has been generated in Apple
AAPL,
Buy 2 AAPL Sep (16th) 150 calls
In line with the market.
AAPL: 144.05 Sept (16th) 150 call: 5.90 bid, offered at 5.95
We will hold this as long as the put-call ratio buy signal remains in effect.
Lawrence McMillan
Follow-up action
All stops are mental closing stops unless otherwise noted.
We are going to implement a “standard” rolling procedure for our SPY spreads: in any vertical bull or bear spread, if the underlying hits the short strike, then roll the entire spread. That would be roll up in the case of a call bull spread, or roll down in the case of a bear put spread. Stay in the same expiration, and keep the distance between the strikes the same unless otherwise instructed.
Long 2 expiring SPY July (15th) 366 puts and short 2 SPY July (15th) 346 puts: We originally bought this spread
SPY,
in line with the sell signal from the trend of VIX. It was rolled down twice. Now roll again, to the August (19th) expiration, keeping the strikes the same. We will stop this position out if VIX falls below its 200-day moving average, which is currently just below 24.
Long 5 KOD July (15th) 10 calls: Continues to hold without a stop.
Long 1 SPY July (22nd) 382 call and short 1 SPY July (22nd) 397 call: This spread was originally bought in line with the most recent VIX “spike peak” buy signal of June 15. It was rolled up when SPY traded at 382. This signal would be stopped out if VIX returns to spiking mode. That is, if $VIX closes at least 3.00 points higher over any one-, two- or three-day period, then exit this spread. Today that would be a VIX close above 29.17. The stop can move each day. If you are stopped out, then re-enter a long bull spread position when the next “spike peak” buy signal occurs.
Long 3 expiring AMLX July (15th) 22.5 calls: These calls were rolled up with Amylyx Pharmaceuticals
AMLX,
traded at 22.50 on July 7. Roll to the Aug (19th) 22.5 calls. Raise the closing stop to 17.00
Long 1 SPY Aug (19th) 378 call and short 1 SPY Aug (19th) 398 call: This spread was bought in line with the McMillan Volatility Band (MVB) buy signal. Its target is for SPX to touch the +4σ Band. The signal would be stopped out if SPX were to close below the -4σ Band.
Long 10 CRNT Aug (19th) 2.5 calls: Hold while the takeover rumors play out.
Long 2 COWN Aug (19th) 30 calls: The stock has moved higher as the rumors persist. Continue to hold without a stop.
The put-call ratio in News Corp
NWSA,
is no longer on a buy signal, and the conditions for buying the NWSA calls were not met. So, this recommendation is canceled.
Send questions to: lmcmillan@optionstrategist.com.
Lawrence G. McMillan is president of McMillan Analysis, a registered investment and commodity trading advisor. McMillan may hold positions in securities recommended in this report, both personally and in client accounts. He is an experienced trader and money manager and is the author of the bestselling book “Options as a Strategic Investment“.
Disclaimer: ©McMillan Analysis Corporation is registered with the SEC as an investment advisor and with the CFTC as a commodity trading advisor. The information in this newsletter has been carefully compiled from sources believed to be reliable, but accuracy and completeness are not guaranteed. The officers or directors of McMillan Analysis Corporation, or accounts managed by such persons may have positions in the securities recommended in the advisory.


