adventtr/iStock via Getty Images THE PETER DAG PORTFOLIO STRATEGY AND MANAGEMENT

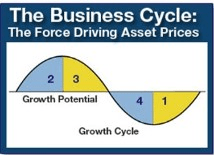
The critical phase of the business cycle is Phase 4. Its length depends on how long it takes to bring inventories in line with sales, to lower inflation and interest rates to levels needed by consumers to become more positive about the future, and to bring down costs to improve companies’ profitability. The longer it lasts, the more severe economic weakness will be.
The beginning of Phase 1 signals a period of economic expansion driven by increased production to build up inventories to match sales. This decision involves hiring new people, buying raw materials, and borrowing more to improve and expand capacity.
This is the time when interest rates and commodities bottom. They will start rising again when the business cycle moves into Phase 2 as the economy gains momentum.
Toward the end of Phase 2 commodities and inflation are rising as business keeps ramping up production to replenish inventories. The inventory to sales ratio is now declining rapidly as sales rise faster than inventories.
There is a point toward the end of Phase 2, however, when consumers are beginning to feel the impact of rising interest rates and inflation. The first signal is weakness in the housing sector. The demand for big-ticket items starts to slow down. Finally overall sales flutter.
The economy is now entering Phase 3. Inventories are beginning to rise faster than sales. At some point in Phase 3 business decides to reduce production to bring inventories under control. They will therefore reduce purchases of raw materials, reduce employment, and borrow less.
This process continues into Phase 4 with commodities, inflation, and interest rates peaking and then declining.
Let me recap.
- In Phase 1 commodities and interest rates bottom. Inflation has declined enough to improve consumers’ optimism.
- In Phase 2 commodities, interest rates, and inflation rise.
- In Phase 3 commodities, interest rates, and inflation peak.
- In Phase 4 commodities, interest rates, and inflation decline.
Let’s see now what is going on in real life.
COPPER (THE PETER DAG PORTFOLIO STRATEGY AND MANAGEMENT, STOCKCHARTS.COM)
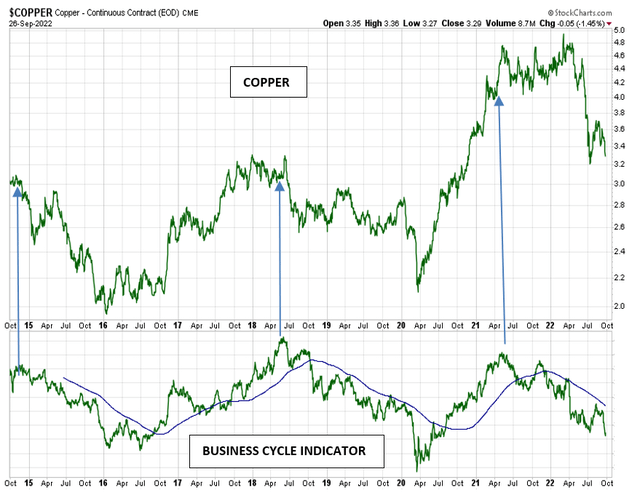
The above chart shows the price of copper (top panel) and the business cycle indicator (bottom panel). The business cycle indicator is a proprietary gauge computed in real time and published in each issue of The Peter Dag Portfolio Strategy and Management.
The chart shows copper rises when the business cycle indicator rises, reflecting improving business conditions lead by inventory accumulation.
Copper declines when the business cycle declines, reflecting a weakening economy due to the inventory correction caused by a slowdown in sales.
BITCOIN (THE PETER DAG PORTFOLIO STRATEGY AND MANAGEMENT, STOCKCHARTS.COM)
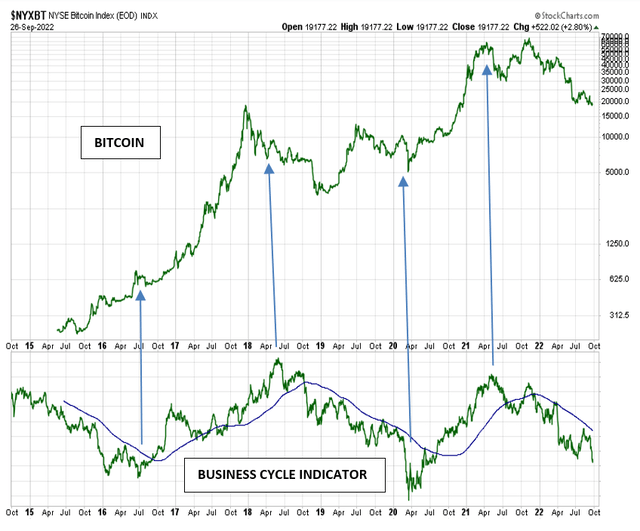
The above chart shows the price of Bitcoin (BTC-USD) (top panel) and the business cycle indicator (bottom panel). The business cycle indicator is a proprietary gauge computed in real time and published by The Peter Dag Portfolio Strategy and Management.
The graphs show the price of Bitcoin behaves like the price of copper and that of most other commodities. Its price rises when increased liquidity and a stronger economy move prices higher. The price of Bitcoin declines when Fed tightening is accompanied by a slowdown in business activity – as of now.
Key takeaways
- The business cycle is declining and is currently in Phase 4. The tightening of the Fed and the inventory correction will force commodities and Bitcoin prices to continue to decline.
- The price of Bitcoin will bottom when the business cycle moves into Phase 1 as business starts ramping up production to rebuild inventories. This is the time most other commodities are also rising, responding to the Fed’s easing that took place in Phase 4.


