The below is an excerpt from a recent edition of Bitcoin Magazine Pro, Bitcoin Magazine’s premium markets newsletter. To be among the first to receive these insights and other on-chain bitcoin market analysis straight to your inbox, subscribe now.
On-Chain Data Trends
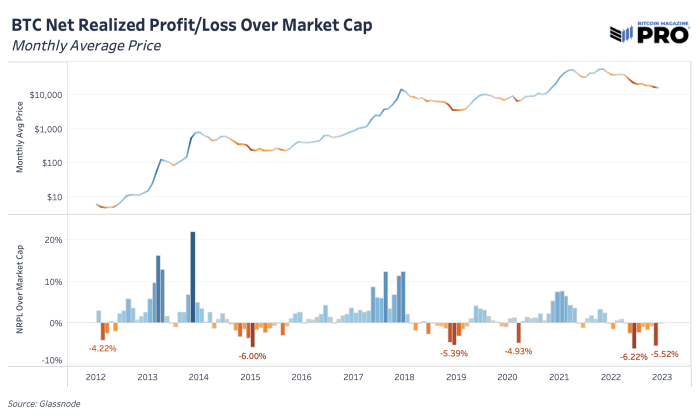
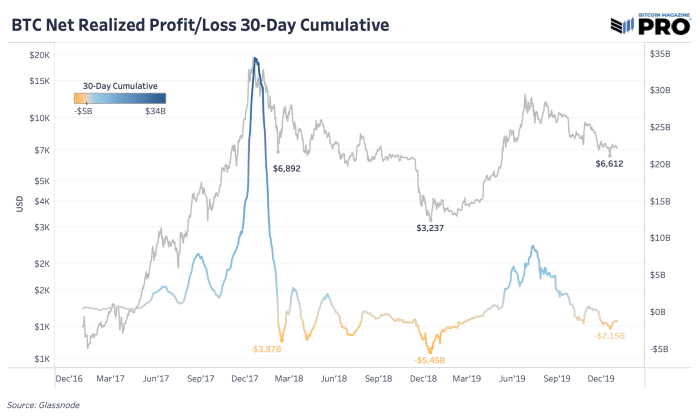
November was a painful month. By looking at on-chain realized profit and loss data, we can see that this was true for many forced-sellers of bitcoin. Before any bitcoin price bottom, a hallmark sign that you want to see is extended periods of forced selling, capitulation and rise in realized losses. One way to view this is by looking at the sum of realized profit and loss for each month relative to bitcoin’s total market cap. We saw these bottom signals in November 2022, and similarly in the July 2022 Terra/LUNA crash, March 2020 COVID fear and December 2018 cycle bottom capitulation events.
Looking at the 2018 cycle, the end was marked by excess realized losses, although this was much different with the forced liquidations and cascades of private balance sheet leverage and paper bitcoin unwinding that we saw this year.
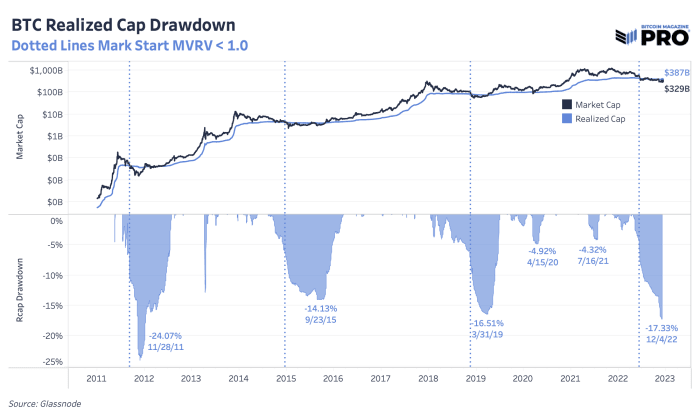
We’ve talked about the current drawdown in bitcoin’s price and how that compares to previous cycles many times over the last few months. Another way to look at cyclical drawdowns is to focus on bitcoin’s realized market capitalization — the average cost basis of the network which tracks the latest price where each UTXO moved last. With price being more volatile, realized price is a more stable view of bitcoin’s growth and capital inflows. The realized market capitalization is now down 17.33% which is significantly higher than 2015 and 2018 cycles of 14.13% and 16.51%, respectively.
As for duration, we’re 176 total days into the price being below bitcoin’s realized price. Those aren’t consecutive days as price can temporarily go above realized price, but price trends below realized price in bear market periods. For context, trends in 2018 were short-lived at around 134 days and the trends in 2014-15 lasted 384 days.
On one hand, bitcoin’s realized market capitalization has taken a significant hit in the previous round of capitulation. That’s a promising bottom-like sign. On the other hand, there’s a case to be made that price being below realized price could easily last another six months from historical cycles and the lack of capitulation in equity markets is still a major headwind and concern.
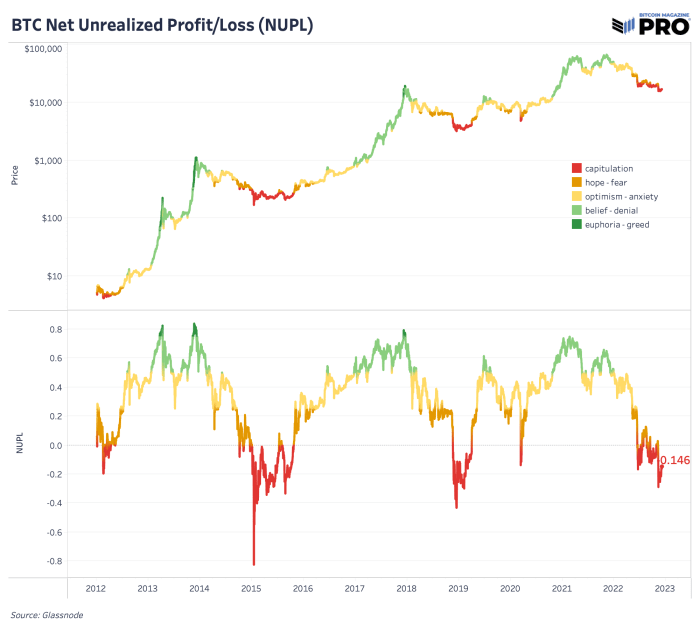
As per the net-unrealized-profit/loss (NUPL) ratio, we are firmly in the capitulation phase. NUPL can be calculated by subtracting the realized cap from market cap and dividing the result by the market cap, as described in this article authored by By Tuur Demeester, Tamás Blummer and Michiel Lescrauwaet.
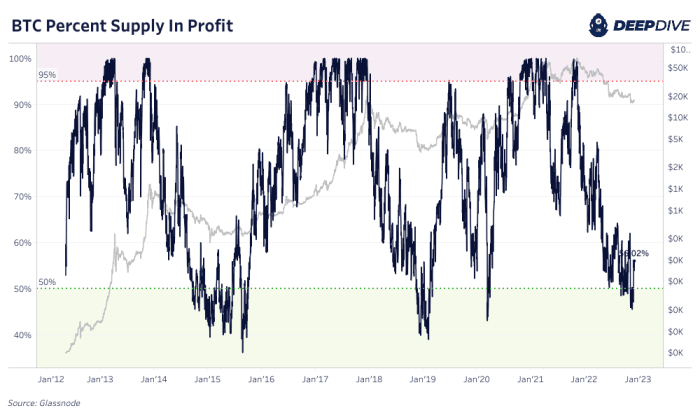
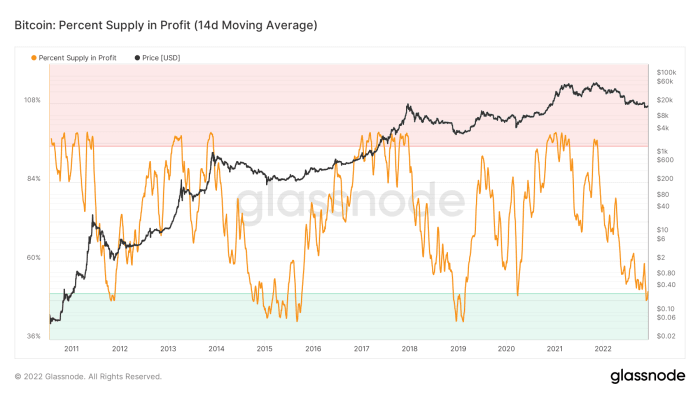
There is no denying it: For bitcoin-native cycles, we are firmly in the capitulation phase. Currently, only 56% of circulating supply was last moved on-chain in profit. On a two-week moving average basis, under 50% supply was last moved above the current exchange rate, which is something that has only ever happened in the depths of previous bear-market lows.
When thinking of the bitcoin exchange rate, the numerator side of the equation is historically cheap. The Bitcoin network continues to produce a block approximately every 10 minutes in an unabated fashion, as hash rate ticks higher and as the ledger offers an immutable settlement layer for global value. The speculation, leverage and fraud of the previous cycle is washing to shore and bitcoin continues to exchange hands.
Bitcoin is objectively cheap relative to its all time history and adoption phases. The real question over the immediate future is the denominator. We have talked at length about the global liquidity cycle and its current track. Despite being historically cheap, bitcoin is not immune to a sudden strengthening in the dollar because nothing truly is. Exchange rates are relative and if the dollar is squeezing higher, then everything else will subsequently fall — at least momentarily. As always, position sizing and time preference is key for all.
As for the catalyst for a surge higher in the dollar denominator of the bitcoin exchange rate (BTC/USD), there are 80 trillion possible catalysts…


