

The Bitcoin (BTC) price fell significantly on January 3, erasing nearly two weeks of earlier gains.
However, the price has regained its footing and nearly retraced the drop, returning close to its previous highs.
Bitcoin Consolidates Above Resistance
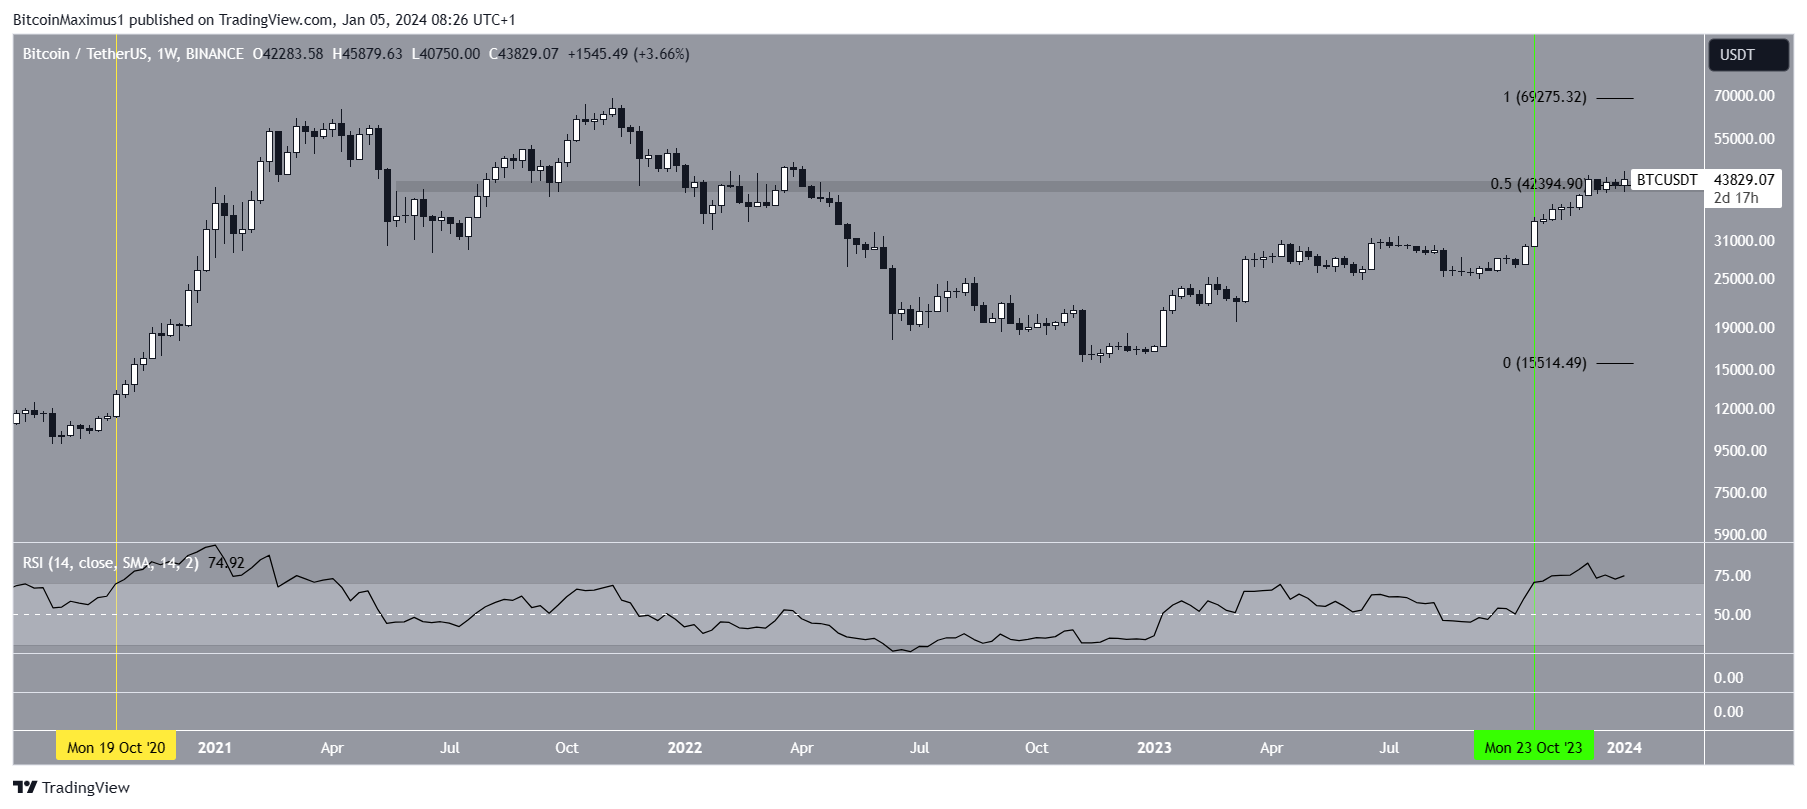
The technical analysis from the weekly time frame shows that the BTC price has been in an upward trend since the start of 2023. The increase accelerated once the weekly Relative Strength Index moved into overbought territory (green).
The RSI is a momentum indicator traders use to evaluate whether a market is overbought or oversold and whether to accumulate or sell an asset. Readings above 50 and an upward trend suggest that bulls still have an advantage, while readings below 50 indicate the opposite.
Interestingly, a similar thing happened in the previous bullish cycle (yellow) regarding the price and RSI movement.
Currently, the BTC price trades above an important horizontal and Fib retracement resistance level.
Speculation about the potential BTC Exchange-Traded Fund (ETF) approval is rampant. The Securities and Exchange Commission (SEC) will decide on the ETF between January 8 and 10. Coinbase is poised to play a major role as a middleman between stock exchanges and the crypto market once the ETF is approved.
However, more than 60% of financial advisors do not anticipate that the SEC will approve the ETF. This starkly contrasts crypto enthusiasts, nearly 90% of whom believe the approval is imminent.
Read More: Where To Trade Bitcoin Futures
Will the Bitcoin ETF Be Approved?
Senior ETF analyst for Bloomberg Eric Balchunas believes the BTC ETF will be approved. He anticipates leaks and chatter before the actual decision, tweeting:
That said, we going to see leaks/chatter that SEC has verbally approved over next 72hrs, which is true. And we’ll see 19b-4s refiled which you could argue means we home free. But not 100% official till SEC says it.
Cryptocurrency analyst Scott Melker stated that he has heard that issuers already know that the ETFs are being approved, and issuers are aware of this and preparing.
Caitlin Cook presents a very interesting thread. She suggests that even though crypto enthusiasts are bullish about the potential of the ETF approval, they are still drastically underestimating the long-term effect it may have.
The Registered Investment Advisory industry manages $114 trillion in assets. Many individuals globally seek a modest crypto allocation for potential upside, viewing it as a volatile but enticing segment of their portfolio.
Despite crypto enthusiasts’ different perspectives, most investors desire a simple, set-and-forget approach. While some may find crypto ETFs mundane, they bring meaningful participants, marking just the beginning of a broader trend.
Read More: Who Owns the Most Bitcoin in 2024?
BTC Price Prediction: What Happens Until the ETF?
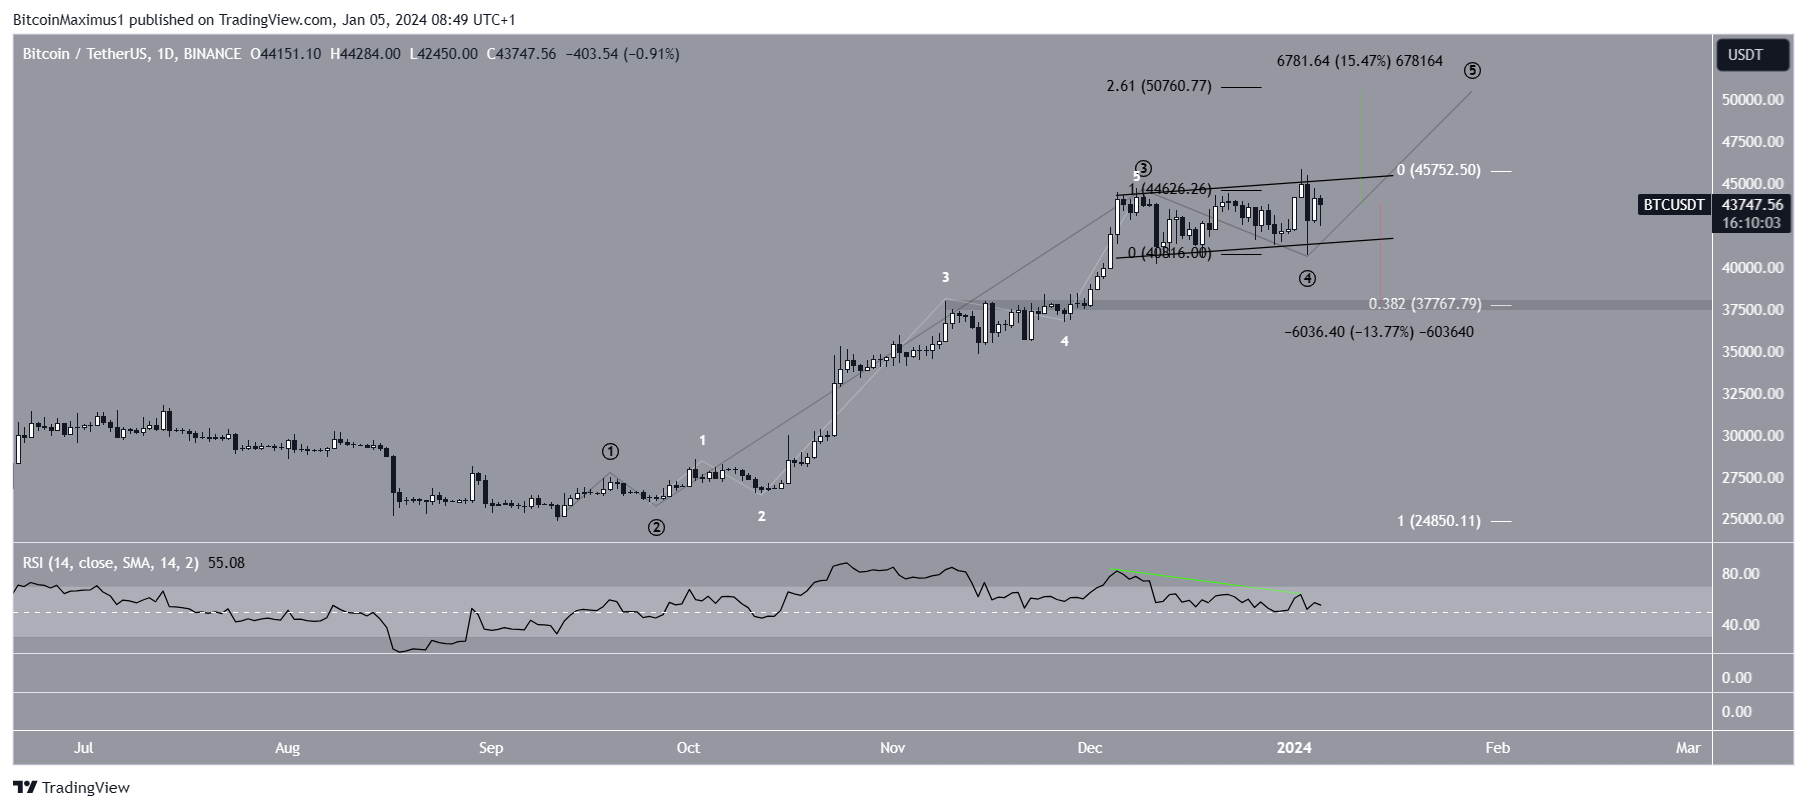
Unlike the weekly one, the technical analysis of the daily time frame presents a mixed outlook due to the price action, Elliott Wave count, and RSI readings.
Technical analysts utilize the Elliott Wave theory to ascertain the trend’s direction by studying recurring long-term price patterns and investor psychology.
The most likely count suggests that the price has completed wave four in a five-wave upward movement. An ascending parallel channel contained wave four, which was a running flat correction. Significant upward movements often follow these types of corrections.
However, the daily RSI has generated a bearish divergence, a sign of weakness. A Bitcoin decrease had already occurred after the divergence, so that the bearish signal may have played out.
If the BTC price breaks out from the channel, it can increase by 15% to the next resistance at $50,800. The 2.61 external retracement of wave four creates the resistance.
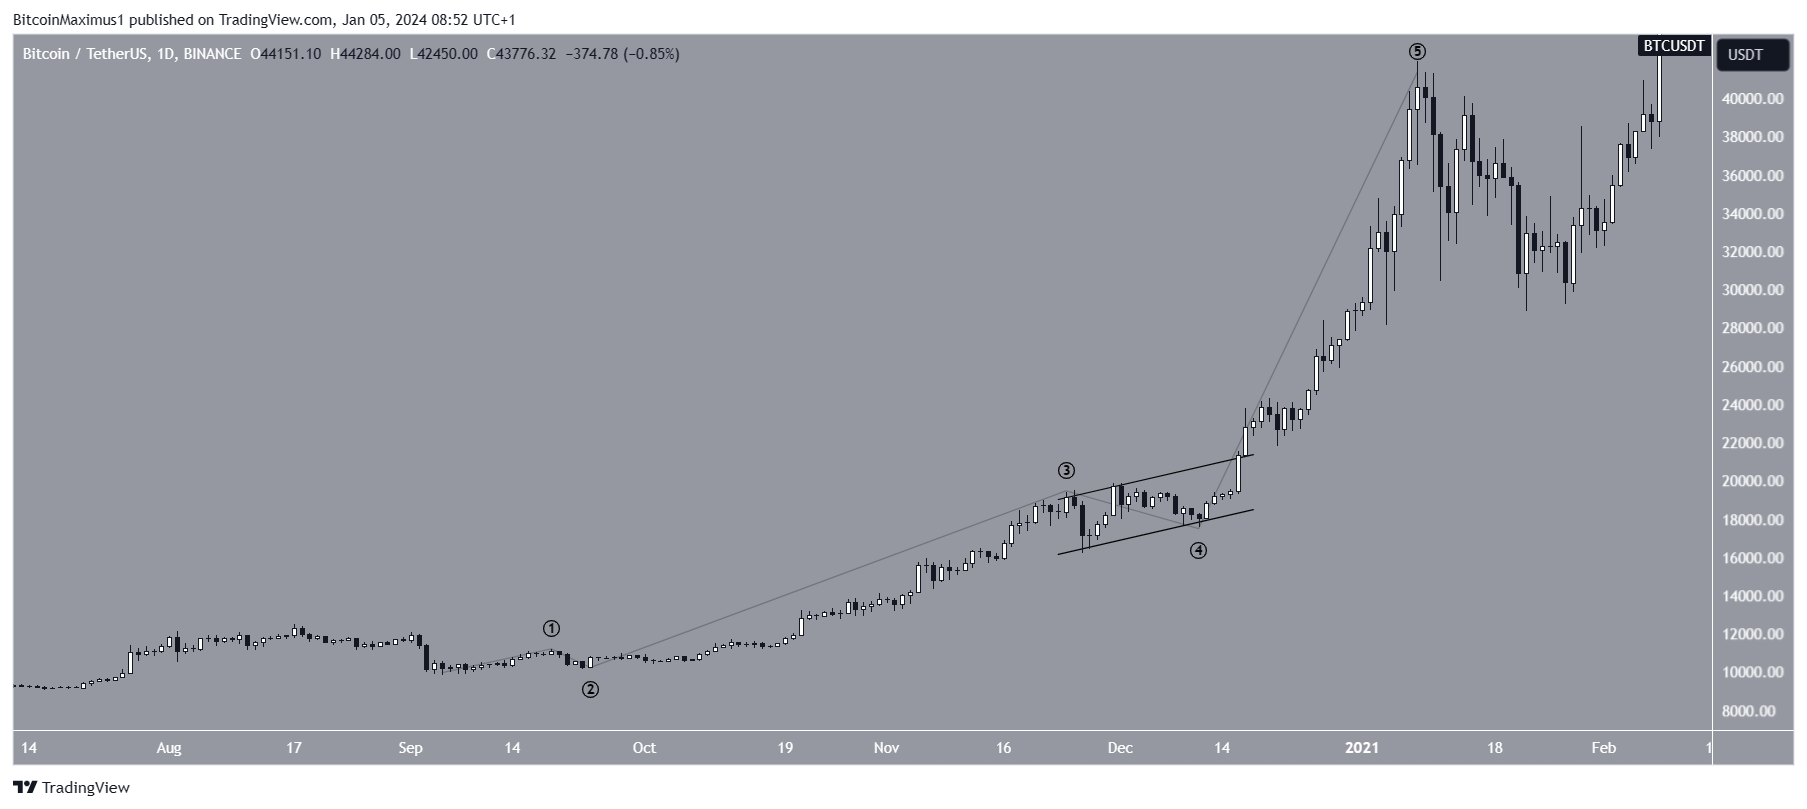
A very interesting fractal comes from November 2020. Then, the Bitcoin price completed a similar wave four in an ascending parallel channel before a breakout led to a parabolic rally.
Interestingly, this occurred shortly after the weekly RSI crossed into overbought territory, as outlined in the first section.
Despite this bullish BTC price prediction, a breakdown from the channel will mean the price is still being corrected. This could lead to a 14% drop to the closest support at $37,800.
For BeInCrypto’s latest crypto market analysis, click here.
A Basic Guide On How Bitcoin Transactions Work – YouTube
Disclaimer
In line with the Trust Project guidelines, this price analysis article is for informational purposes only and should not be considered financial or investment advice. BeInCrypto is committed to accurate, unbiased reporting, but market conditions are subject to change without notice. Always conduct your own research and consult with a professional before making any financial decisions. Please note that our Terms and Conditions, Privacy Policy, and Disclaimers have been updated.

