Quick Take
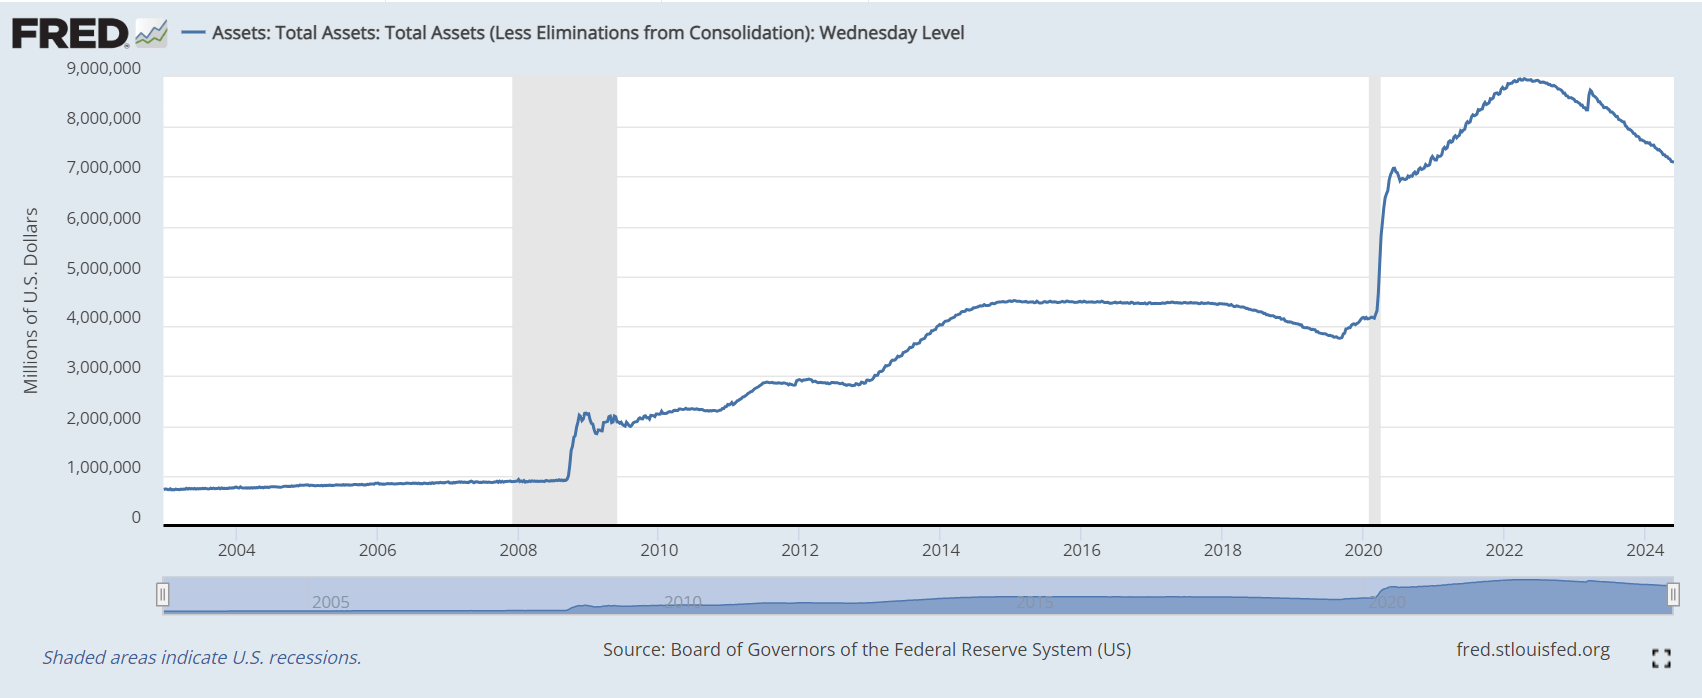
Analyzing recent data from the Federal Reserve Economic Data (FRED), we observe significant trends in the Federal Reserve’s balance sheet and the M2 money supply. The Federal Reserve’s balance sheet has been gradually declining (quantitative tightening), now standing at $7.3 trillion, down from a peak of $9.0 trillion in April 2022. Despite this reduction, it remains considerably higher than the pre-COVID-19 level of $4.1 trillion, indicating more than $3 trillion yet to be trimmed.

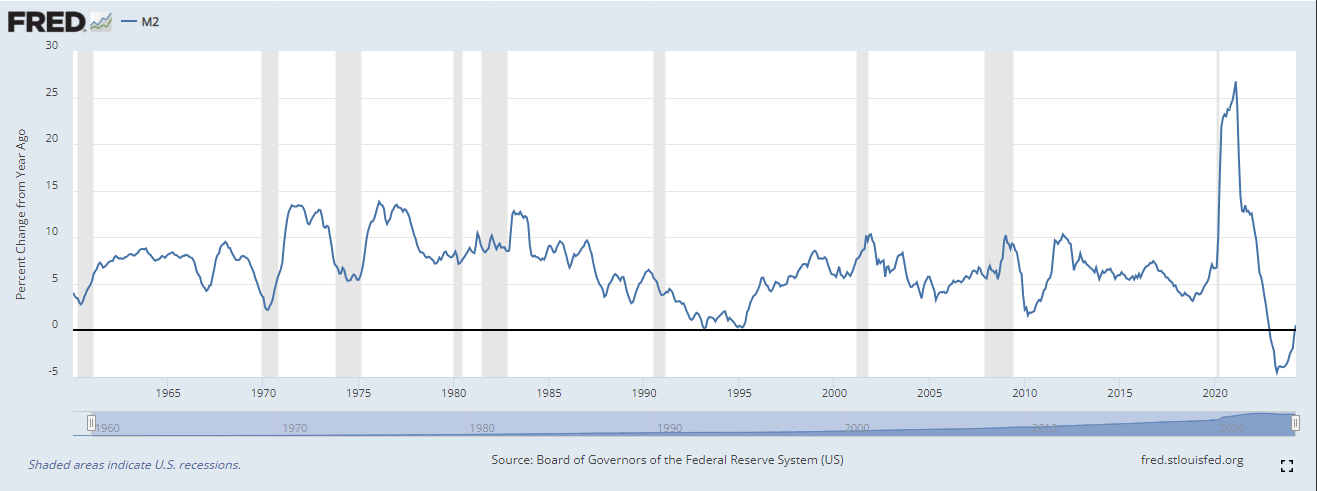
M2 money supply, which includes cash, checking deposits, and easily convertible near money, reached a peak of $21.7 trillion in 2022 and hit a low of $20.7 trillion in October 2023. It has since begun to rise, currently at $20.9 trillion, according to FRED.


FRED data also shows that the M2 money supply’s year-over-year percentage change has turned positive for the first time since November 2022, signaling potential tailwinds for risk assets.


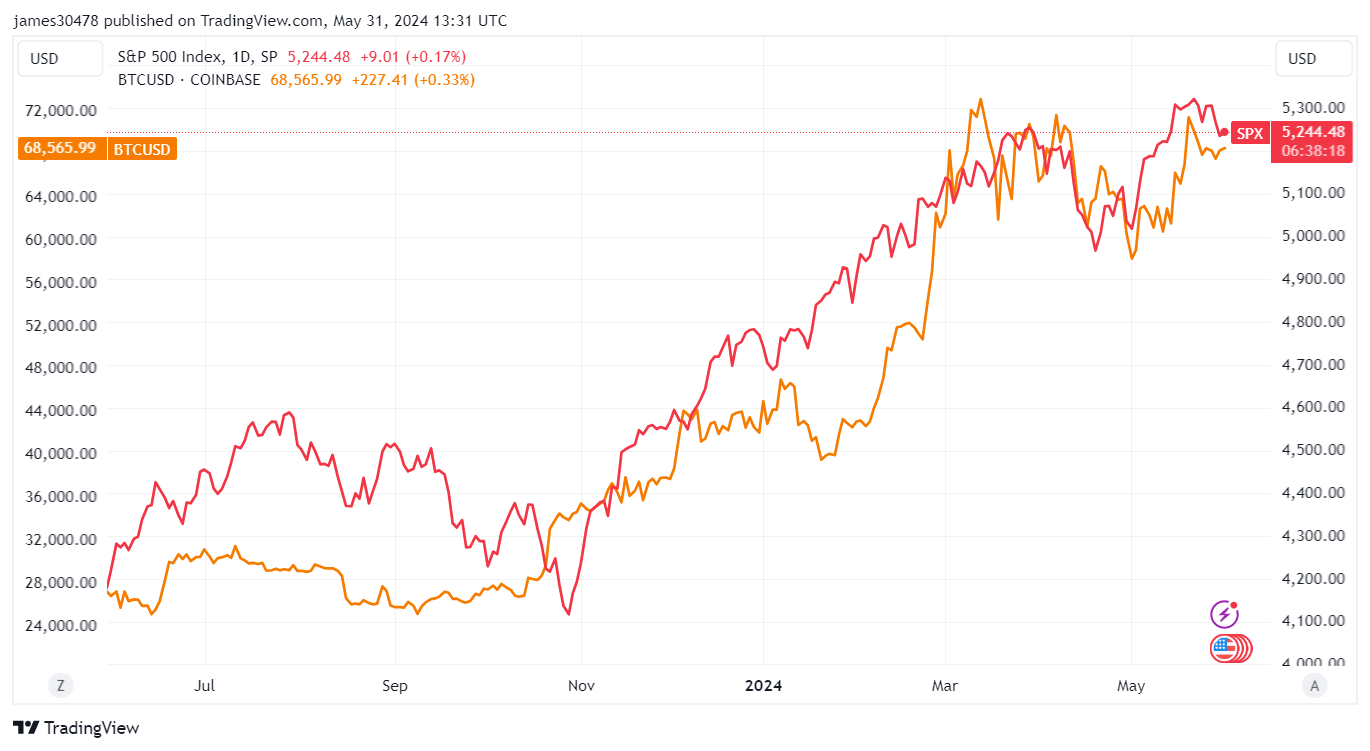
Coinciding with the increase in the M2 money supply, assets like Bitcoin and the S&P 500 (SPX) have shown significant growth since October 2023. Bitcoin has surged from $25,000 to over $70,000, and the SPX, after bottoming in October at approximately 4,100, has climbed to 5,244.


However, the growing money supply complicates efforts to curb inflation. Data from Trading Economics shows that the Personal Consumption Expenditures (PCE) Price Index year-over-year was reported at 2.7%, with the Core PCE at 2.8%, both aligning with expectations but reflecting persistent inflationary pressures. This ongoing challenge indicates that inflation remains sticky, posing difficulties for economic policy aimed at price stability.


