

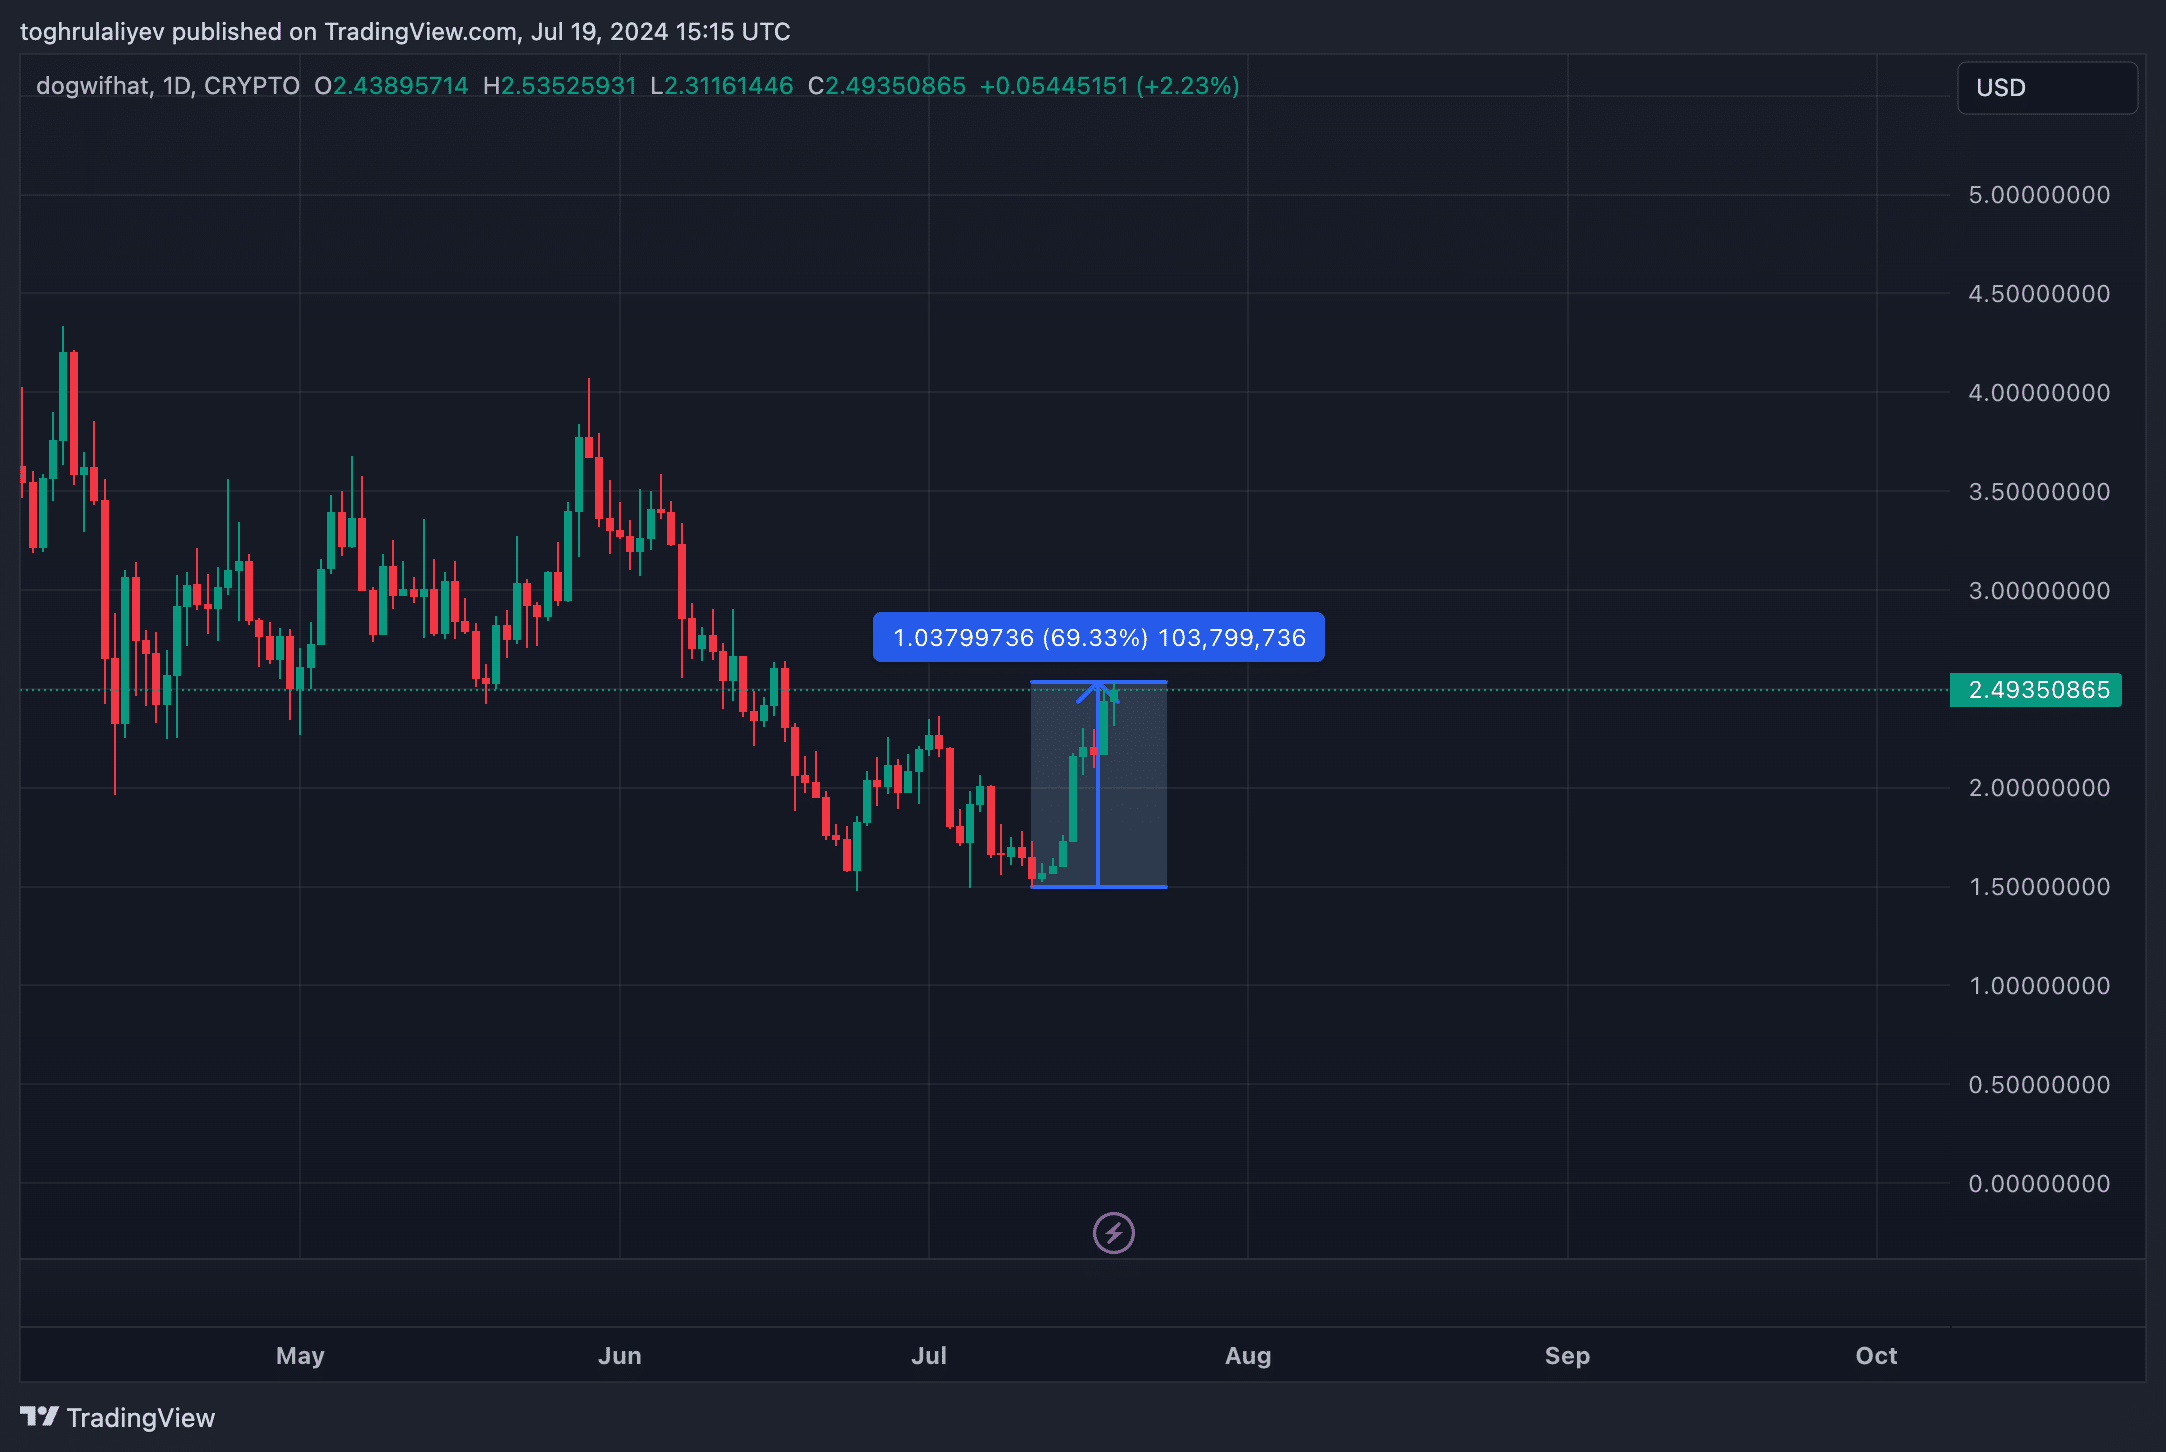
In the past seven days, dogwifhat has surged an impressive 69% (nice), outpacing many of its peers. Our analysis explores key price targets and trading strategies for the memecoin.
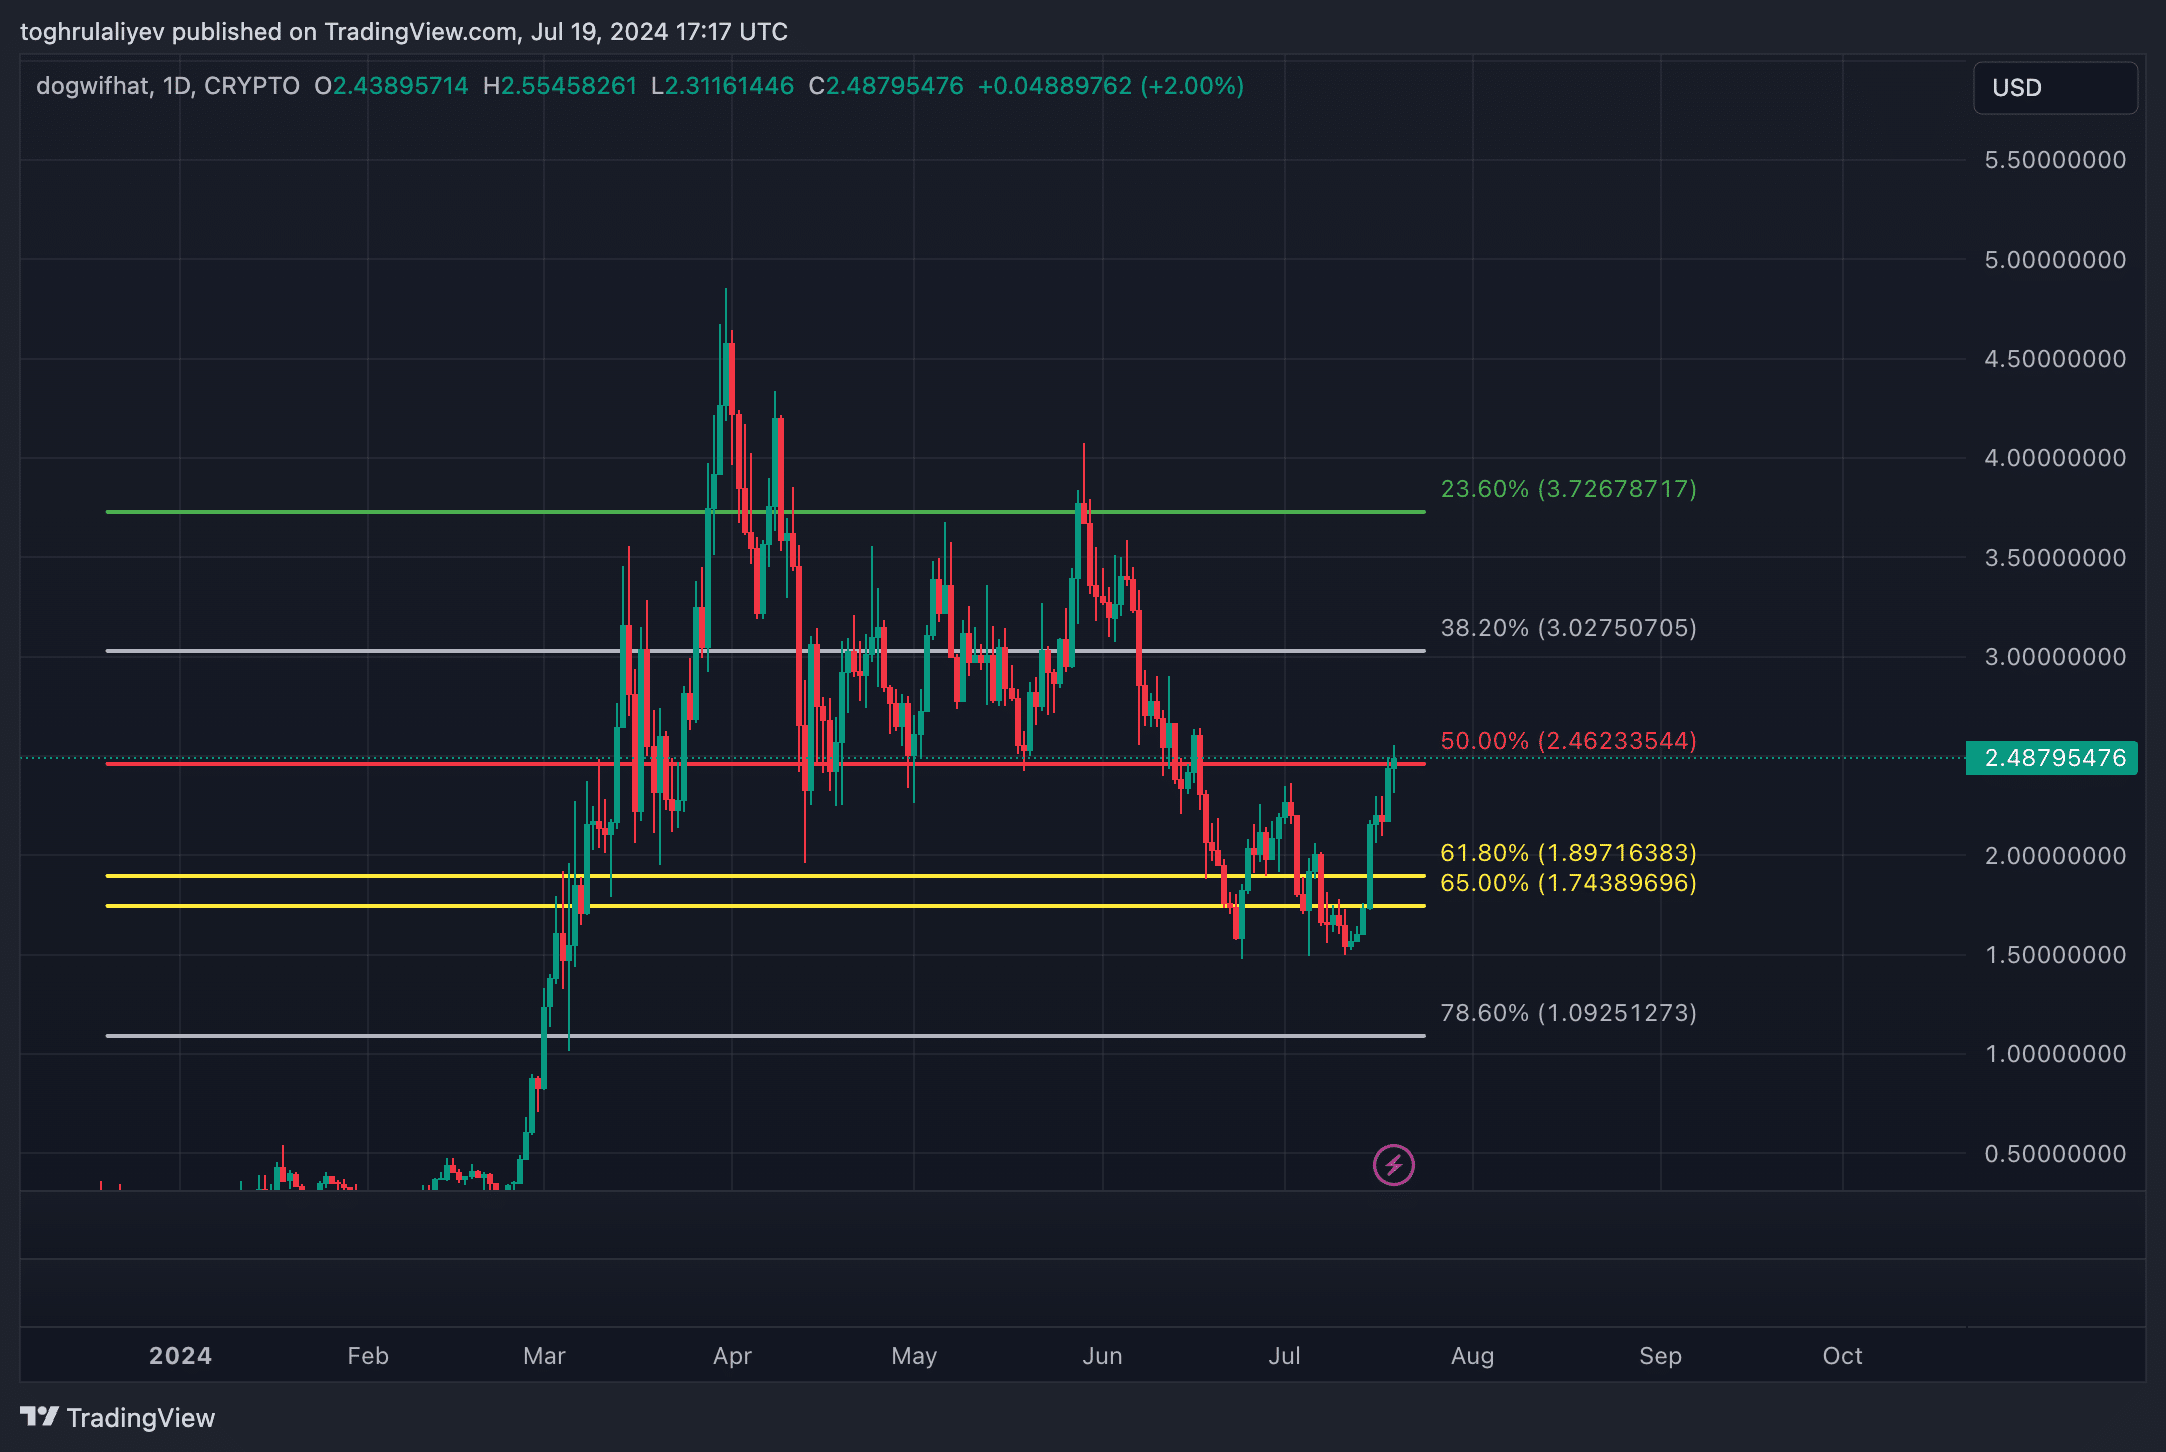
Fibonacci retracements analysis
The macro Fibonacci retracement from the January 8 low to the March 31 high reveals a golden pocket between $1.74 and $1.89. Over the past week, dogwifhat (WIF) broke through this level and consolidated above it for four consecutive days. Additionally, WIF surpassed the macro 50% retracement level at $2.46. The key question now is whether it will sustain this level. In our opinion, it will, and here’s why.
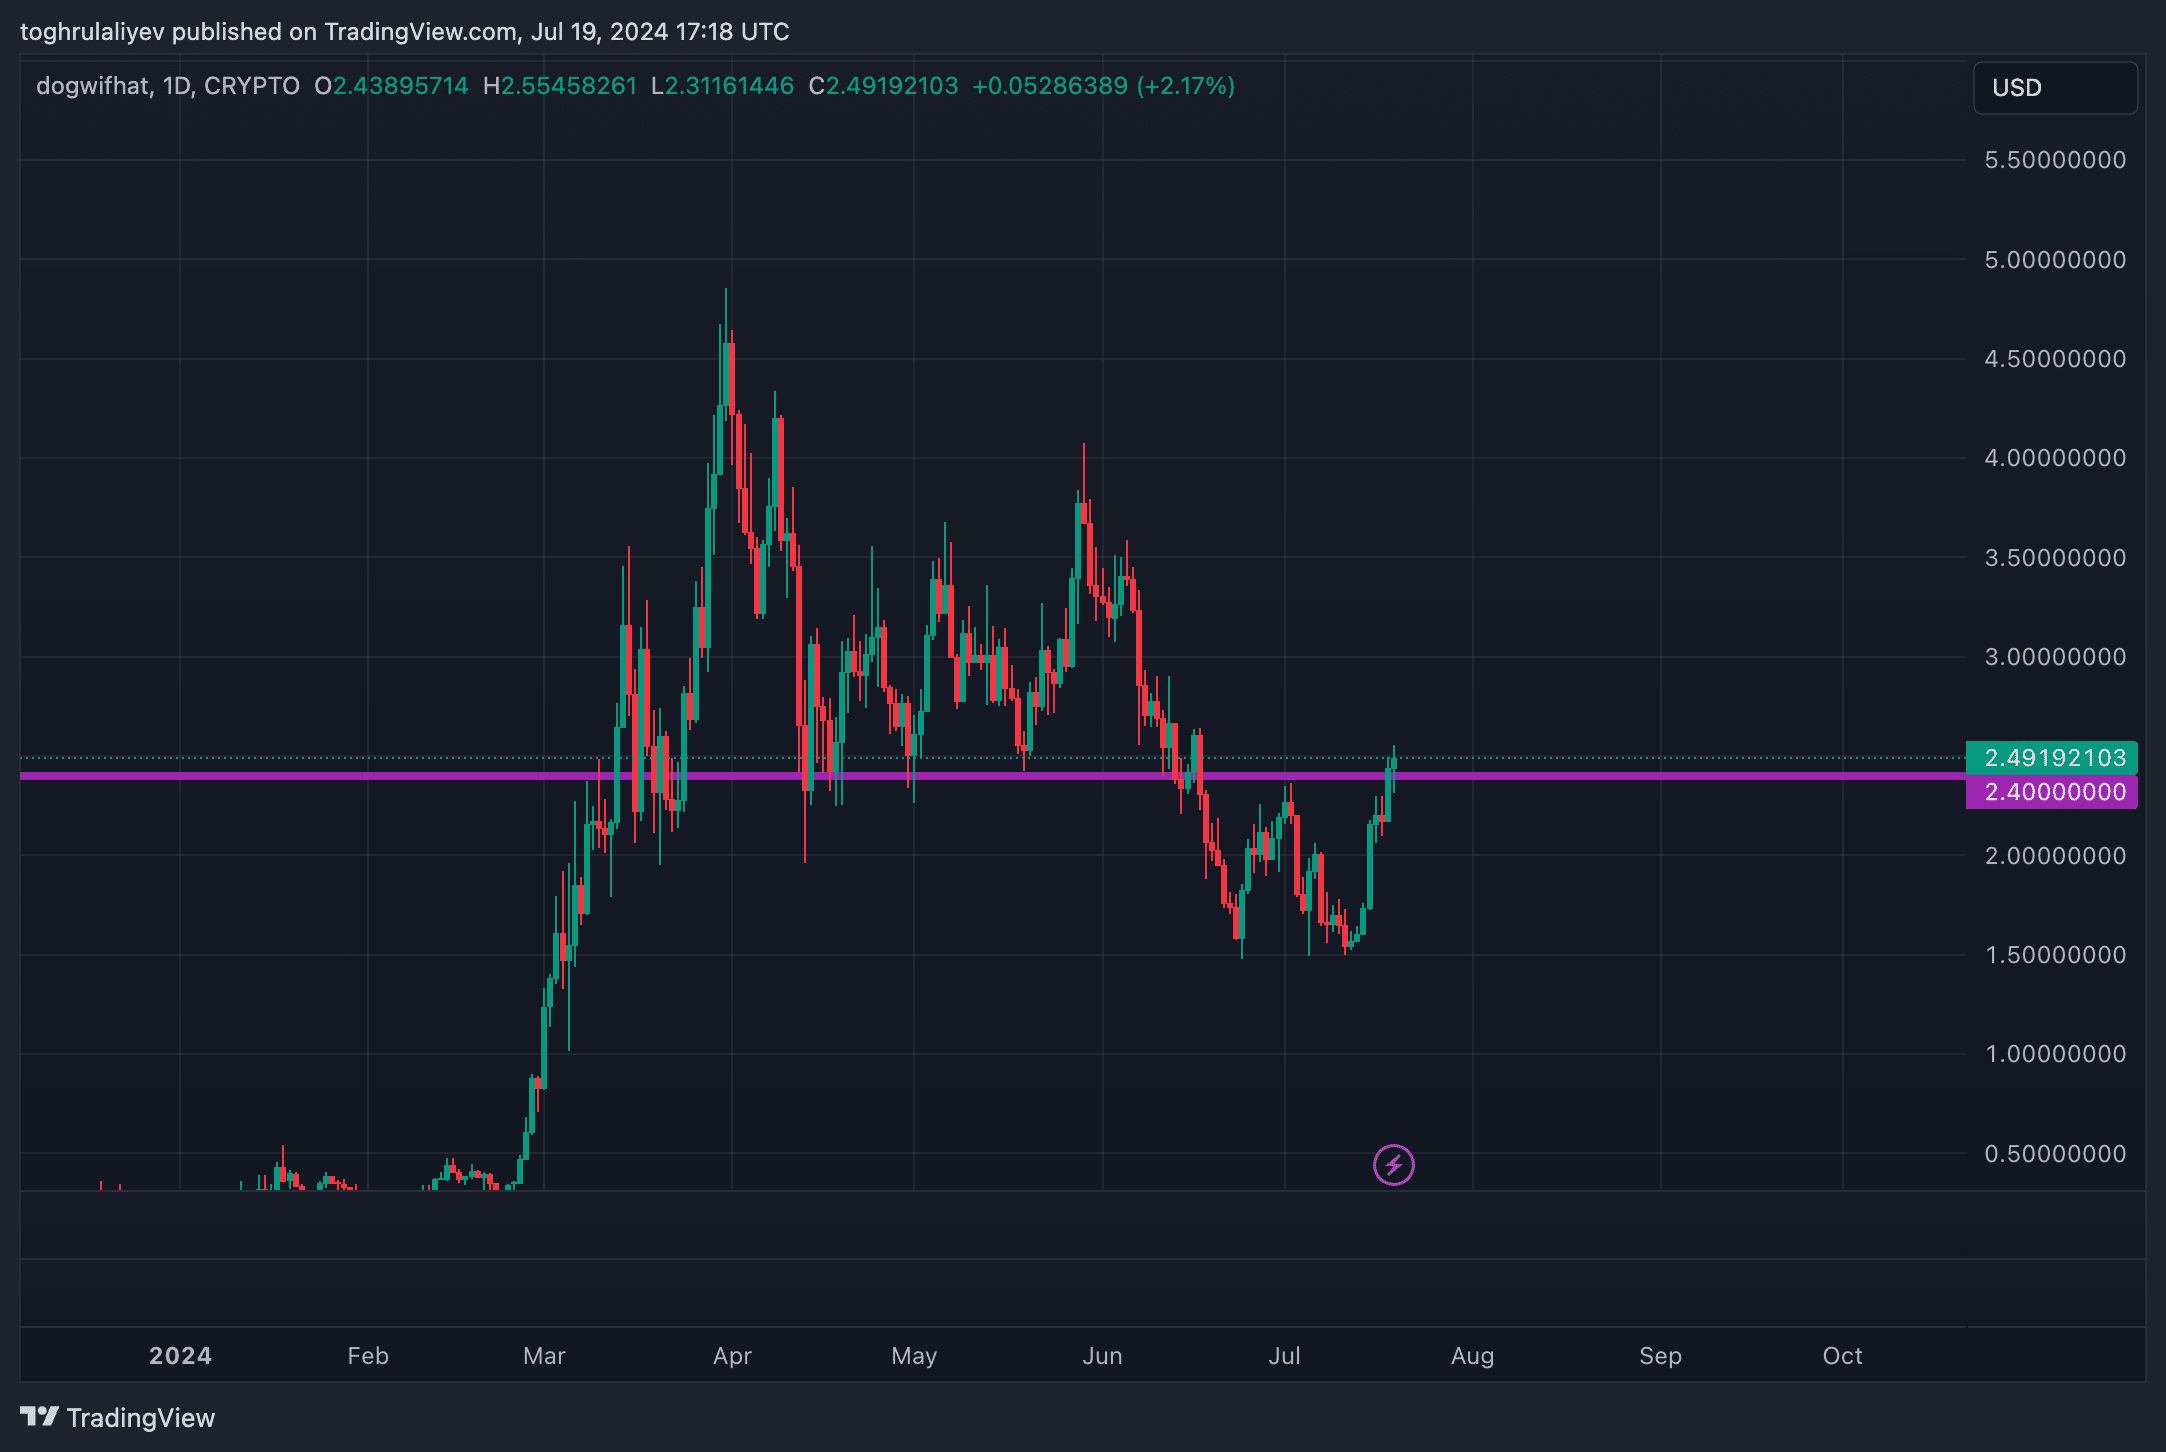
Historical resistance level
To begin with, dogwifhat breached its historical resistance at $2.4, which has served as support multiple times in the past. The breakthrough suggests the potential for further upward movement, provided the token maintains momentum above this critical level.
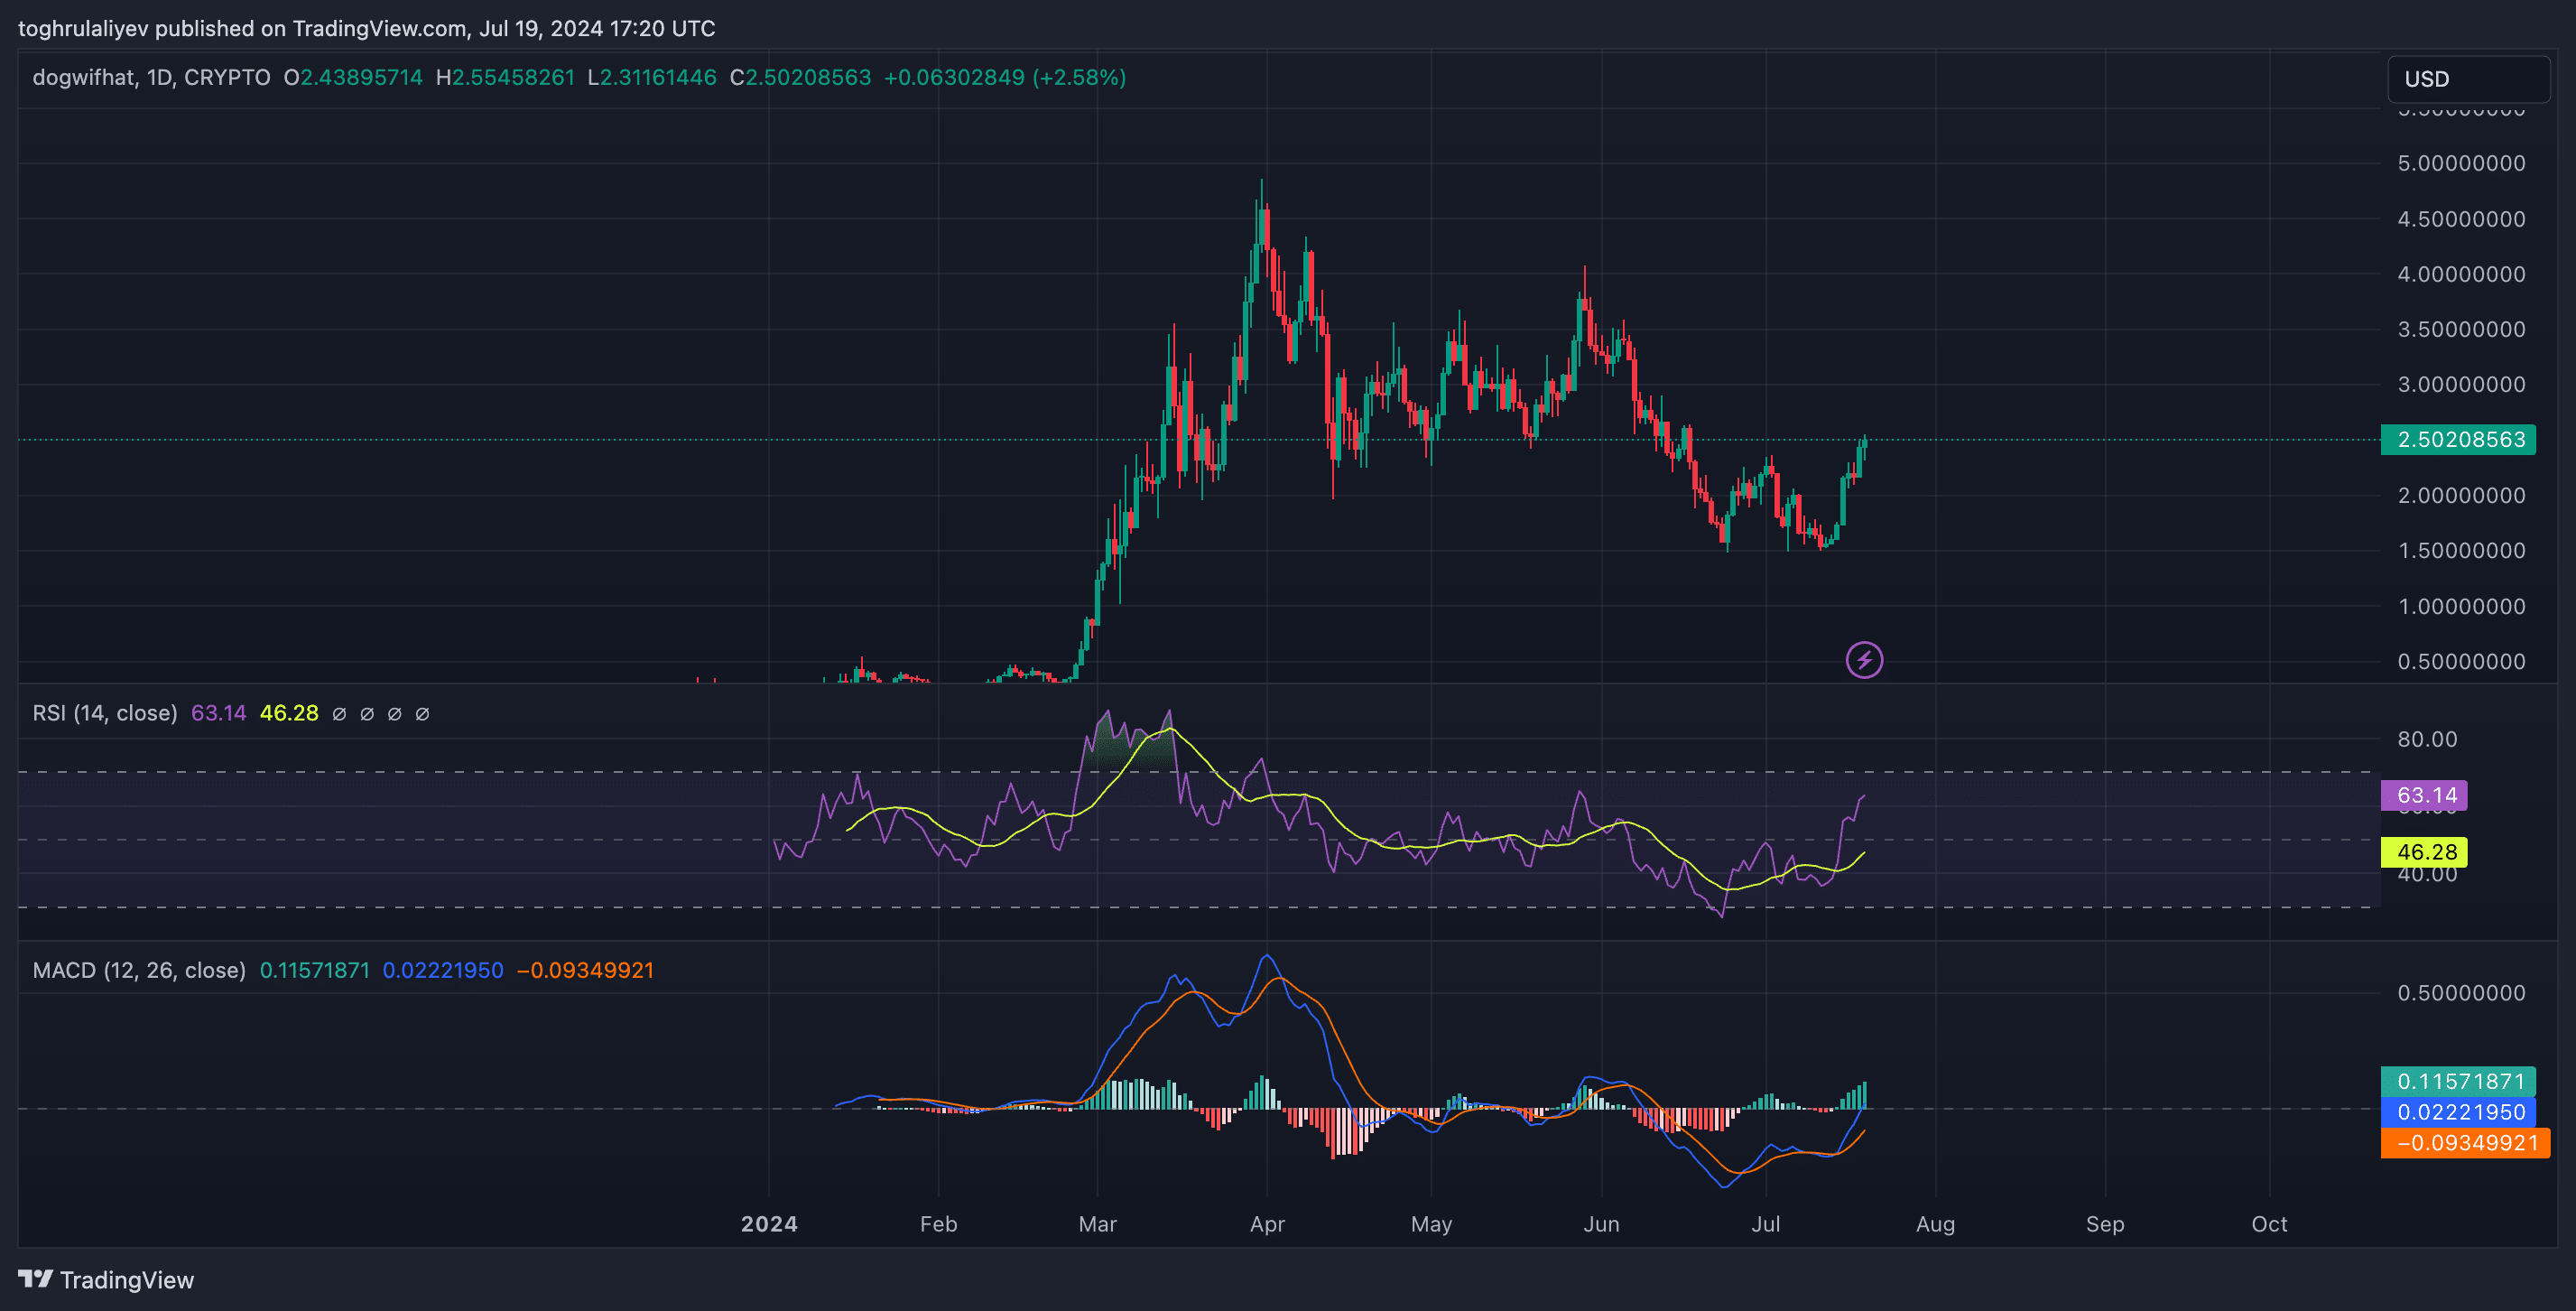
Technical indicators
Next, the Relative Strength Index (RSI) is currently in bullish territory, reading above 60. This suggests intense buying pressure and momentum in WIF’s favor. Moreover, the Moving Average Convergence Divergence (MACD) histogram is displaying increasing bullish momentum, with widening green bars. The MACD line has crossed above the signal line, which typically is also interpreted as a buy signal.
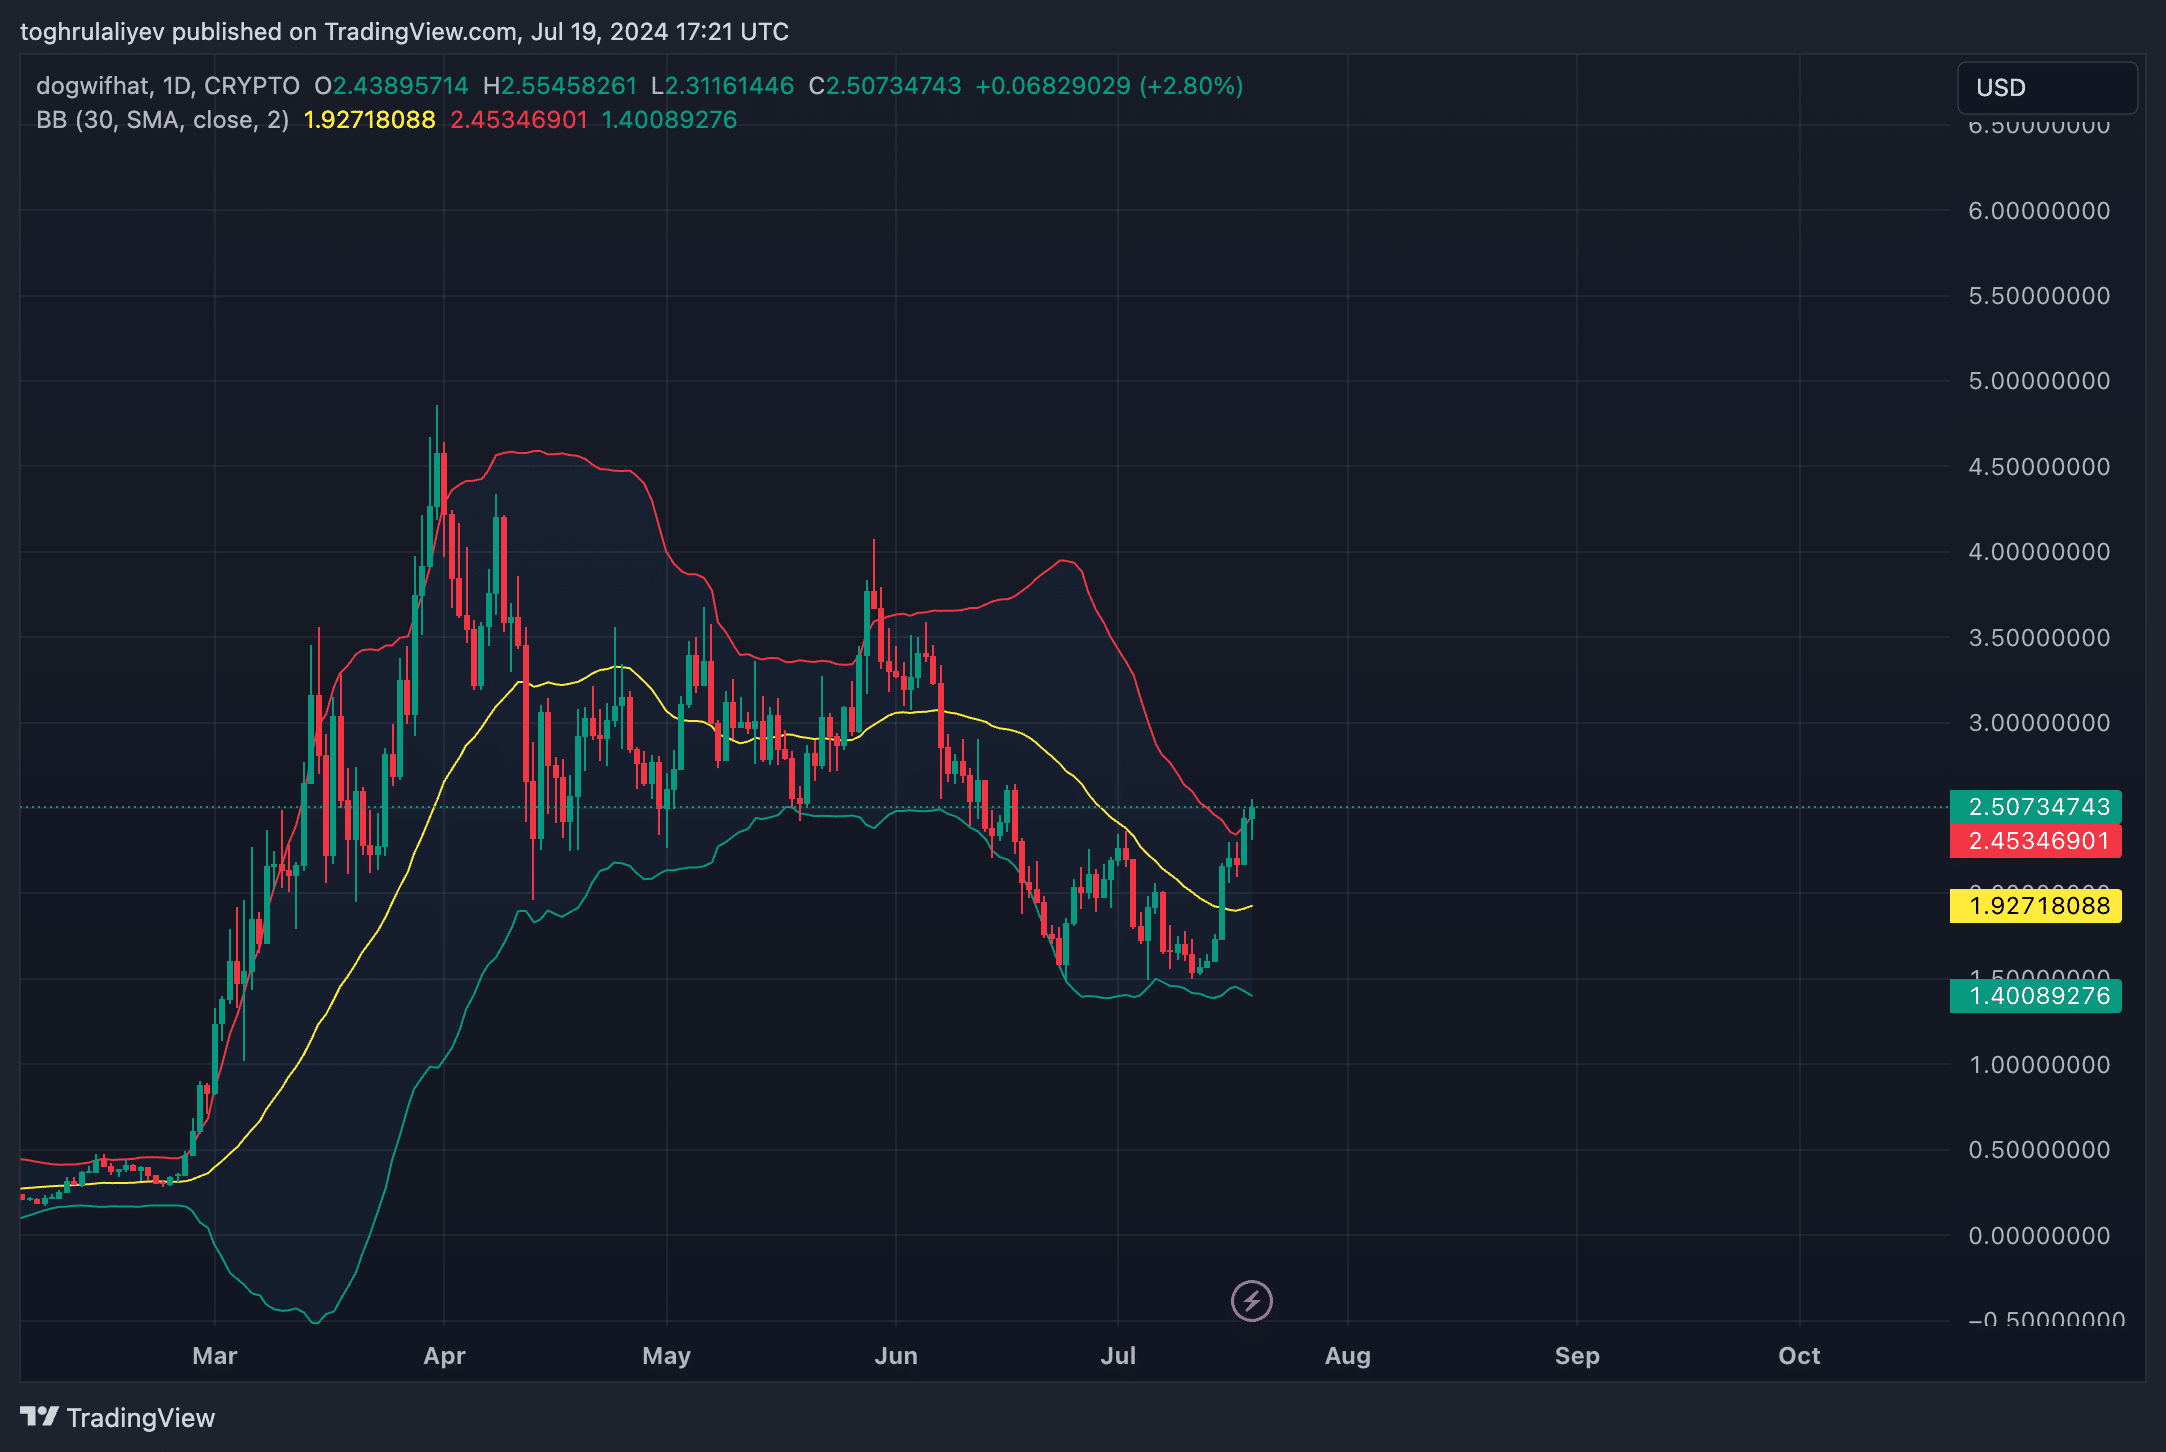
When looking at the Bollinger Bands, WIF has not only broken through the middle band (20-day moving average) but has also pierced the upper band. This also indicates upward solid momentum.
Potential golden cross
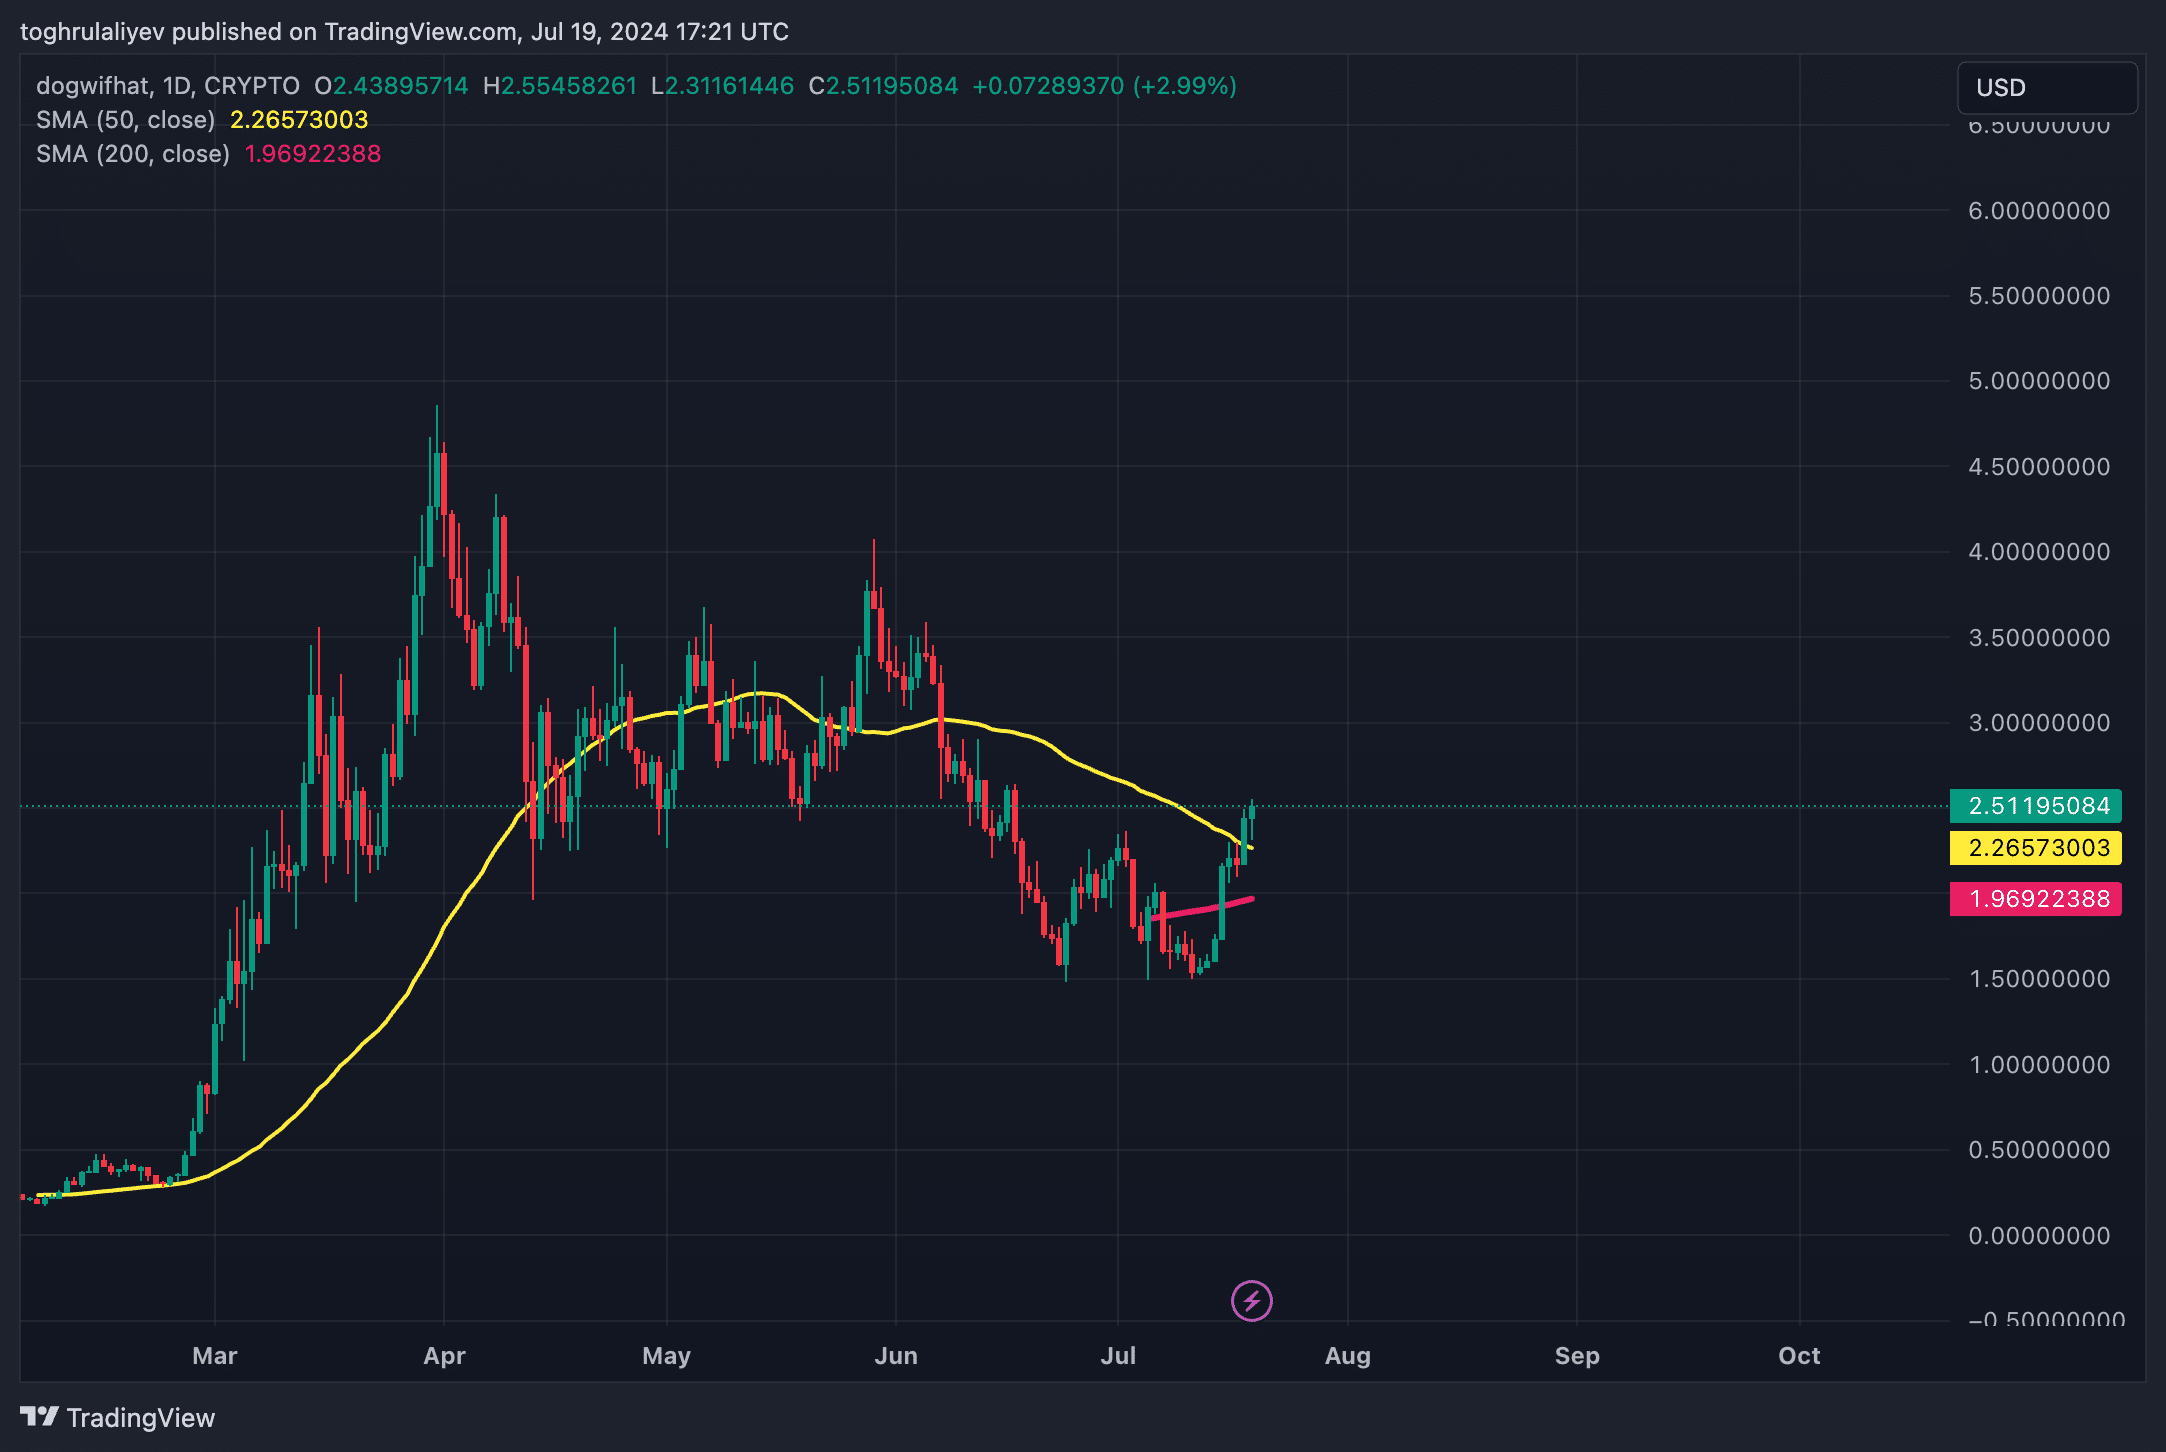
Although WIF is a relatively new coin, the newly developed 200-day moving average line provides insight into long-term trends. If the current trend persists, a golden cross (where the 50-day moving average crosses above the 200-day moving average) appears imminent in the coming weeks. This event would be the seventh bullish indicator in favor of WIF.
Strategic considerations
The key to a potential long entry lies in the daily candle close. A convincing close above the historical resistance of $2.4 could pave the way for further upside. Should this scenario unfold, several key price targets come into focus:
- Price target 1: $2.75
- Price target 2: $3.00
- Price target 3: $3.50
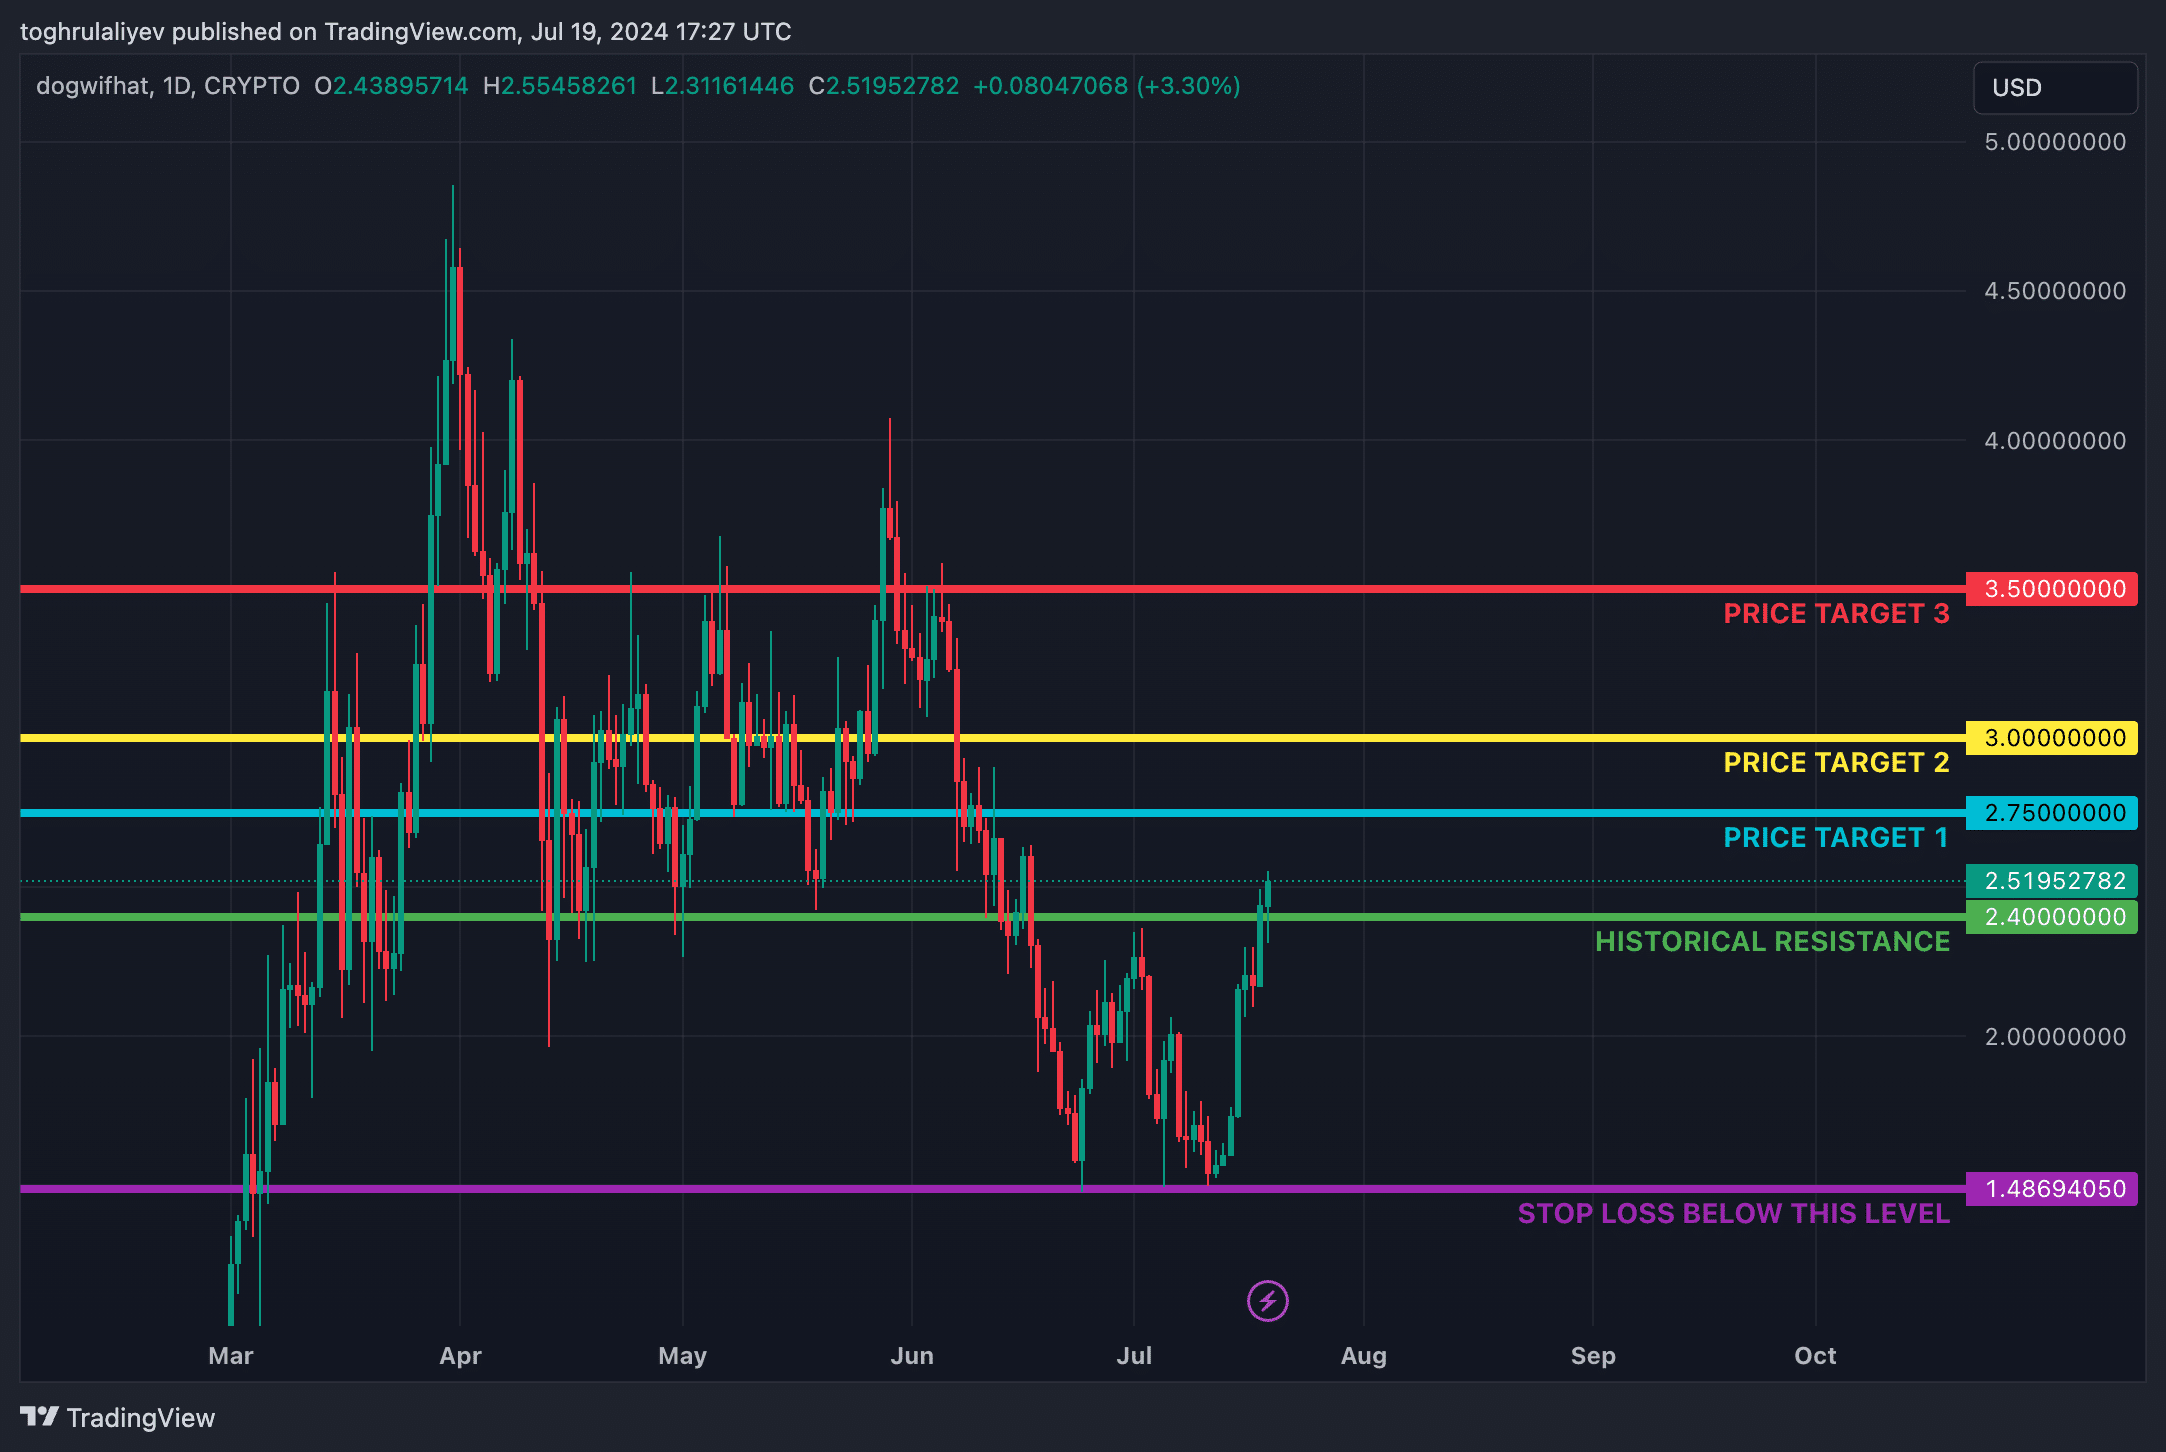
If the overall crypto market declines, a stop loss set 5-7% below the $2.40 level can manage risk. Such a strategy would limit potential losses if WIF does not sustain its current upward momentum.
