


Bitcoin Price Consolidates
Bitcoin price remained below the $68,500 resistance zone. BTC is consolidating its gains and might aim for a fresh upward move in the near term.
- Bitcoin started a consolidation phase below the $68,500 resistance zone.
- The price is trading above $66,800 and the 100 hourly Simple moving average.
- There is a key bullish trend line forming with support at $62,200 on the hourly chart of the BTC/USD pair (data feed from Kraken).
- The pair might extend gains and trade above the $68,500 resistance zone.
Bitcoin Price Holds Gains Above $67K
Bitcoin price extended its increase above the $66,500 and $67,000 resistance levels. BTC even spiked above the $68,000 level before the bears appeared. It seems like the bears are active near the $68,500 level.
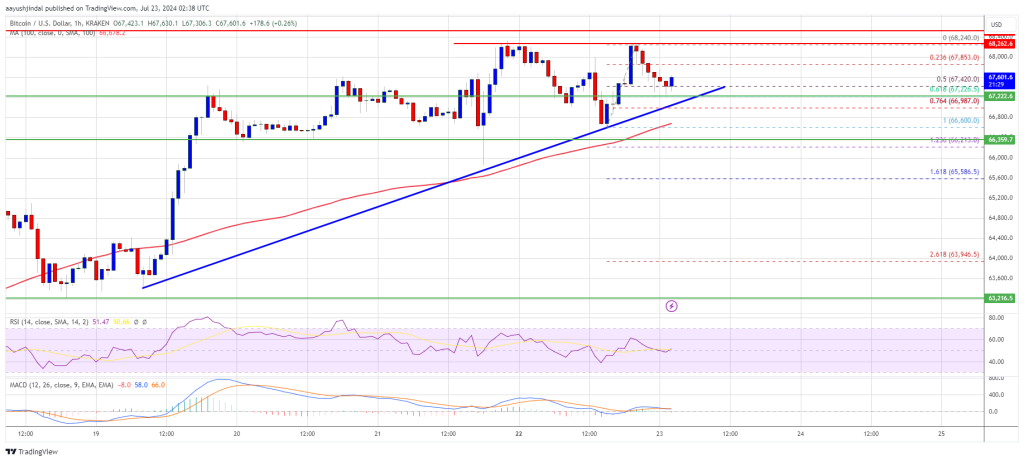
The recent high was formed near $68,240 and the price is slowly moving lower. There was a move below the $67,500 level. The price dipped below the 50% Fib retracement level of the upward move from the $66,600 swing low to the $68,240 high.
Bitcoin price is now trading above $66,800 and the 100 hourly Simple moving average. There is also a key bullish trend line forming with support at $62,200 on the hourly chart of the BTC/USD pair. The trend line is close to the 61.8% Fib retracement level of the upward move from the $66,600 swing low to the $68,240 high.
If there is a fresh increase, the price could face resistance near the $68,250 level. The first key resistance is near the $68,500 level. A clear move above the $68,500 resistance might spark another increase in the coming sessions.
The next key resistance could be $68,800. The next major hurdle sits at $69,200. A close above the $69,200 resistance might push the price further higher. In the stated case, the price could rise and test the $70,000 resistance.
Are Dips Supported In BTC?
If Bitcoin fails to climb above the $68,250 resistance zone, it could start a downside correction. Immediate support on the downside is near the $67,200 level.
The first major support is $66,600. The next support is now near $66,000. Any more losses might send the price toward the $65,500 support zone in the near term.
Technical indicators:
Hourly MACD – The MACD is now losing pace in the bullish zone.
Hourly RSI (Relative Strength Index) – The RSI for BTC/USD is now above the 50 level.
Major Support Levels – $67,200, followed by $66,600.
Major Resistance Levels – $68,200, and $68,500.


