

Hedera Hashgraph has experienced a significant downturn over the past five days, reaching a crucial support level amid ecosystem challenges.
The price of Hedera Hashgraph (HBAR) has been in a steep sell-off after soaring to $0.1825 in April. It has sunk by 65% and is hovering at its lowest level this year.
Hedera’s ecosystem challenges
Hedera’s recent struggles stem from challenges within its ecosystem, particularly in key areas like gaming and decentralized finance.
While Hedera is one of the largest cryptocurrencies, it has a modestly small ecosystem compared to its bigger peers like Solana (SOL) and Arbitrum (ARB). In the DeFi space, Hedera has a total value locked of just $58 million and 6 dApps.
SaucerSwap, its largest decentralized exchange, holds less than $60 million in assets, while Stader has $29 million in staked assets and a $10 million stablecoin market cap.
In contrast, Tron (TRX) has $8.13 billion in assets, $58 billion in stablecoins, and 2.2 million active addresses. Solana, another significant chain, has 1.23 million addresses and $3.4 billion in assets.
Hedera Hashgraph has succeeded in securing many high-profile companies to its governance council. Some of the most notable members are IBM, Nomura, Deutsche Telekom, Mondelez, and ServiceNow.
Some of these companies are developing enterprise solutions using Hedera’s technology. For instance, Arbrdn, a financial company with over £496 billion in assets, is working on a tokenized asset similar to BUIDL or Franklin Templeton’s FOBXX.
Australian Payments Plus is also working on solutions to ease money transfer using Hedera’s technology. However, most council members have not announced some of their Hedera projects.
Hedera Hashgraph price nears a make-or-break level
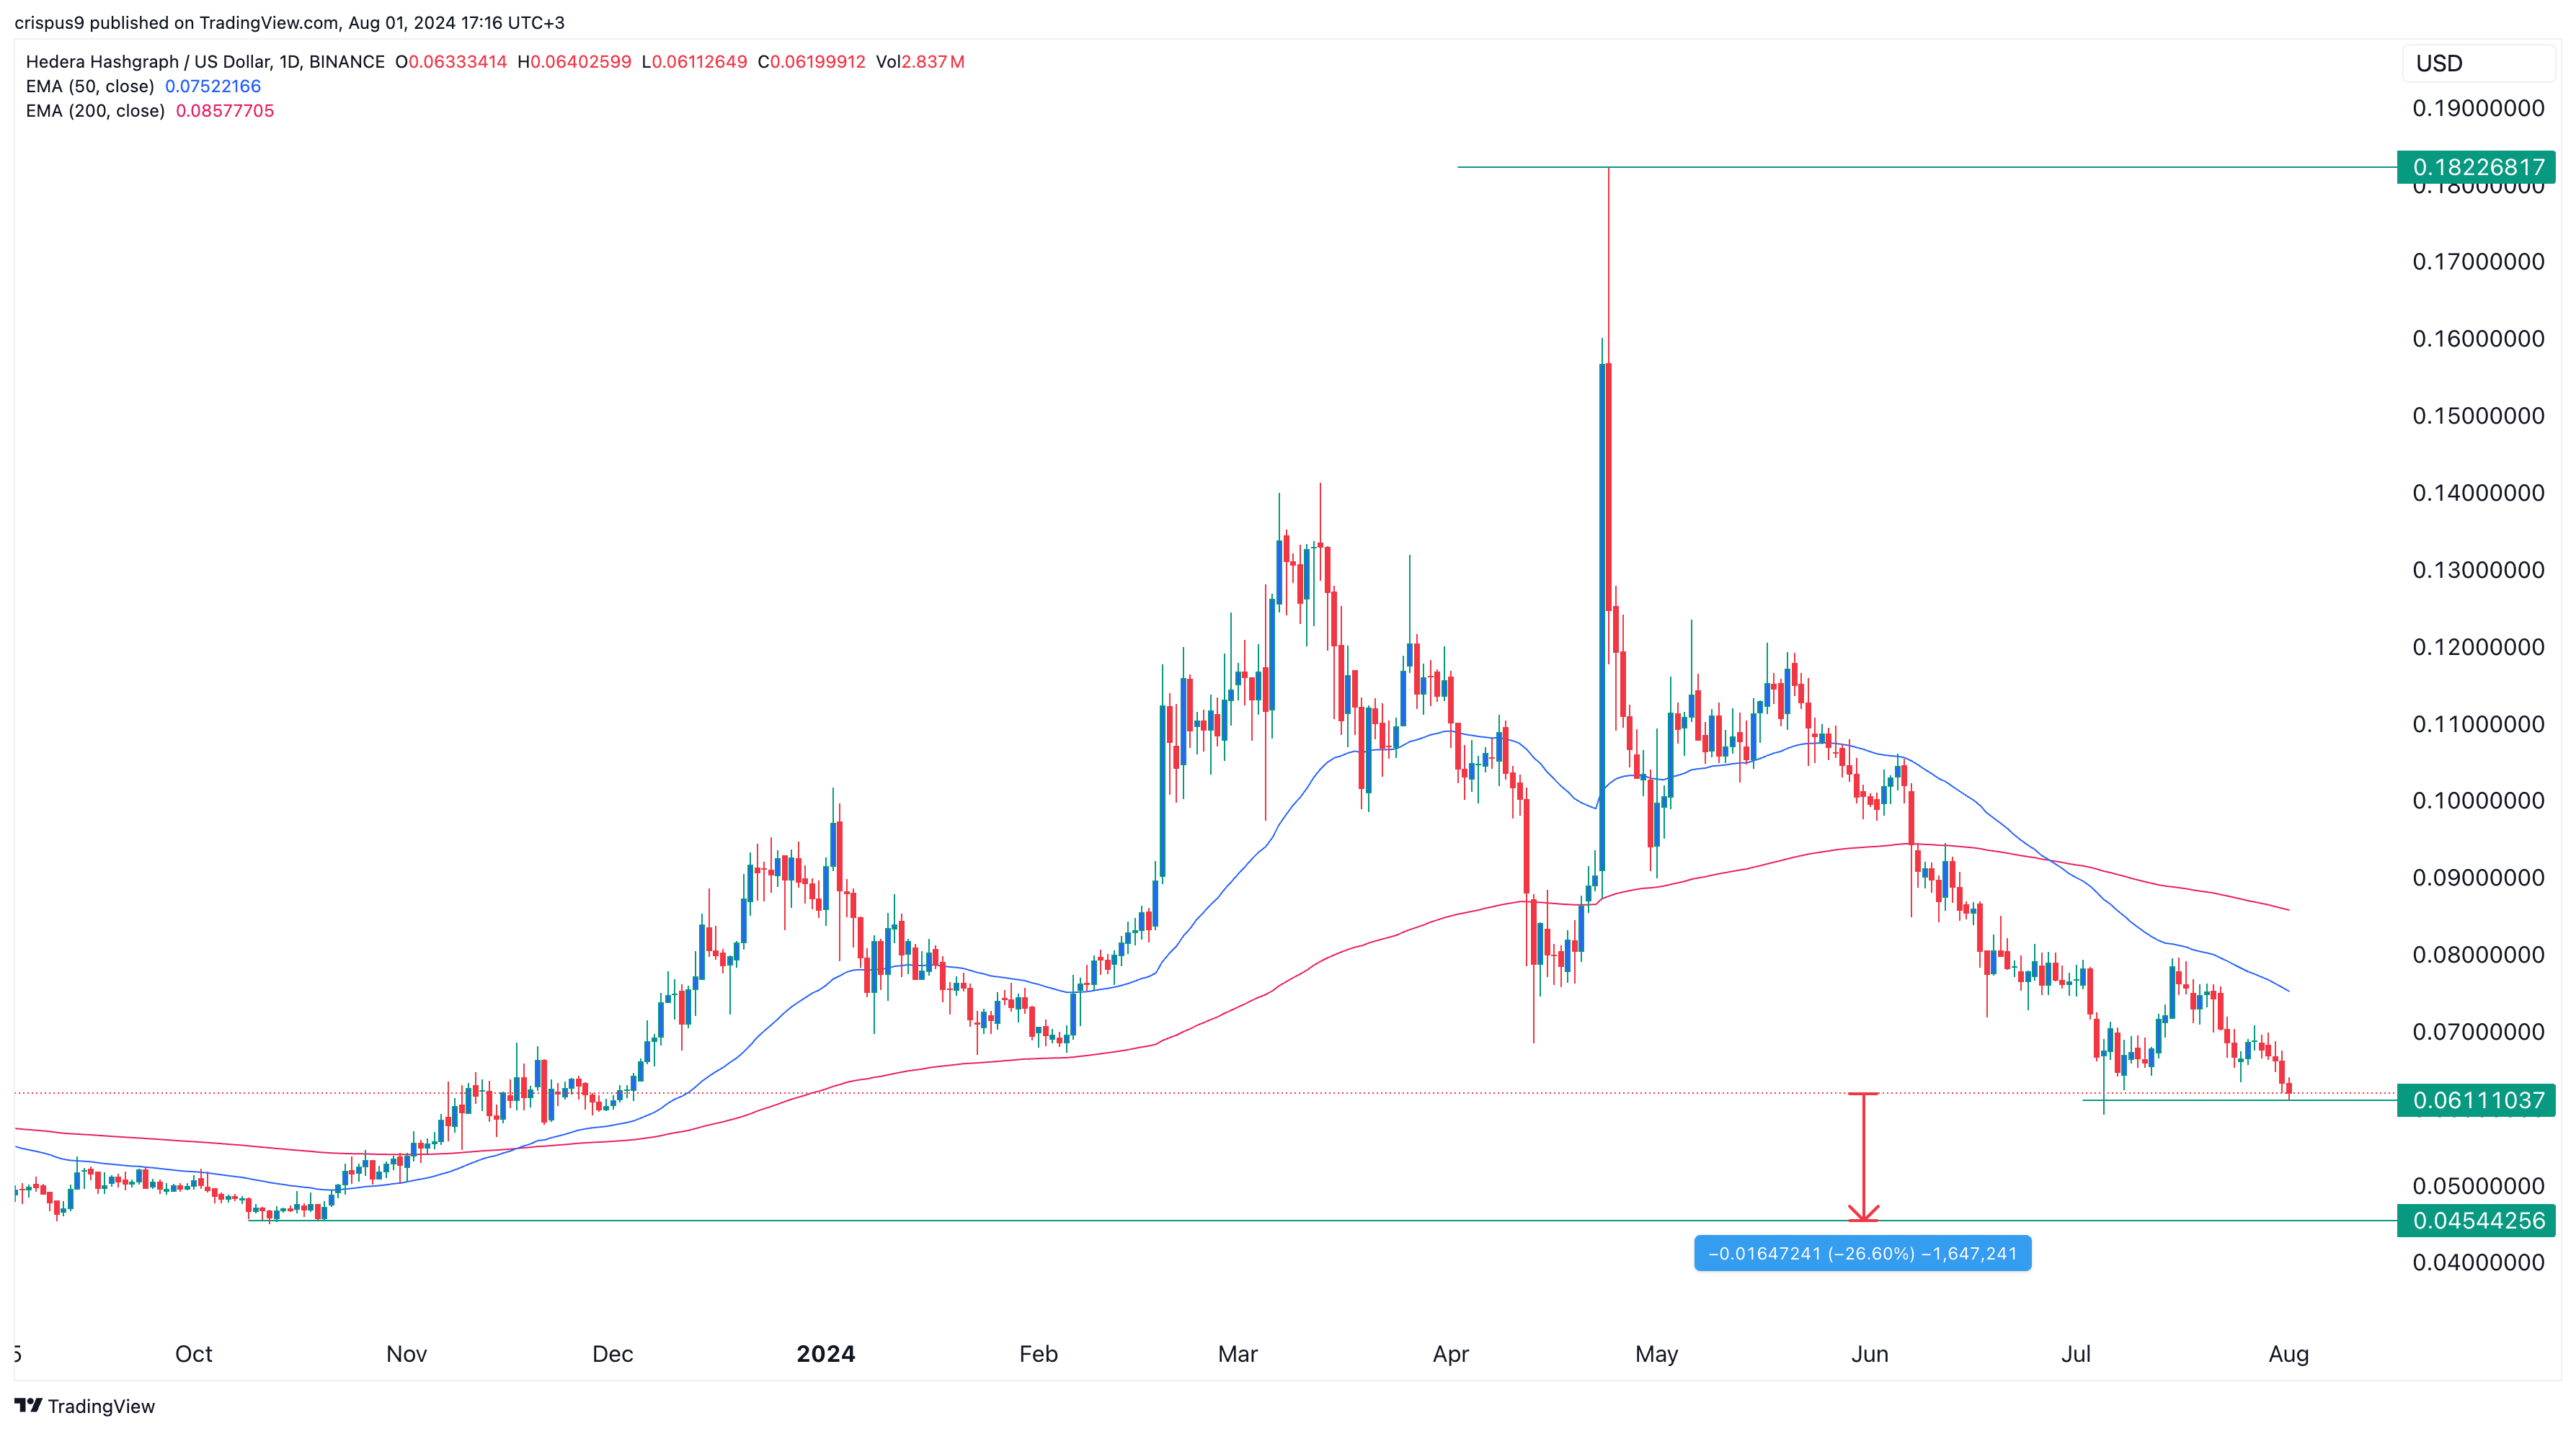
Hedera’s HBAR token formed a death cross pattern in June when the 50-day and 200-day Exponential Moving Averages made a bearish crossover. This pattern often hints at further declines, explaining why HBAR has dropped by 25% since then.
HBAR is trading near the critical support level at $0.061, representing the lowest point it traded at in July. A break below this level could signal further downside, potentially invalidating the bullish double-bottom chart pattern. The next key level to watch would be $0.045, its lowest point in October last year, representing a 27% decline from Thursday’s level.


