

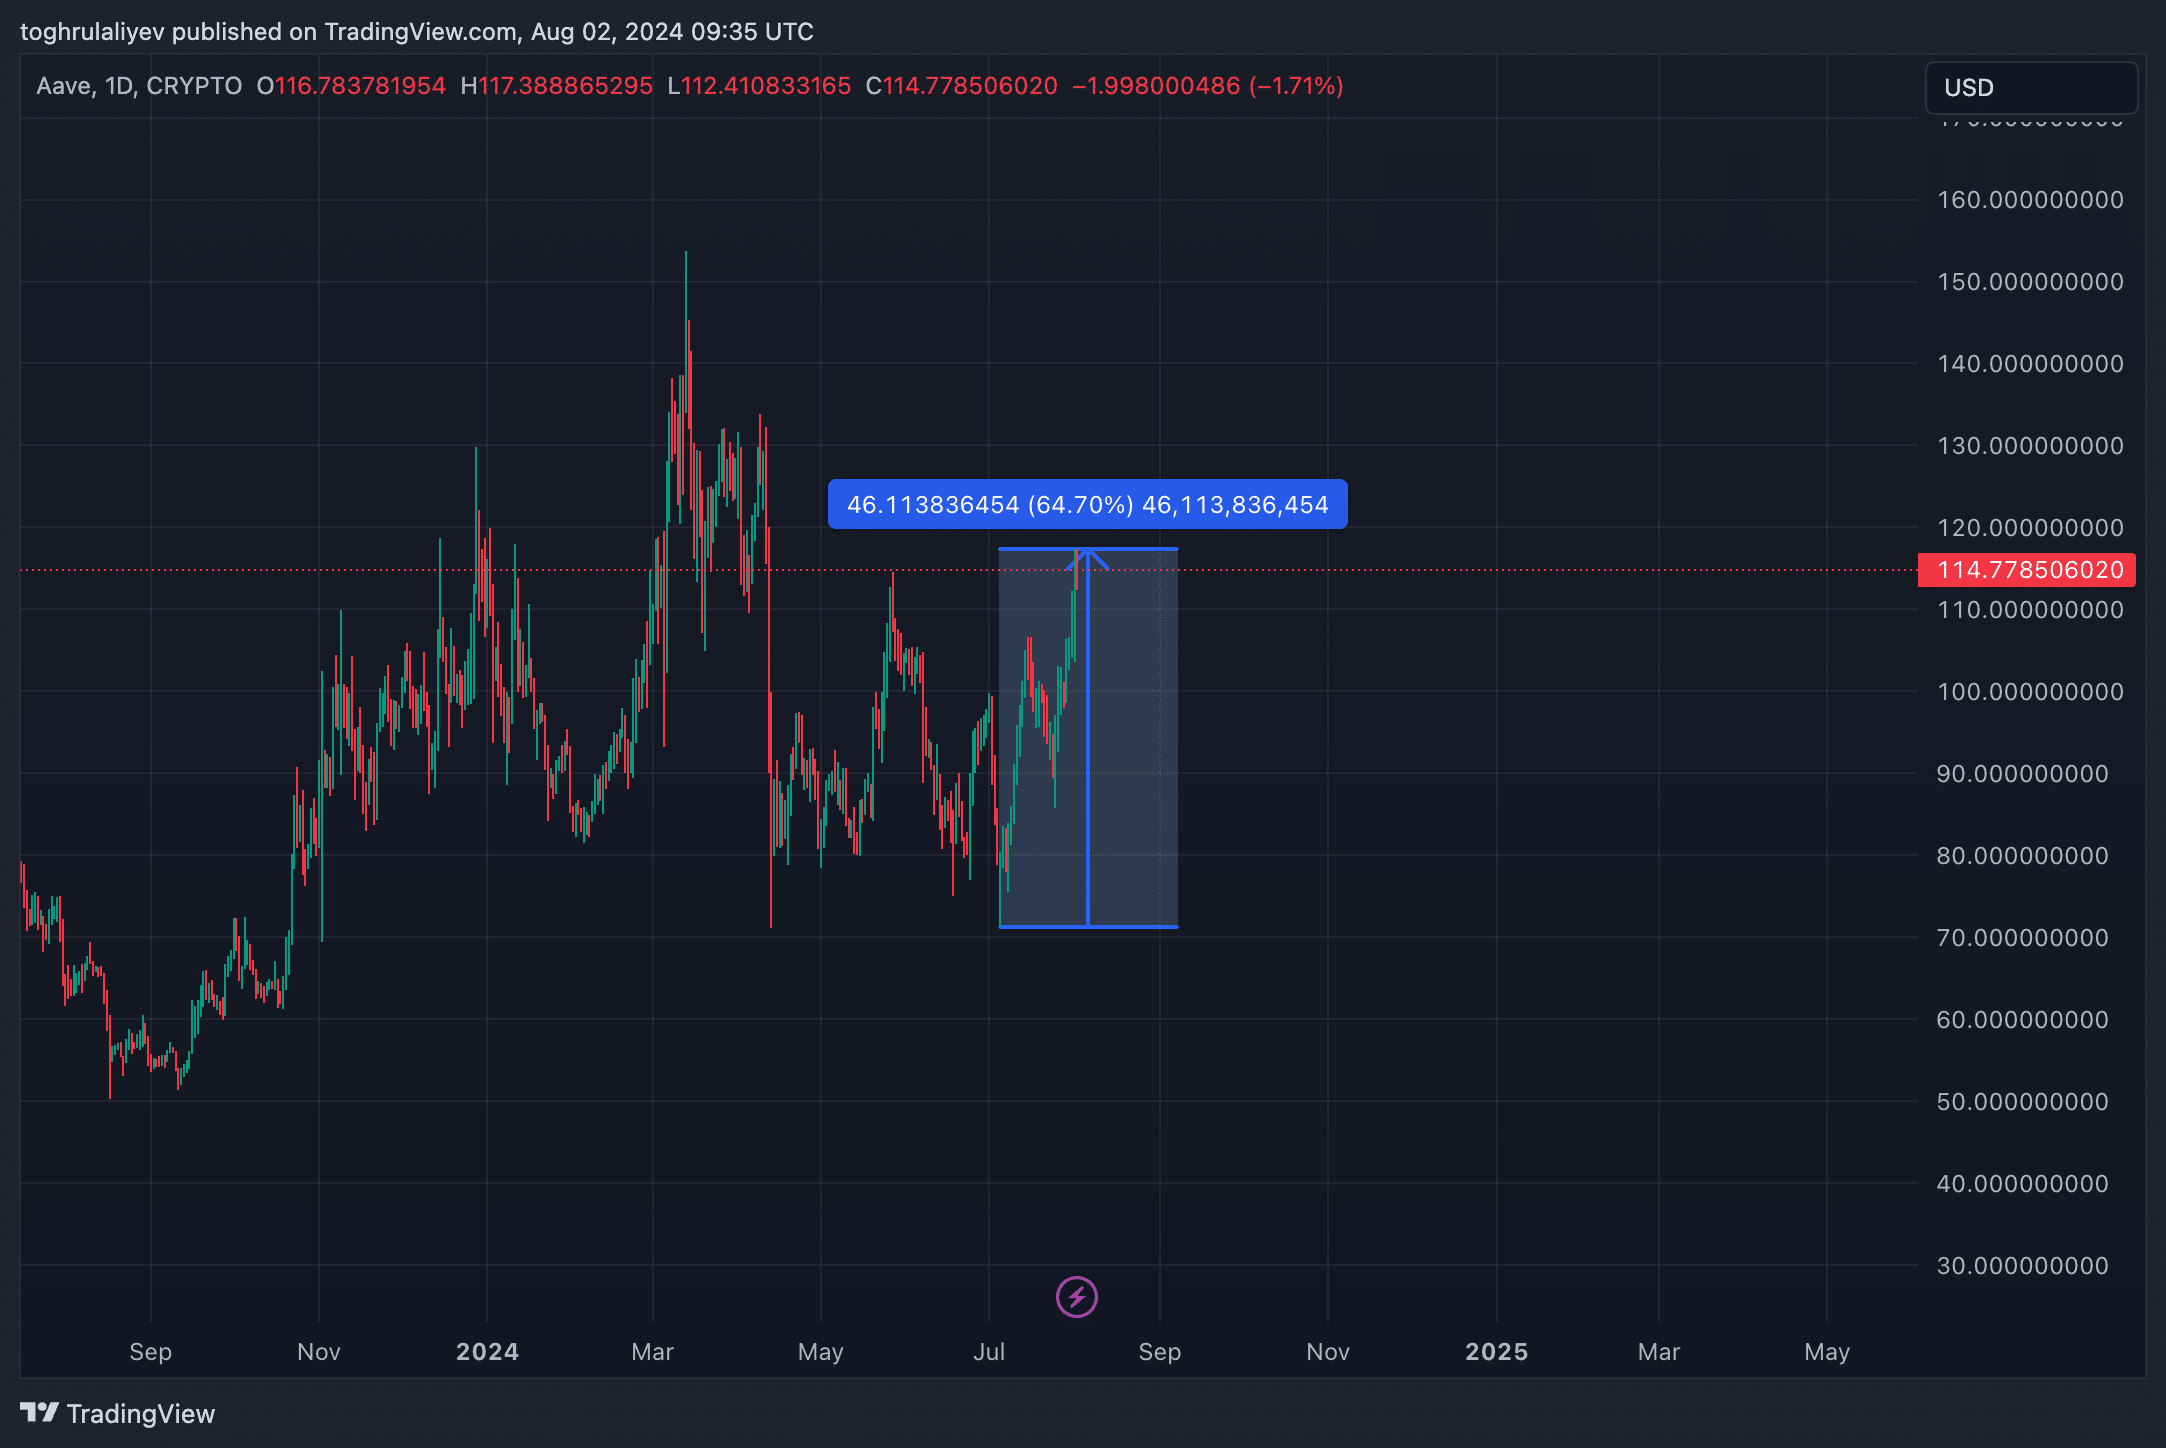
Aave (AAVE) has surged by 64.7% in less than a month. With such a strong rally, the question now is whether AAVE can continue its upward momentum or if it faces a potential pullback. In this week’s analysis, we examine the key technical indicators, resistance levels, and strategic considerations to determine the most likely direction for AAVE in the coming days.
Resistance and support analysis
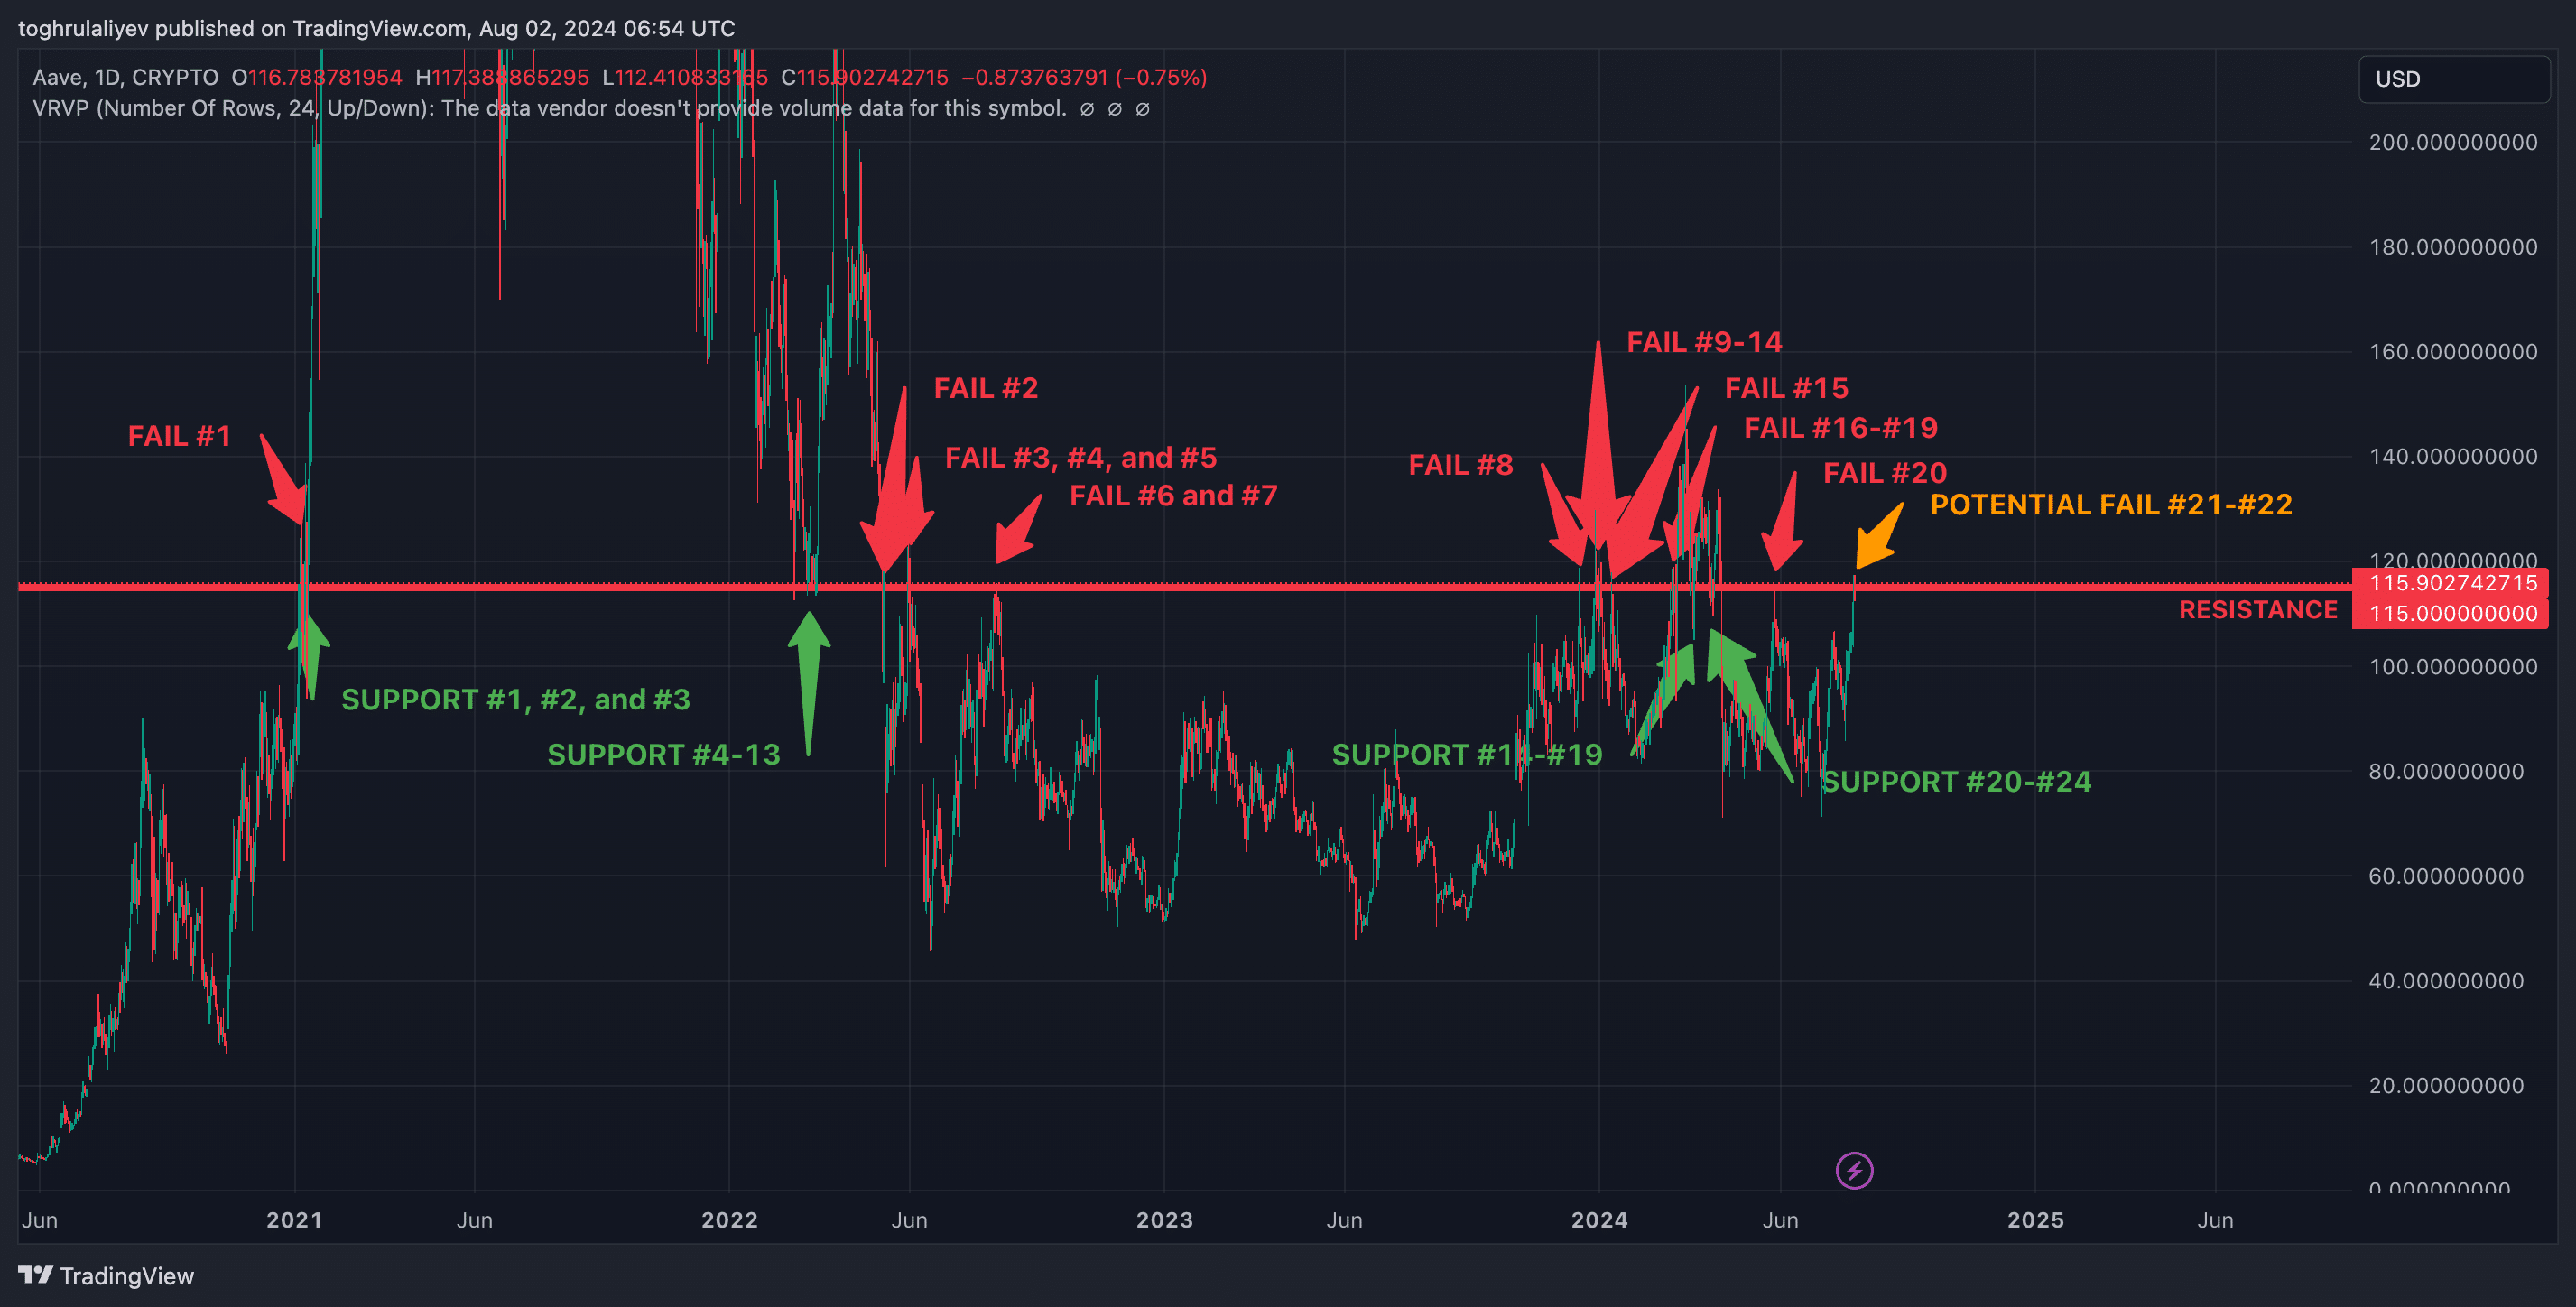
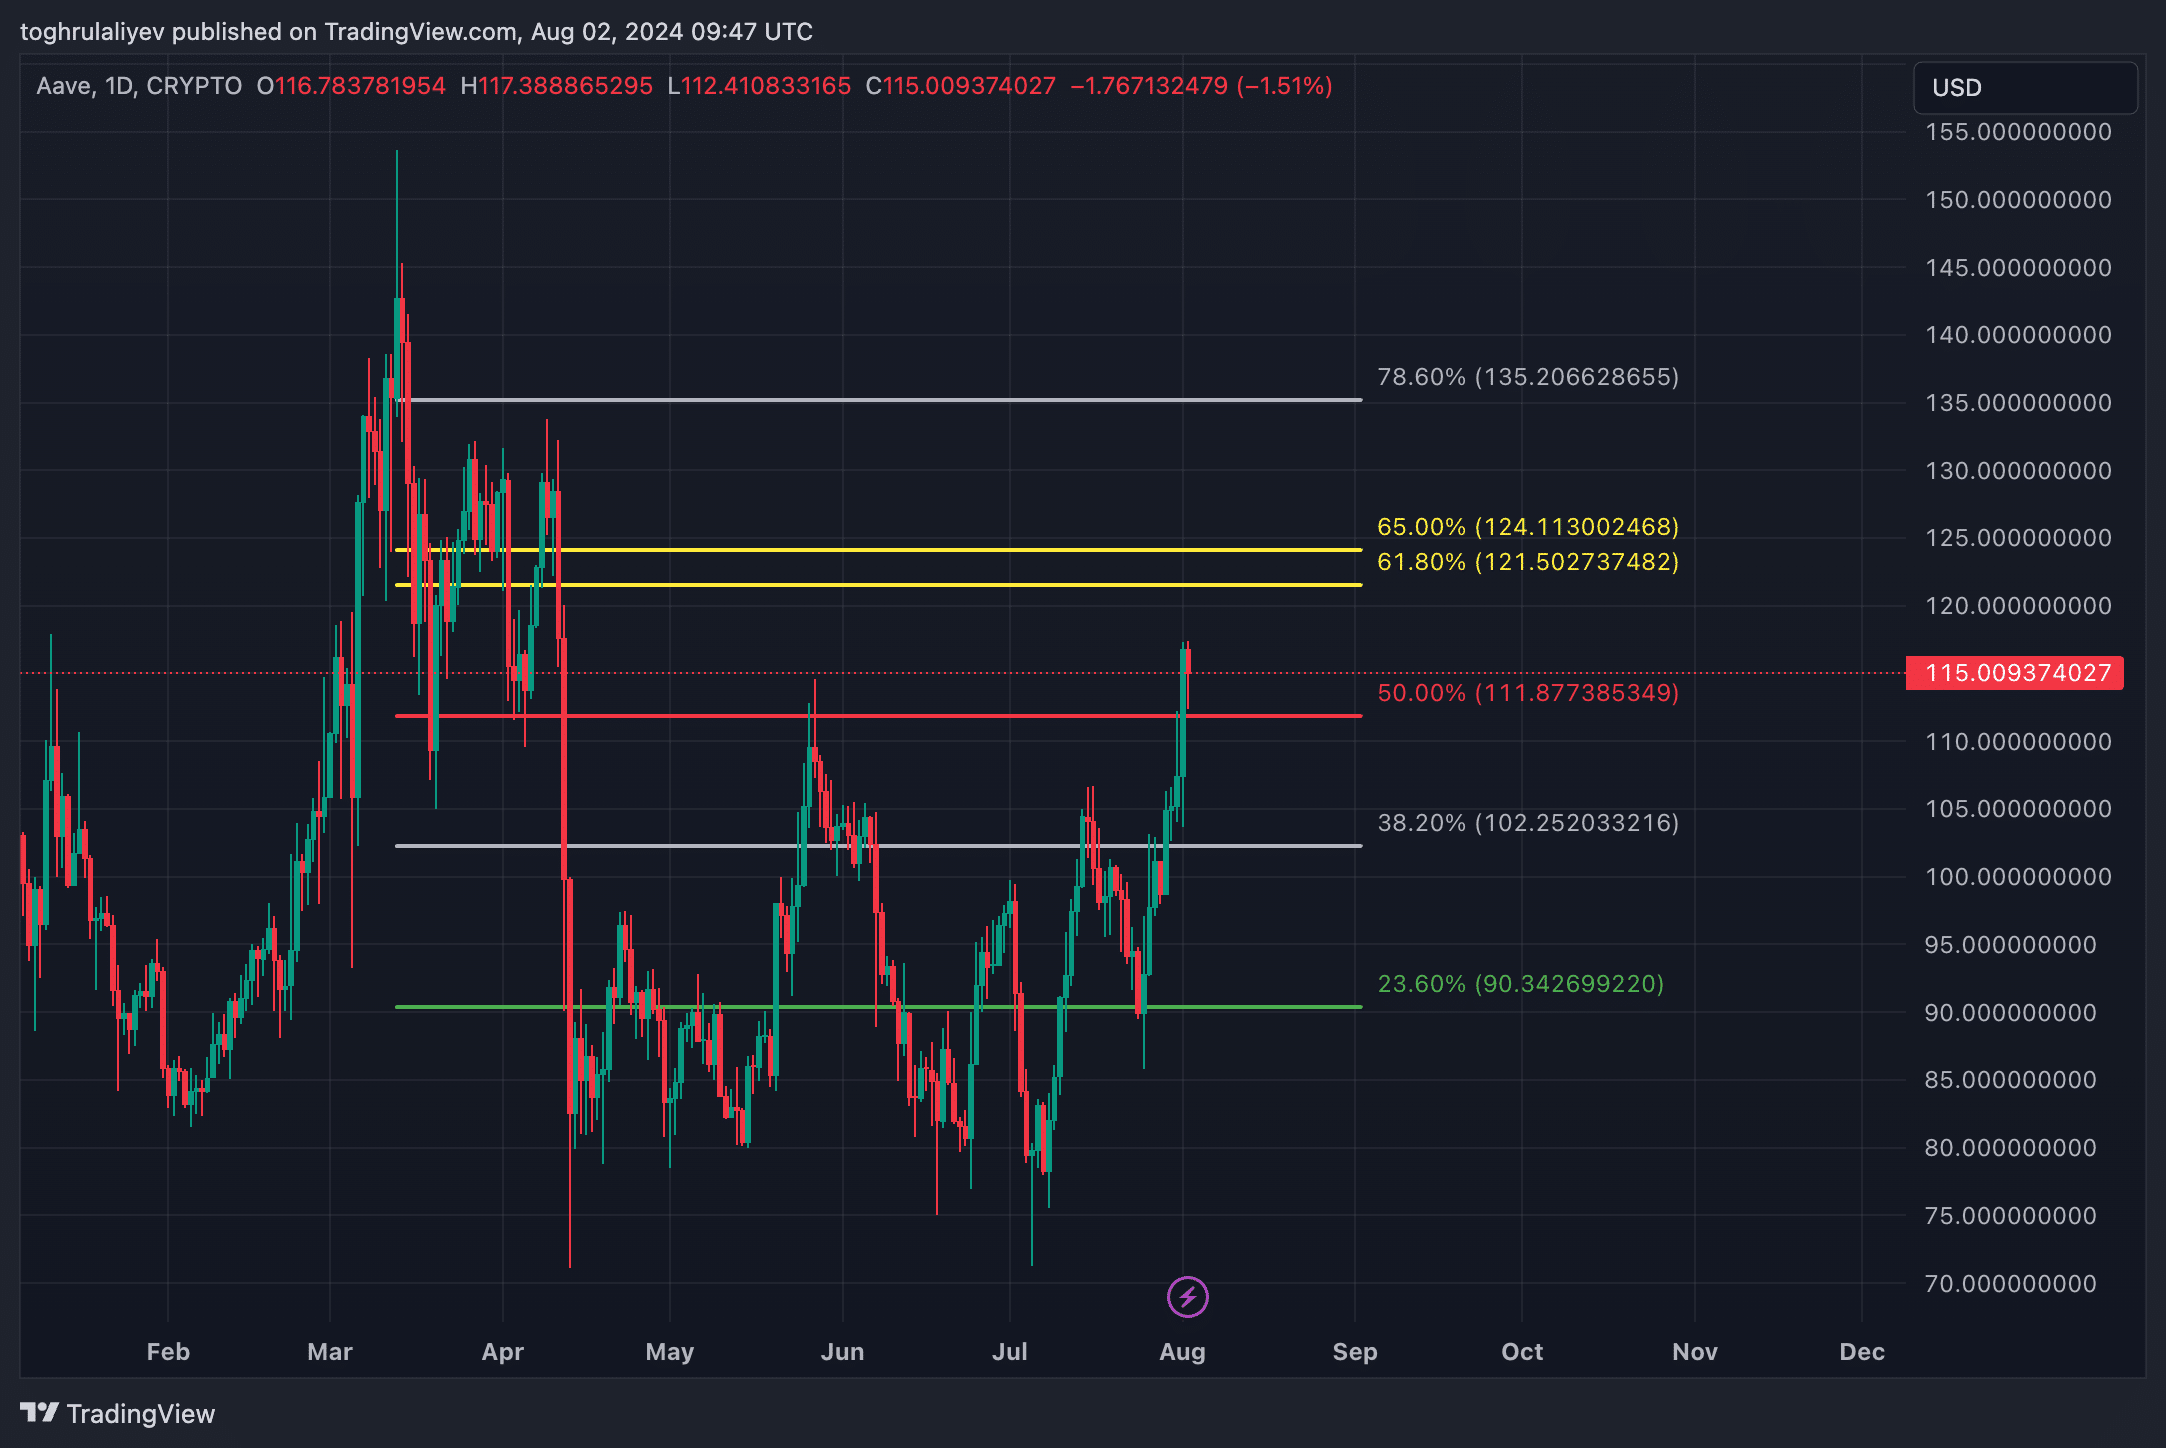
Aave (AAVE) faces a critical juncture as it approaches a very strong resistance level at $115. This level has a significant history, having acted as resistance 20 times and support 24 times in the past. The price currently hovers around this key level, and the market is closely watching to see if Aave (AAVE) will once again encounter resistance for the 21st and 22nd times or finally break through. However, signs suggest that it may be difficult to overcome this barrier.
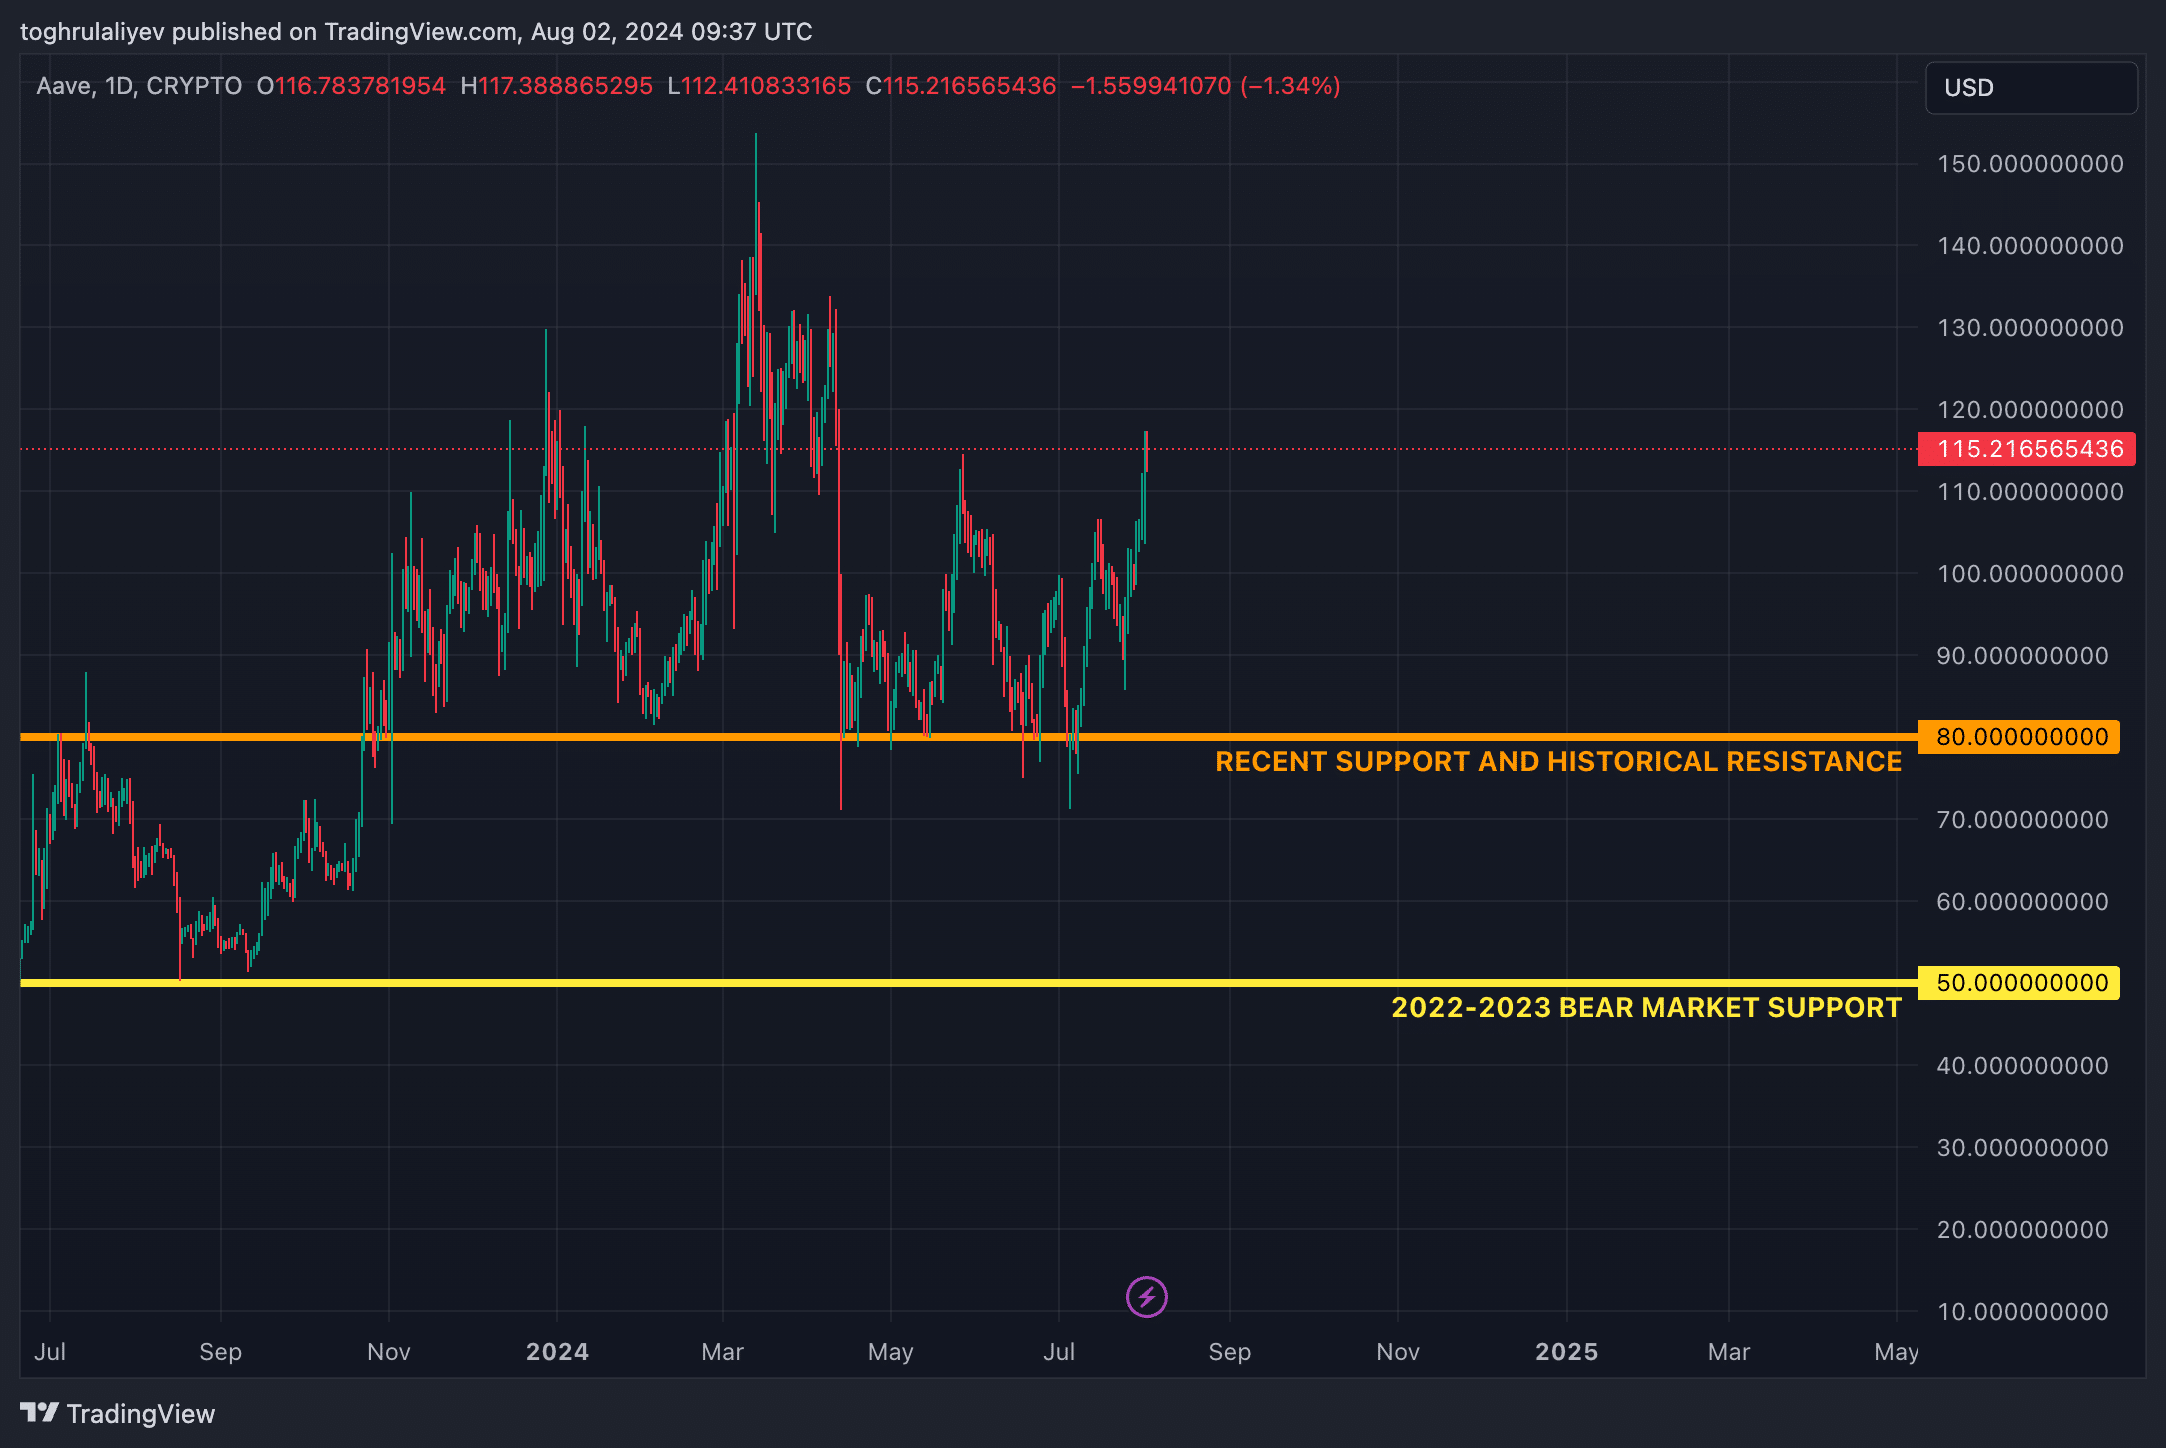
When examining historical support levels, two key areas stand out: the $80 mark and the $50 mark. While the $50 level served as support during the bear market, it seems unlikely that Aave (AAVE) will revisit this area in the current market conditions. On the other hand, the $80 level is a more recent occurrence and represents a support level worth keeping in mind as Aave’s (AAVE) price action unfolds.
Fibonacci retracements analysis
Looking at the macro Fibonacci retracement from the low in August 2019 to the high in May 2021, we observe a significant 78.6% retracement level at $143.09. The last time Aave (AAVE) approached this level was in March 2024, when it ultimately failed to break through. Should Aave (AAVE) succeed in surpassing its historical resistance at $115, the next logical profit target would likely be set at this $143.09 level.
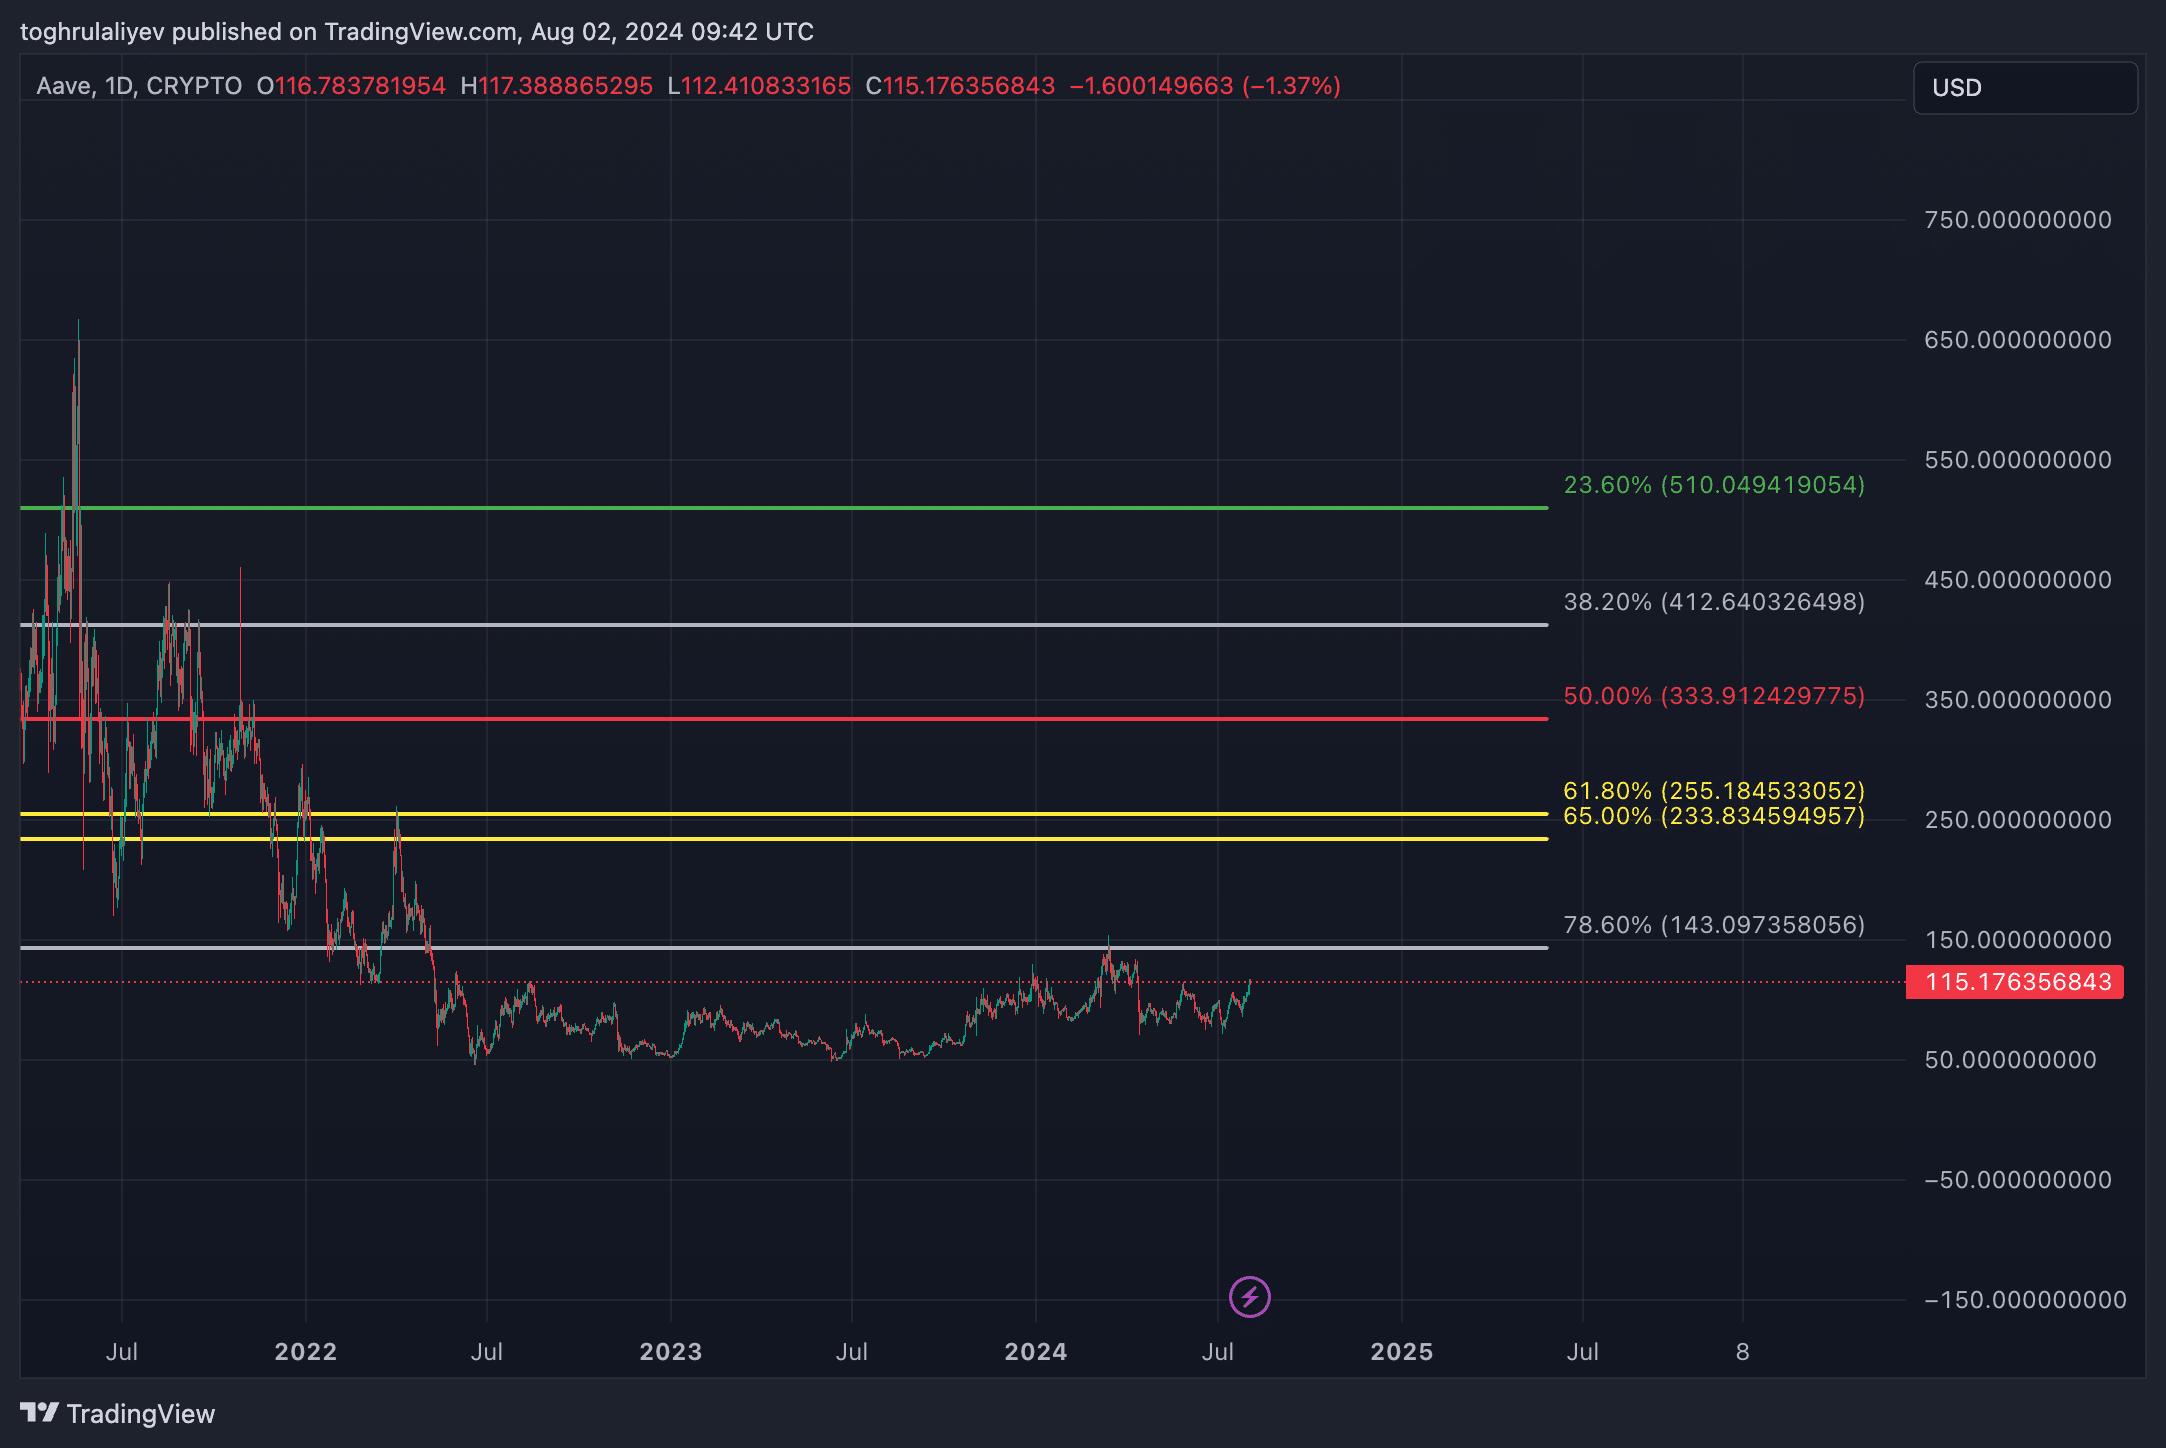
On a more positive note, when examining the Fibonacci retracement from the March 2024 high to the April 2024 low, Aave (AAVE) successfully breached the 23.6%, 38.2%, and 50% levels. It is now approaching the golden pocket, which lies between $121.50 and $124.11. If Aave (AAVE) manages to break above the $115 resistance, this golden pocket represents the next key area to watch. It is a strong, bullish zone with minimal resistance, making it a likely target for further upward movement.
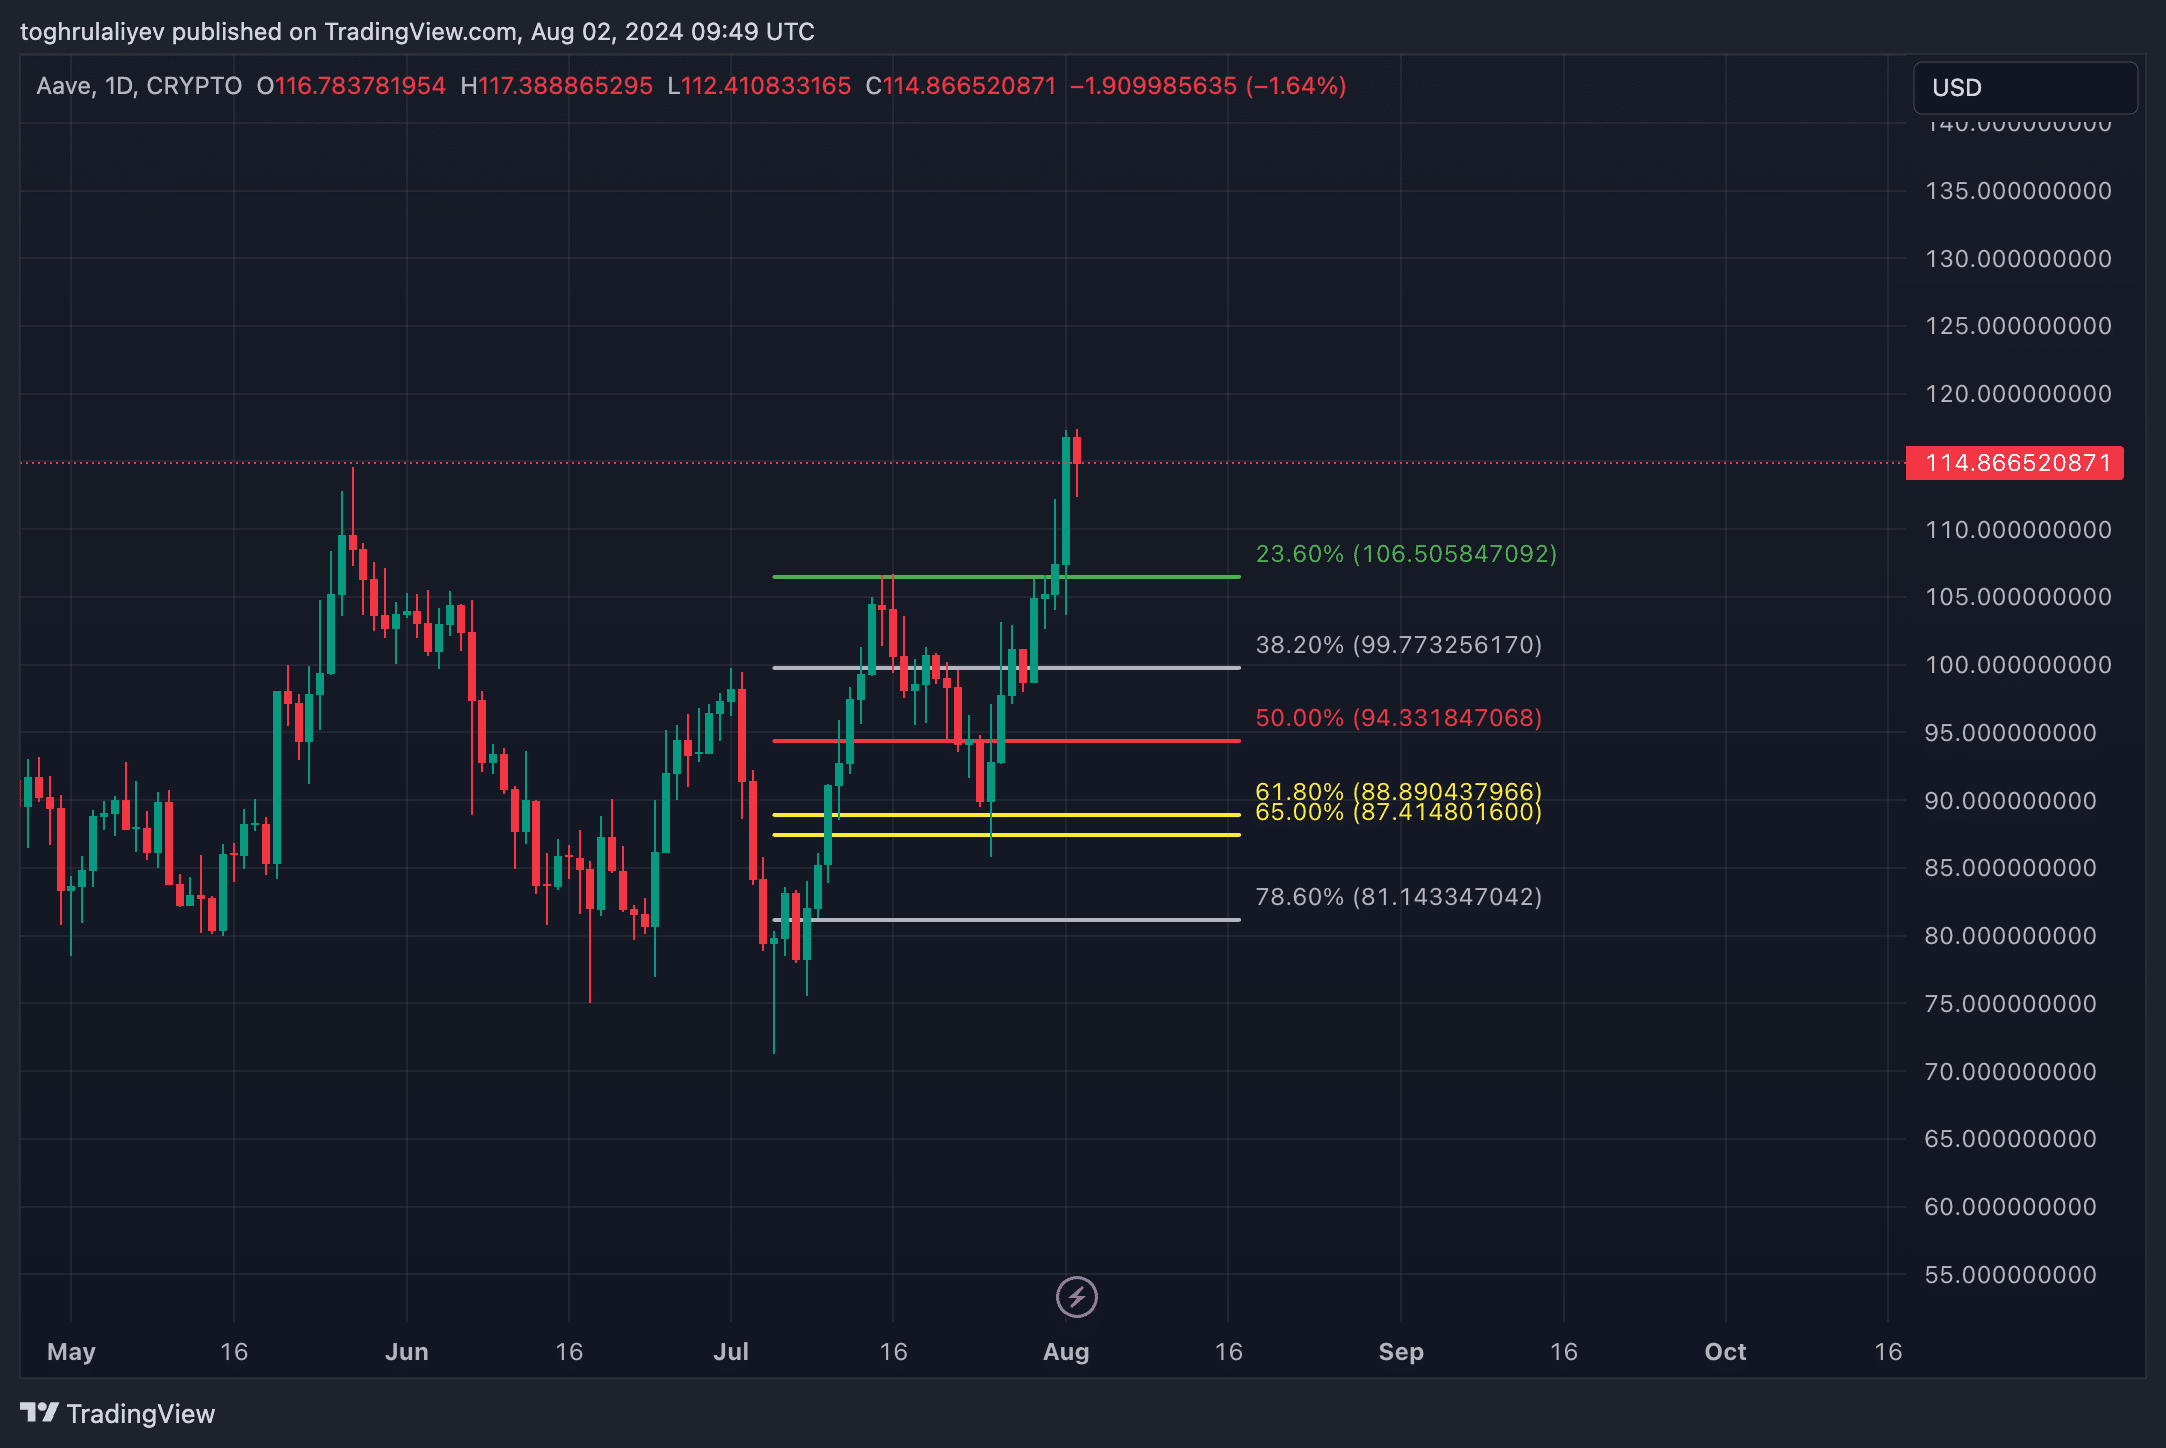
Lastly, when applying Fibonacci from the early July low to the present, we identify two potential levels where Aave (AAVE) might retrace if it fails to break through the $115 resistance. The first is the 23.6% level at $106.50, and the second is the 38.2% level at $99.77, which aligns closely with the psychological $100 mark.
Technical indicators
Bollinger Bands
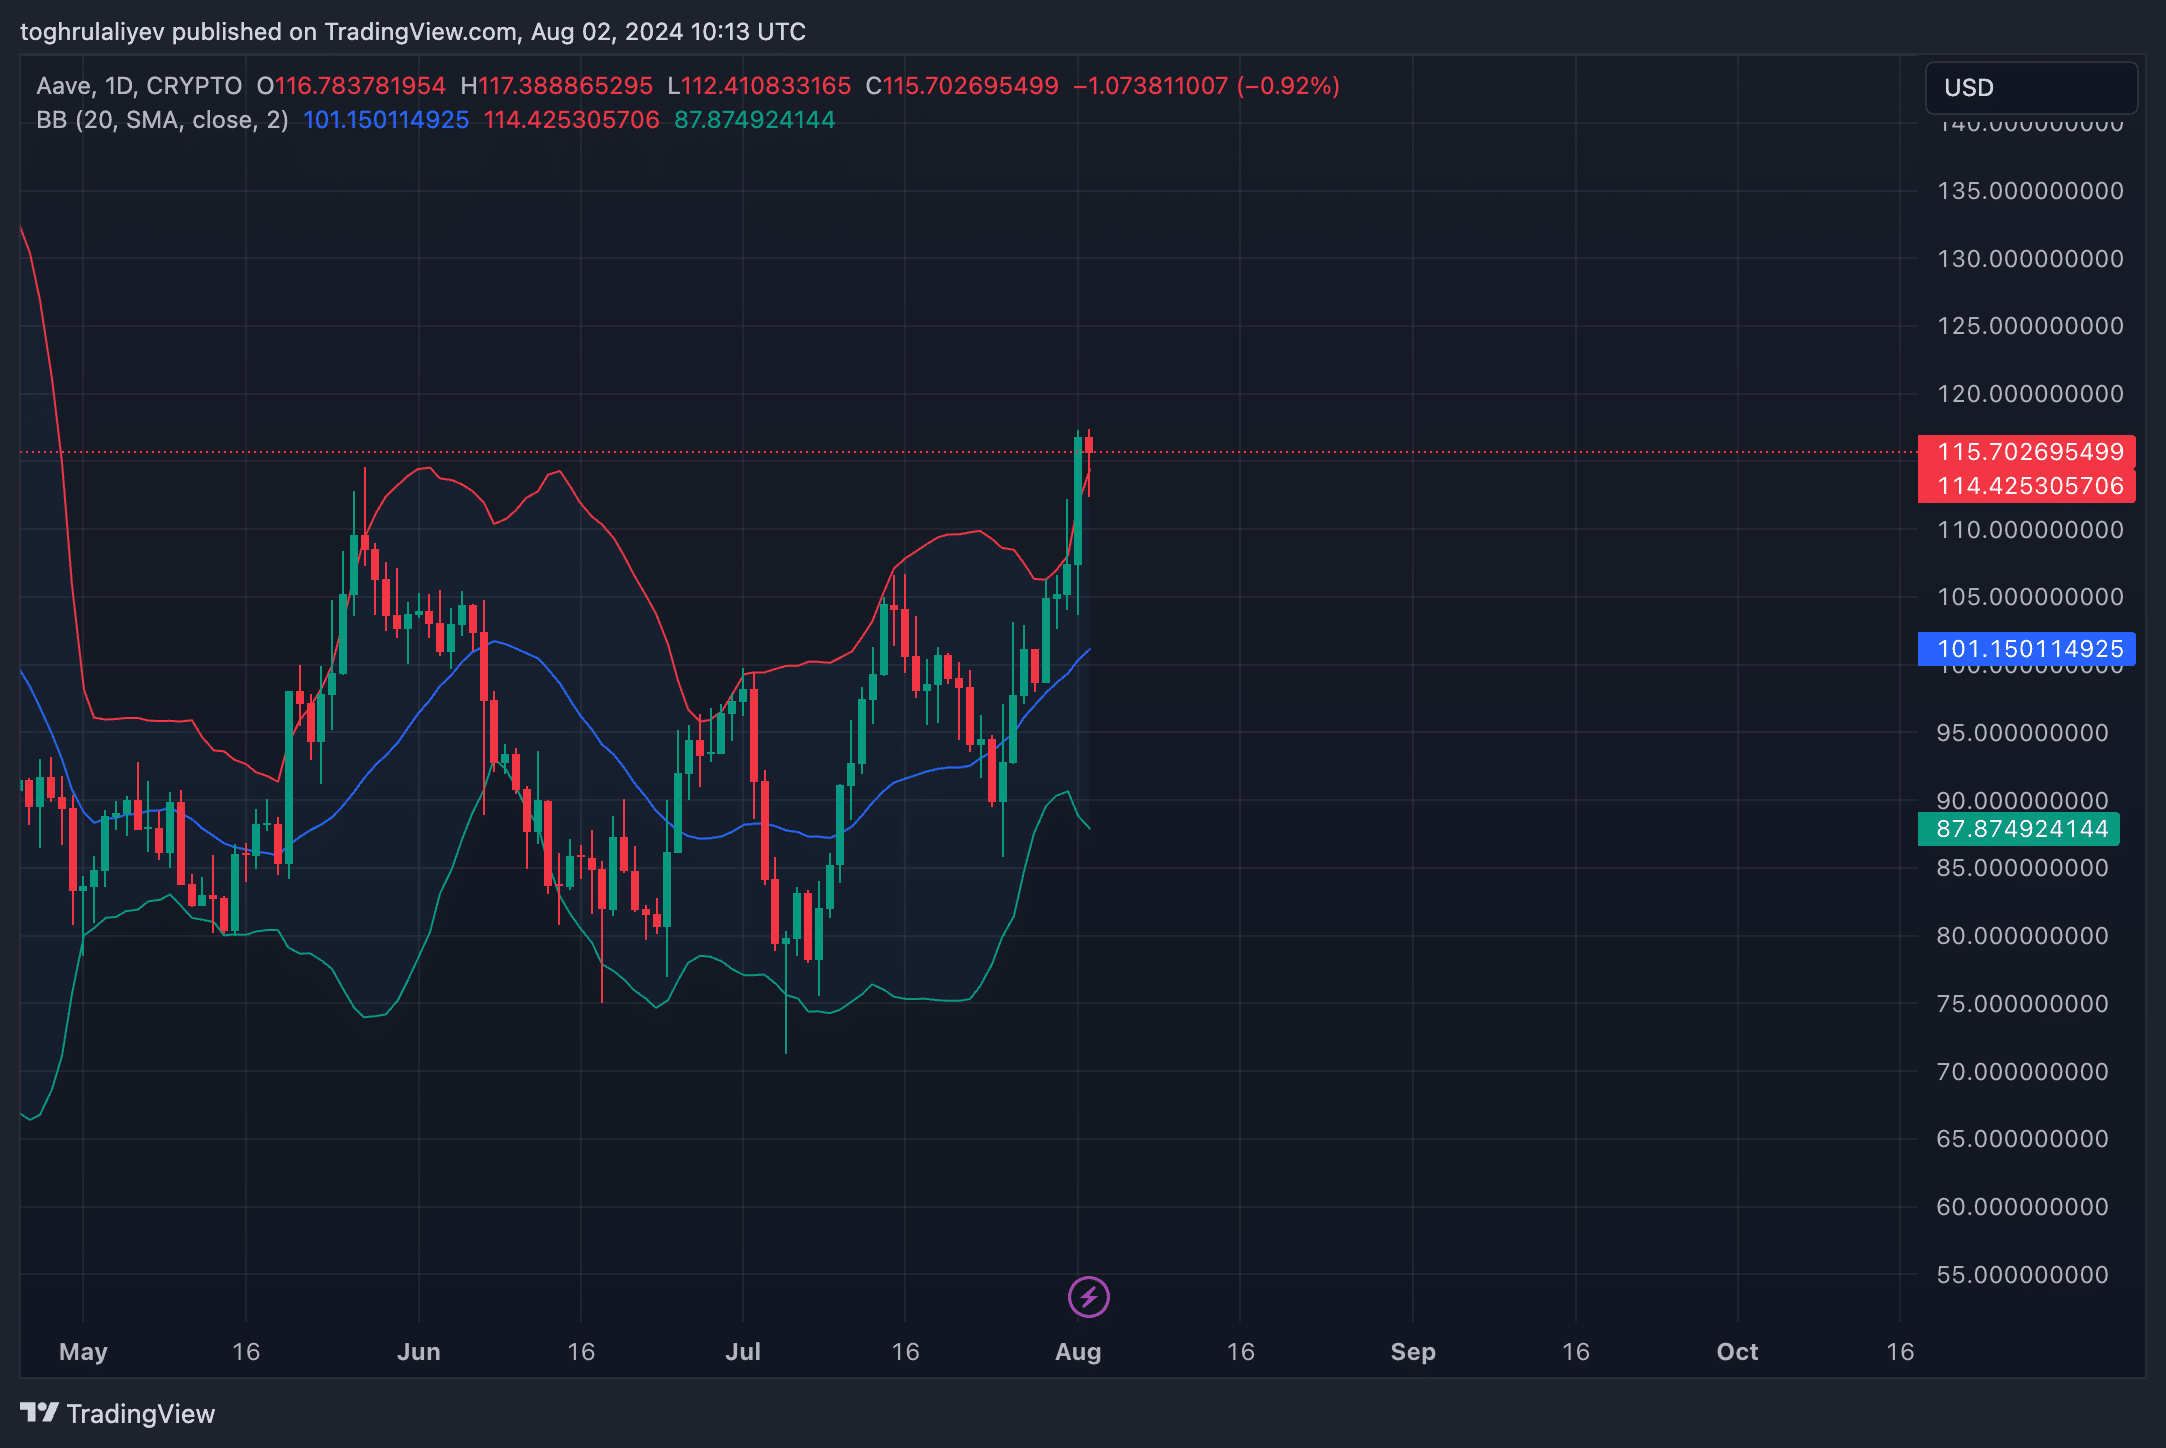
Aave’s (AAVE) recent price action has moved it above the upper Bollinger Band, indicating an overextension in the current uptrend. While trading above the middle band typically signifies a strong upward trend, the price being above the upper band often suggests that the asset is overbought. This positioning implies that the upper band is likely acting as a resistance level, making sustained movement at this level improbable. Given this, it is likely that Aave (AAVE) may experience a correction soon as the price reverts to a more sustainable level within the bands.
MACD
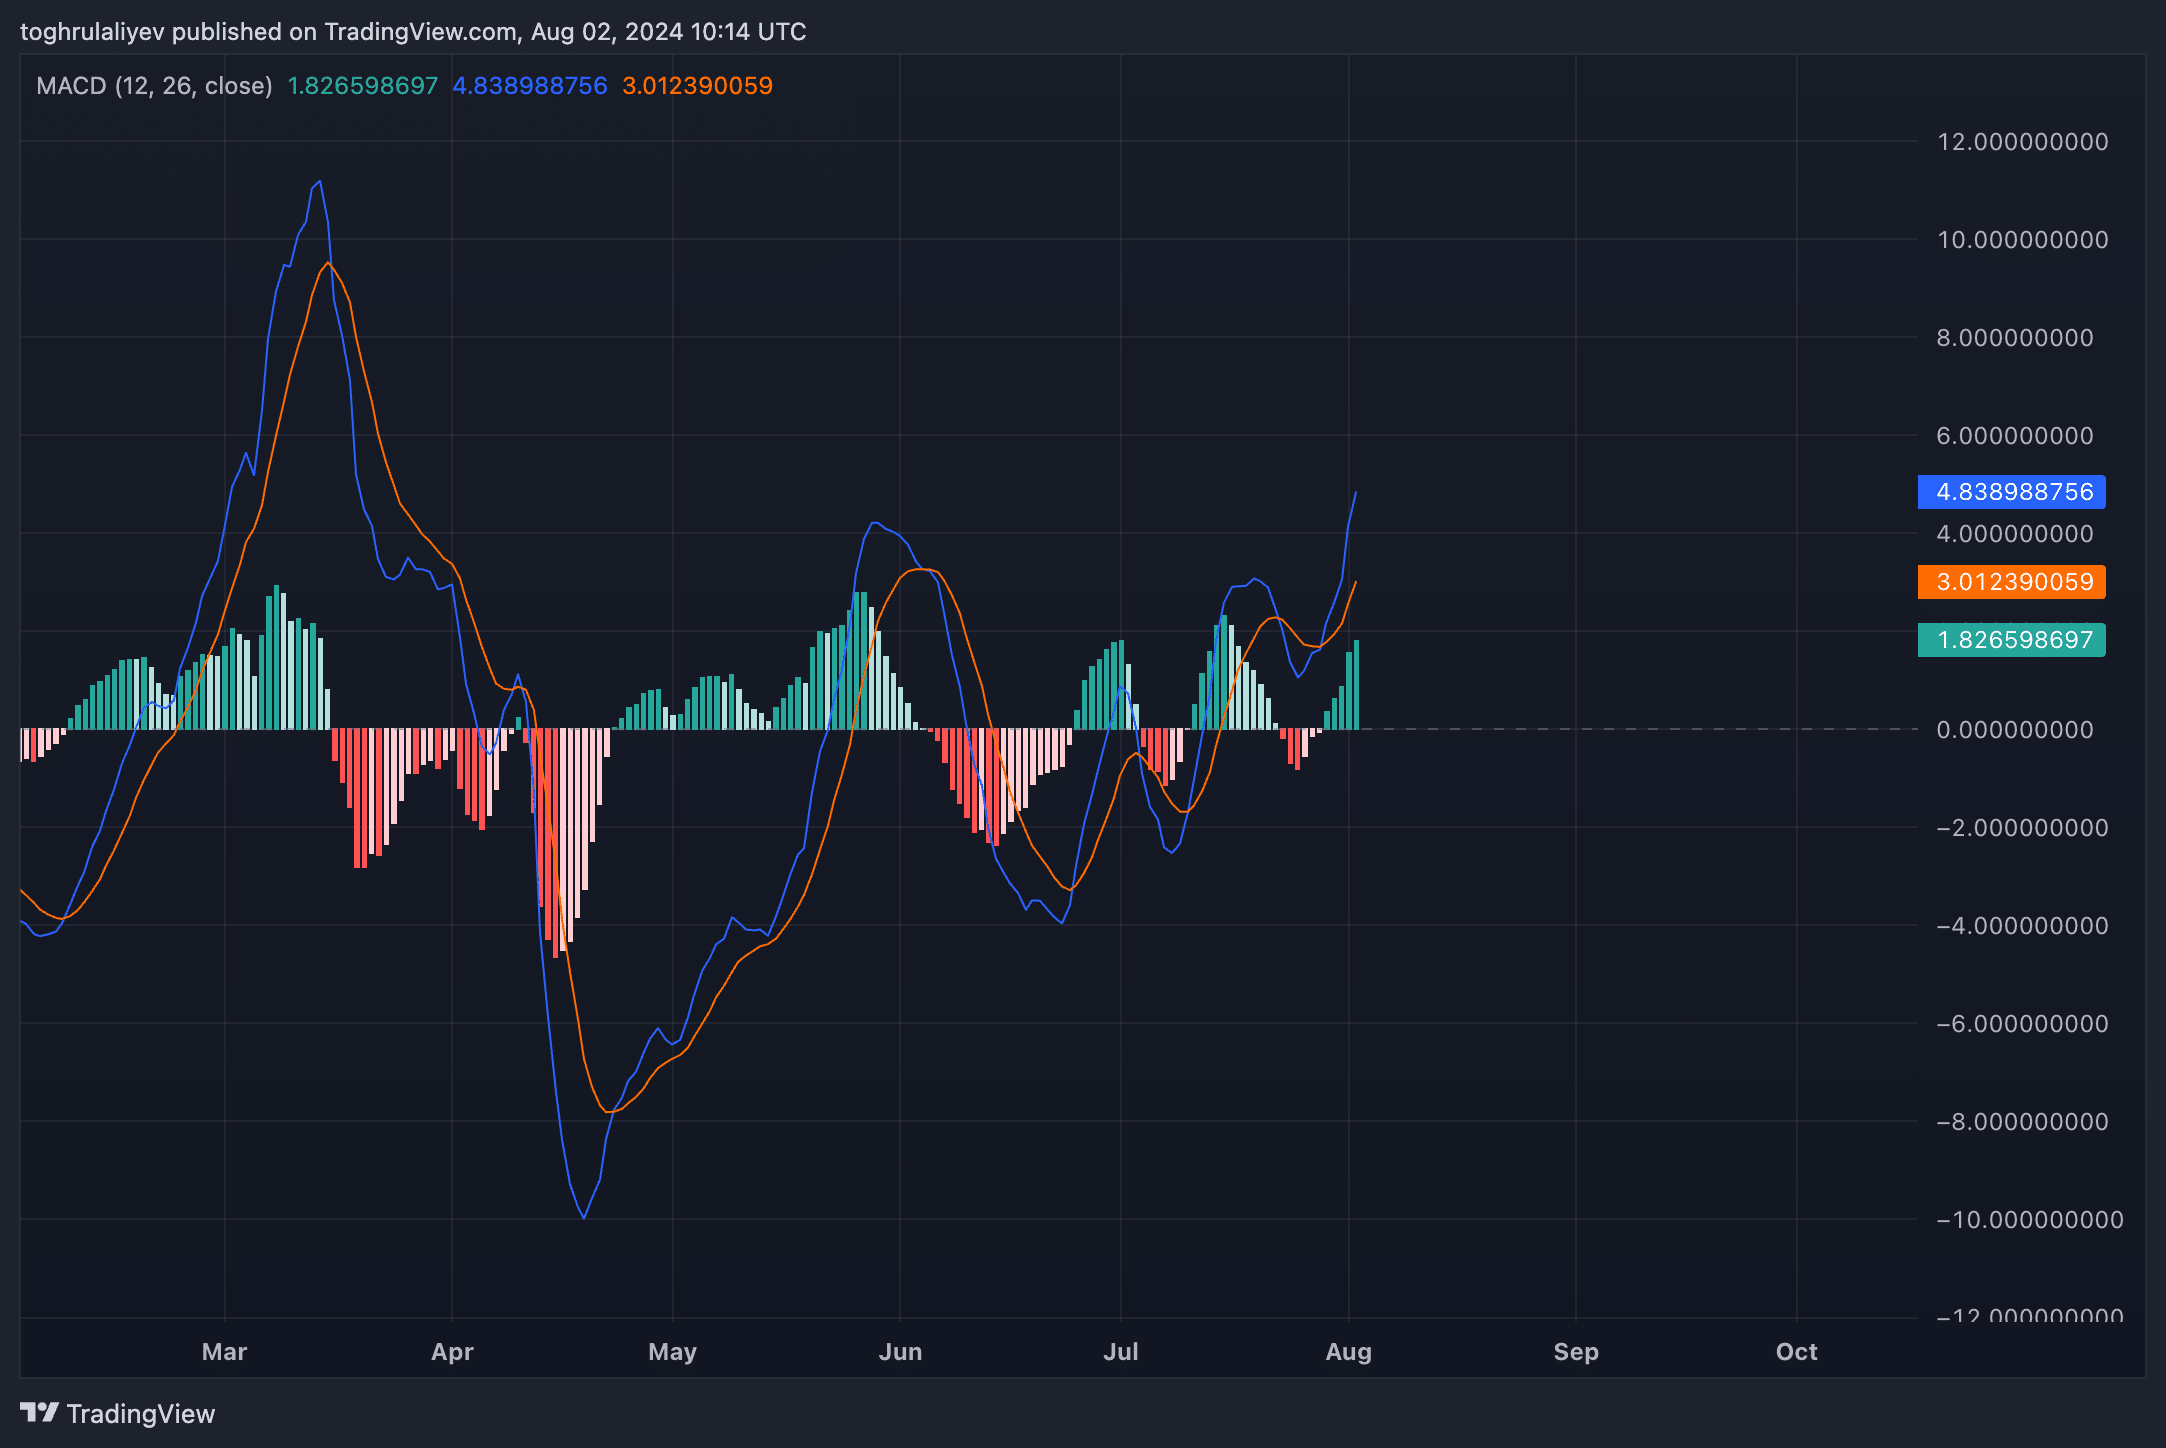
The Moving Average Convergence Divergence (MACD) histogram continues to grow and remains in the green, which signals increasing bullish momentum. The recent bullish crossover, where the MACD line has crossed above the signal line, also strengthens the case for continued upward movement in the near term.
RSI
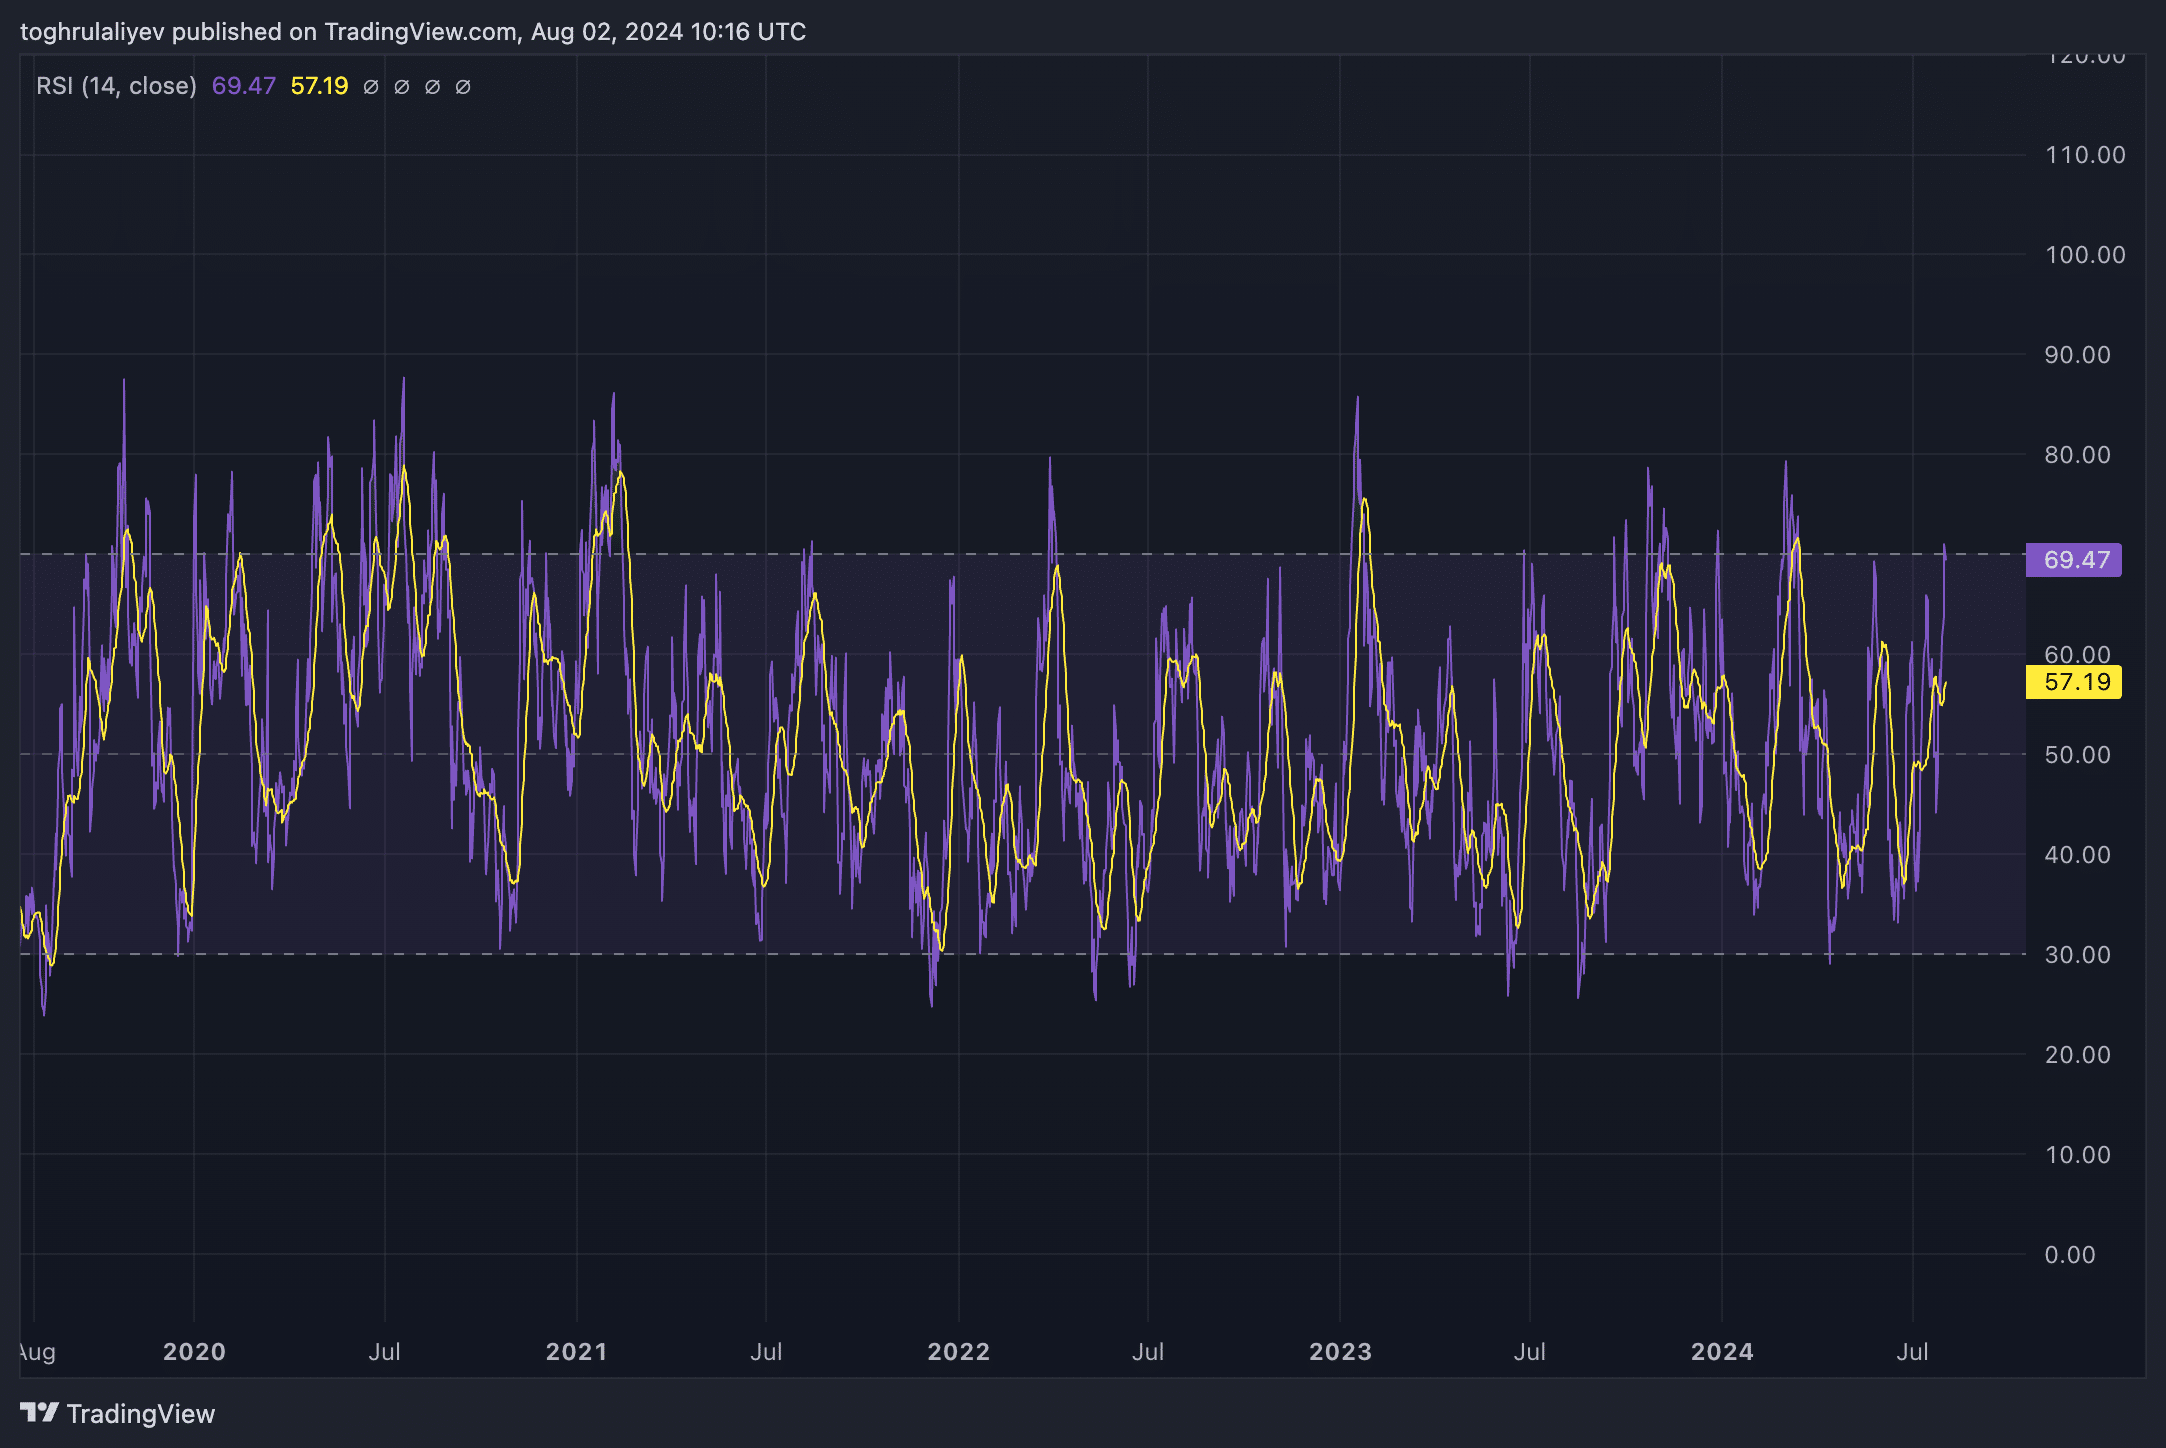
On the other hand, the Relative Strength Index (RSI) is approaching the overbought territory, hovering near the 70 level. Historically, when Aave’s (AAVE) RSI has reached around 70, the bullish momentum has often stalled and led to a pullback.
Strategic considerations
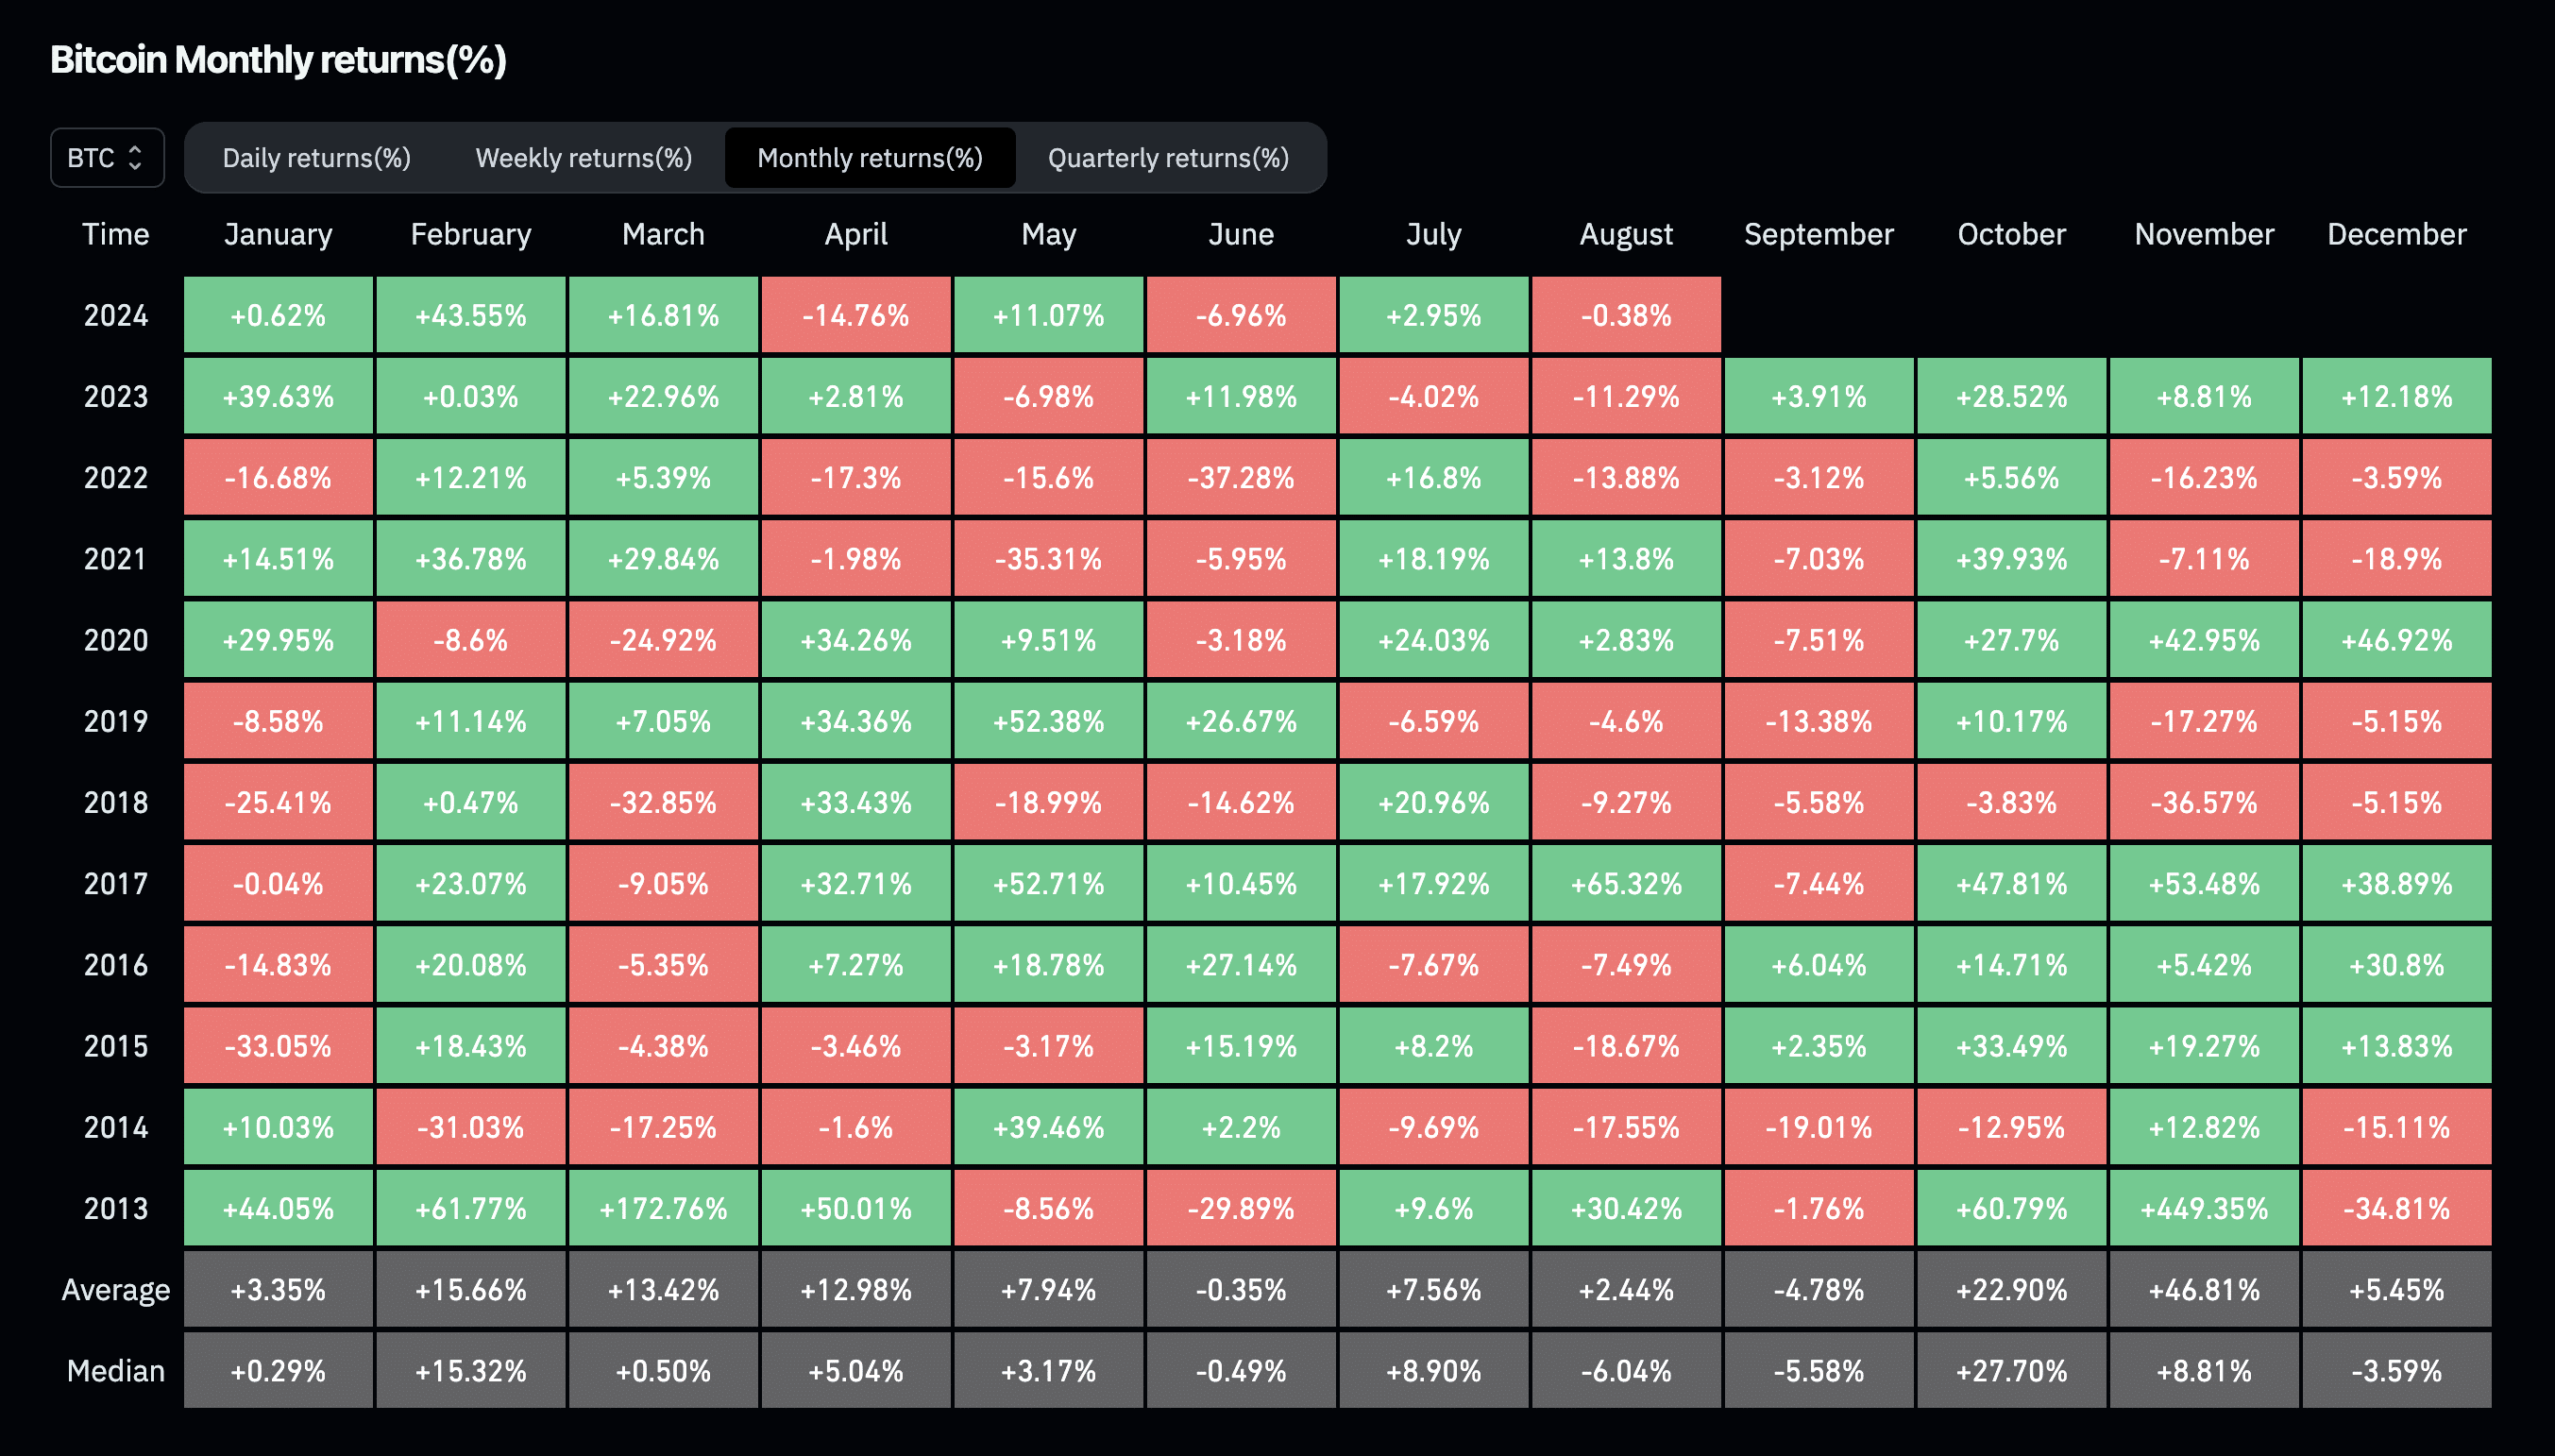
First, it’s important to consider the seasonal patterns within the cryptocurrency market. Historically, August and September have been challenging months for crypto assets. According to data from CoinGlass, the median Bitcoin monthly returns during these months are among the worst in the calendar year. Therefore, expecting significant upward momentum in Aave (AAVE) during this period may be overly optimistic.
Secondly, when evaluating Aave’s (AAVE) current situation using the technical indicators discussed, it becomes apparent that the bullish momentum is not as strong as it might initially appear. The recent breakthroughs in Fibonacci retracement levels and the bullish signals from the MACD are the only indicators suggesting potential upward movement. However, everything else points towards a likely correction.
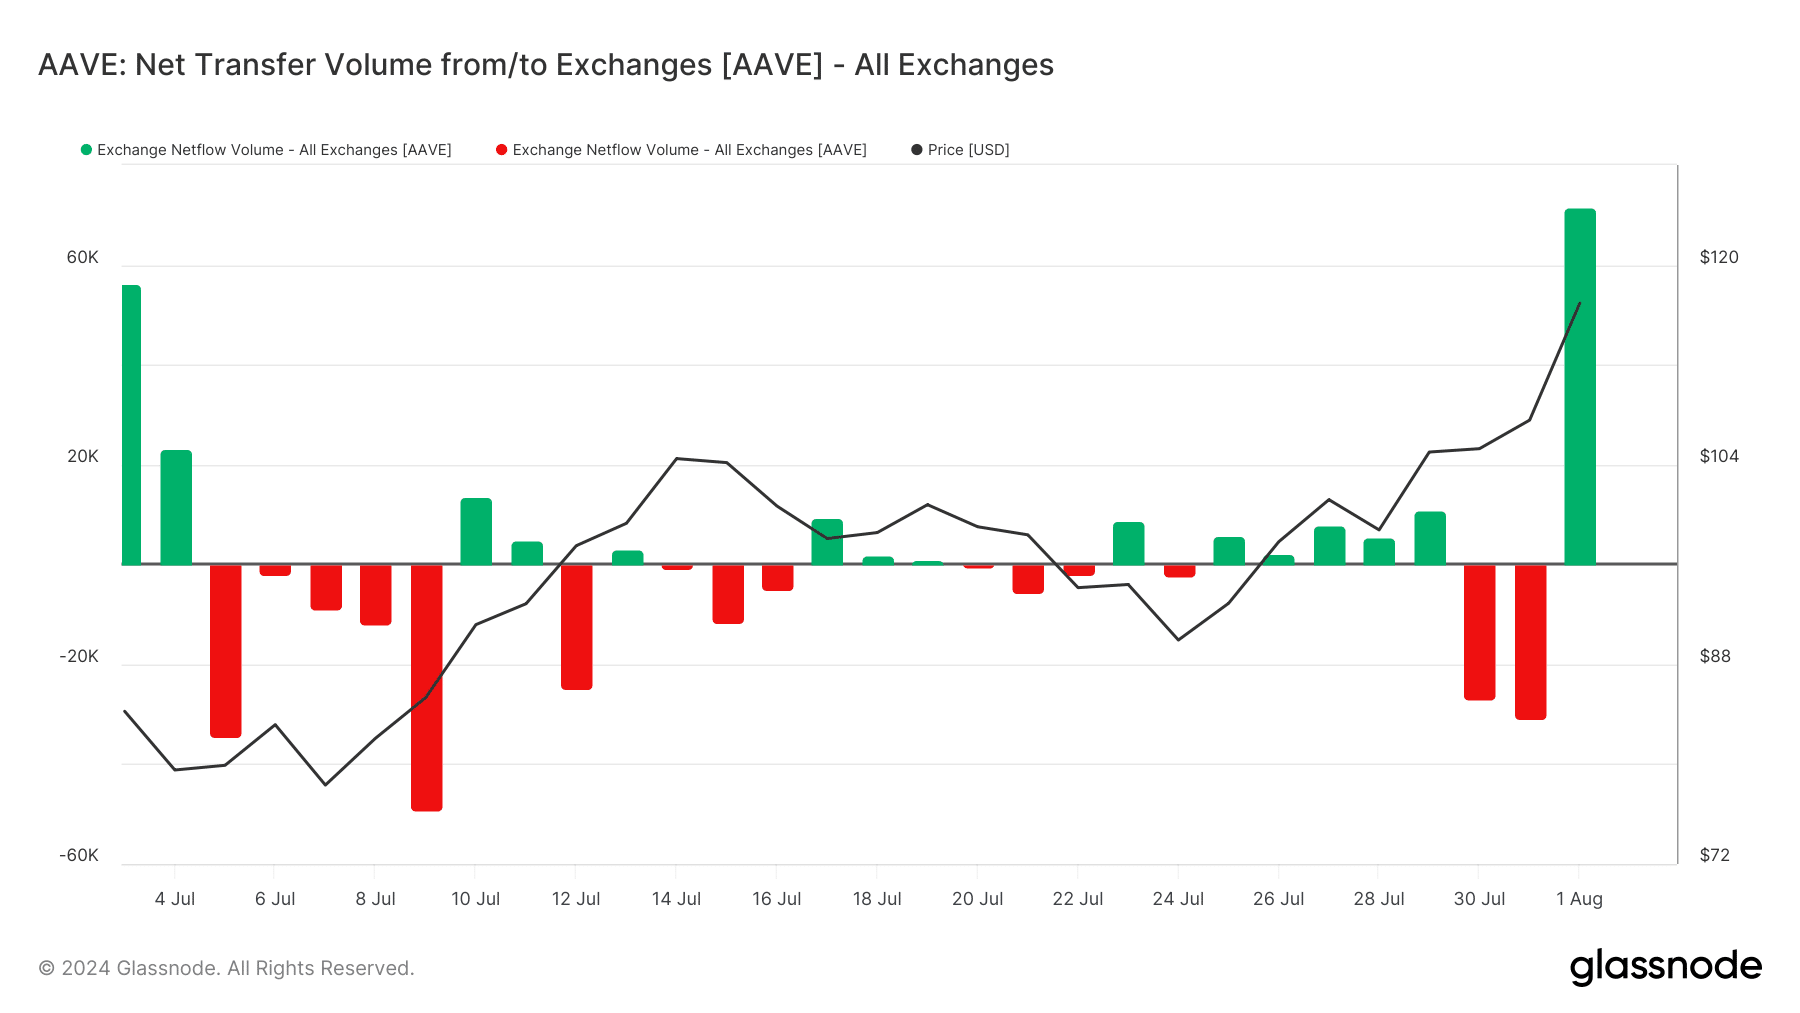
Moreover, while Aave (AAVE) has benefited from positive news and increased whale activity, these factors seem to be losing steam.
The net flow of Aave (AAVE) into exchanges has risen, which indicates potential selling pressure. For instance, on August 1, the net flow into exchanges exceeded $8 million.
Considering these factors, several price targets emerge if Aave (AAVE) fails to break above $115:
- First target: $106.50
- Second target: $100
- Third target: $95
- Fourth target (worst-case scenario): The golden pocket is between $87.41 and $88.89, which closely aligns with the $90 level.
If Aave (AAVE) does manage to break above $115, the outlook will shift toward a bullish scenario. In such a case, traders should watch for a subsequent retest of the $115 level as new support. Successfully holding this level would confirm the breakout and reinforce the momentum. Profit targets should then be adjusted upwards, focusing on the golden pocket between $121.50 and $124.11, followed by $135.20, and ultimately $143.09.
Disclosure: This content is provided by a third party. crypto.news does not endorse any product mentioned on this page. Users must do their own research before taking any actions related to the company.
