

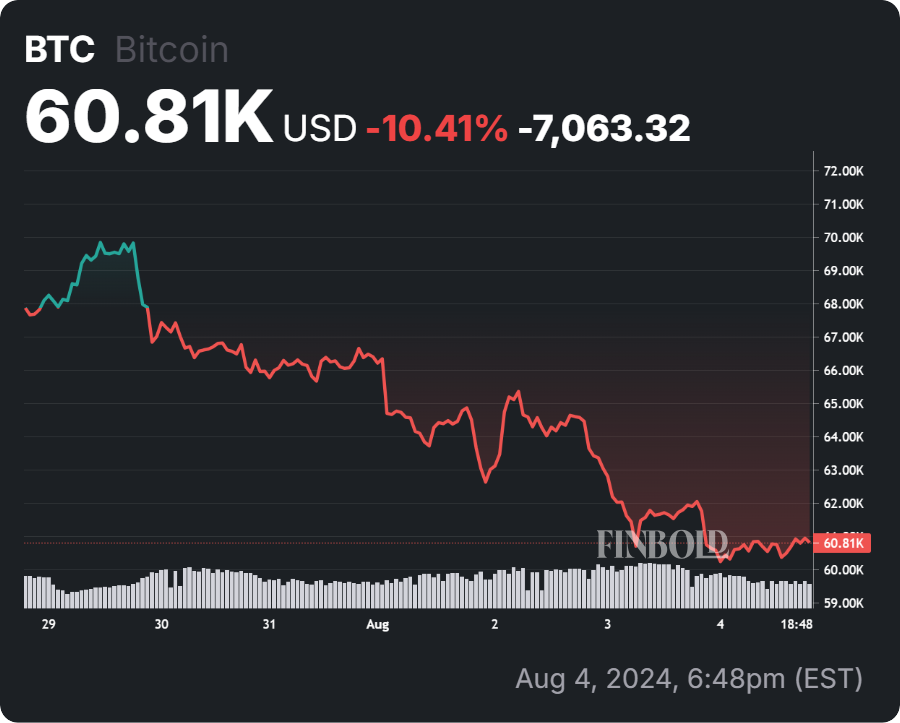
Bitcoin (BTC) has experienced a significant drop over the weekend, with the cryptocurrency falling below $61,000.
This decline has been analyzed as part of a larger consolidation phase that has persisted for the past five months, according to a TradingView post by crypto trading expert RLinda.
The analyst attributes the failure to surpass the critical $70,000 resistance and the recent drop in prices to several key factors, both fundamental and technical.
Fundamental factors
On the fundamental side, macroeconomic indicators have played a significant role. The release of the Nonfarm Payroll (NFP) report on August 2, which showed an increase in unemployment from 4.0% to 4.3%, alongside rising inflation, has created a negative sentiment in the markets.
This adverse economic data has led to a sell-off in Bitcoin as investors reacted to broader market conditions. Fears of a looming recession, long predicted by some economists, have intensified following the weak jobs report.
Economist Peter Schiff has been vocal in amplifying these concerns, contributing to broader market volatility.
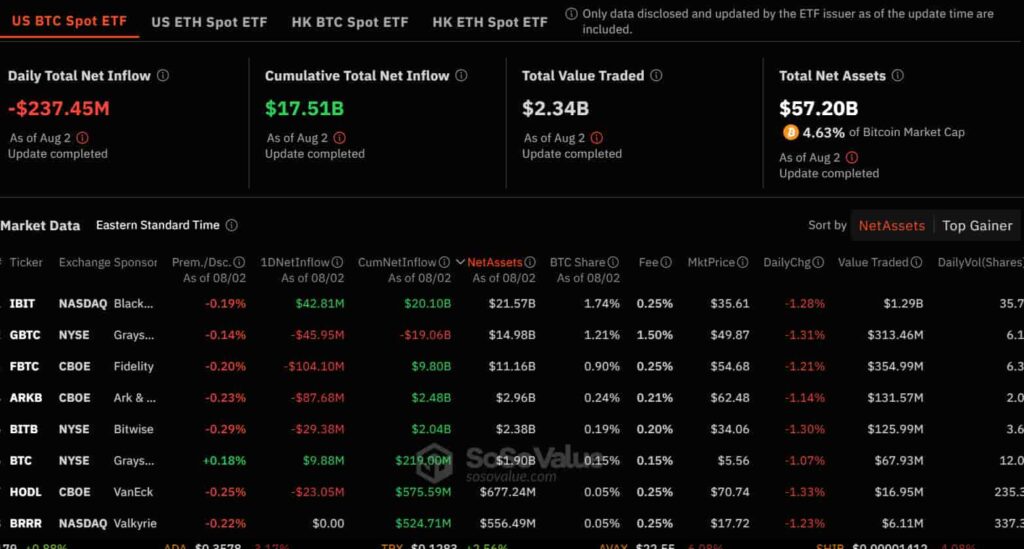
Moreover, according to data from SosoValue both Bitcoin and Ethereum ETFs have faced significant outflows, exacerbating the market’s troubles. Bitcoin ETFs saw $237.4 million in outflows on August 2, with a weekly total of $80.4 million.
Ethereum ETFs experienced outflows totaling $54.3 million for the day and $169.4 million for the week.
Genesis Trading’s bankruptcy restructuring and distribution of $4 billion in assets may also have contributed to the crash.
The US decision to allow Bitcoin as a reserve asset and the upcoming presidential race has added to market volatility. Market makers and large investors, or “whales,” have manipulated sentiment, further pressuring Bitcoin’s price.
Technical analysis and key levels to watch
Bitcoin’s price action have formed a bullish flag pattern, a continuation signal suggesting potential upward momentum after a period of consolidation.
Despite multiple attempts, the price has failed to break above the $70,000 mark, leading to a correction towards the $64,000 level.
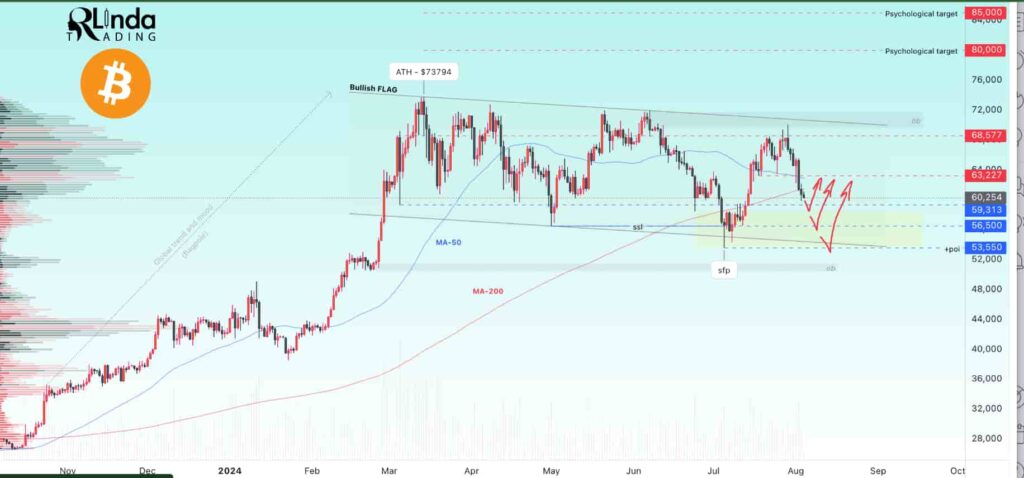
Currently, Bitcoin is testing the 200-day moving average (MA-200) around the $59,300 level while being squeezed between the 50-day moving average (MA-50) at approximately $63,250 and MA-200.
If the MA-200 fails to hold, Bitcoin may continue to decline towards the lower boundary of the flag, potentially finding support around $56,500.
Conversely, if bulls manage to defend the MA-200 and consolidate above $63,300, a rally could be expected.
Key resistance levels to watch are $63,250 and $68,570, while key support levels include $59,300 and $56,500.
Bitcoin price analysis
At press time, Bitcoin was trading at $60,800, having plunged 1.5% in the last 24 hours.
Bitcoin’s weekend drop can be attributed to a combination of fundamental factors such as economic data, market sentiment, significant ETF outflows, and strategic moves by market makers and whales, along with technical resistance and key-level testing.
As the cryptocurrency navigates through these challenges, investors should remain vigilant of key support and resistance levels alongside macroeconomic indicators to make informed decisions.
Disclaimer: The content on this site should not be considered investment advice. Investing is speculative. When investing, your capital is at risk.

 Nears $59,000 in Sunday Bloodbath; DOGE, XRP, SOL Prices Drop Amid $200M Liquidations")
