

- The Bitcoin Dominance and Tether Dominance chart underlined BTC’s strength.
- There were signs of high buying power due to the stablecoin supply, which could help with recovery.
The Bitcoin [BTC] Dominance metric has rocketed higher in recent weeks. During this time, the price of the king of cryptos has formed a bearish structure on the weekly chart.
On the back of negative macroeconomic news, BTC dived as low as $49k. Altcoins suffered more-the top 125 altcoins, excluding Ethereum [ETH], collectively lost $187 billion from the market cap since the 5th of August.
Range breakout for Bitcoin Dominance
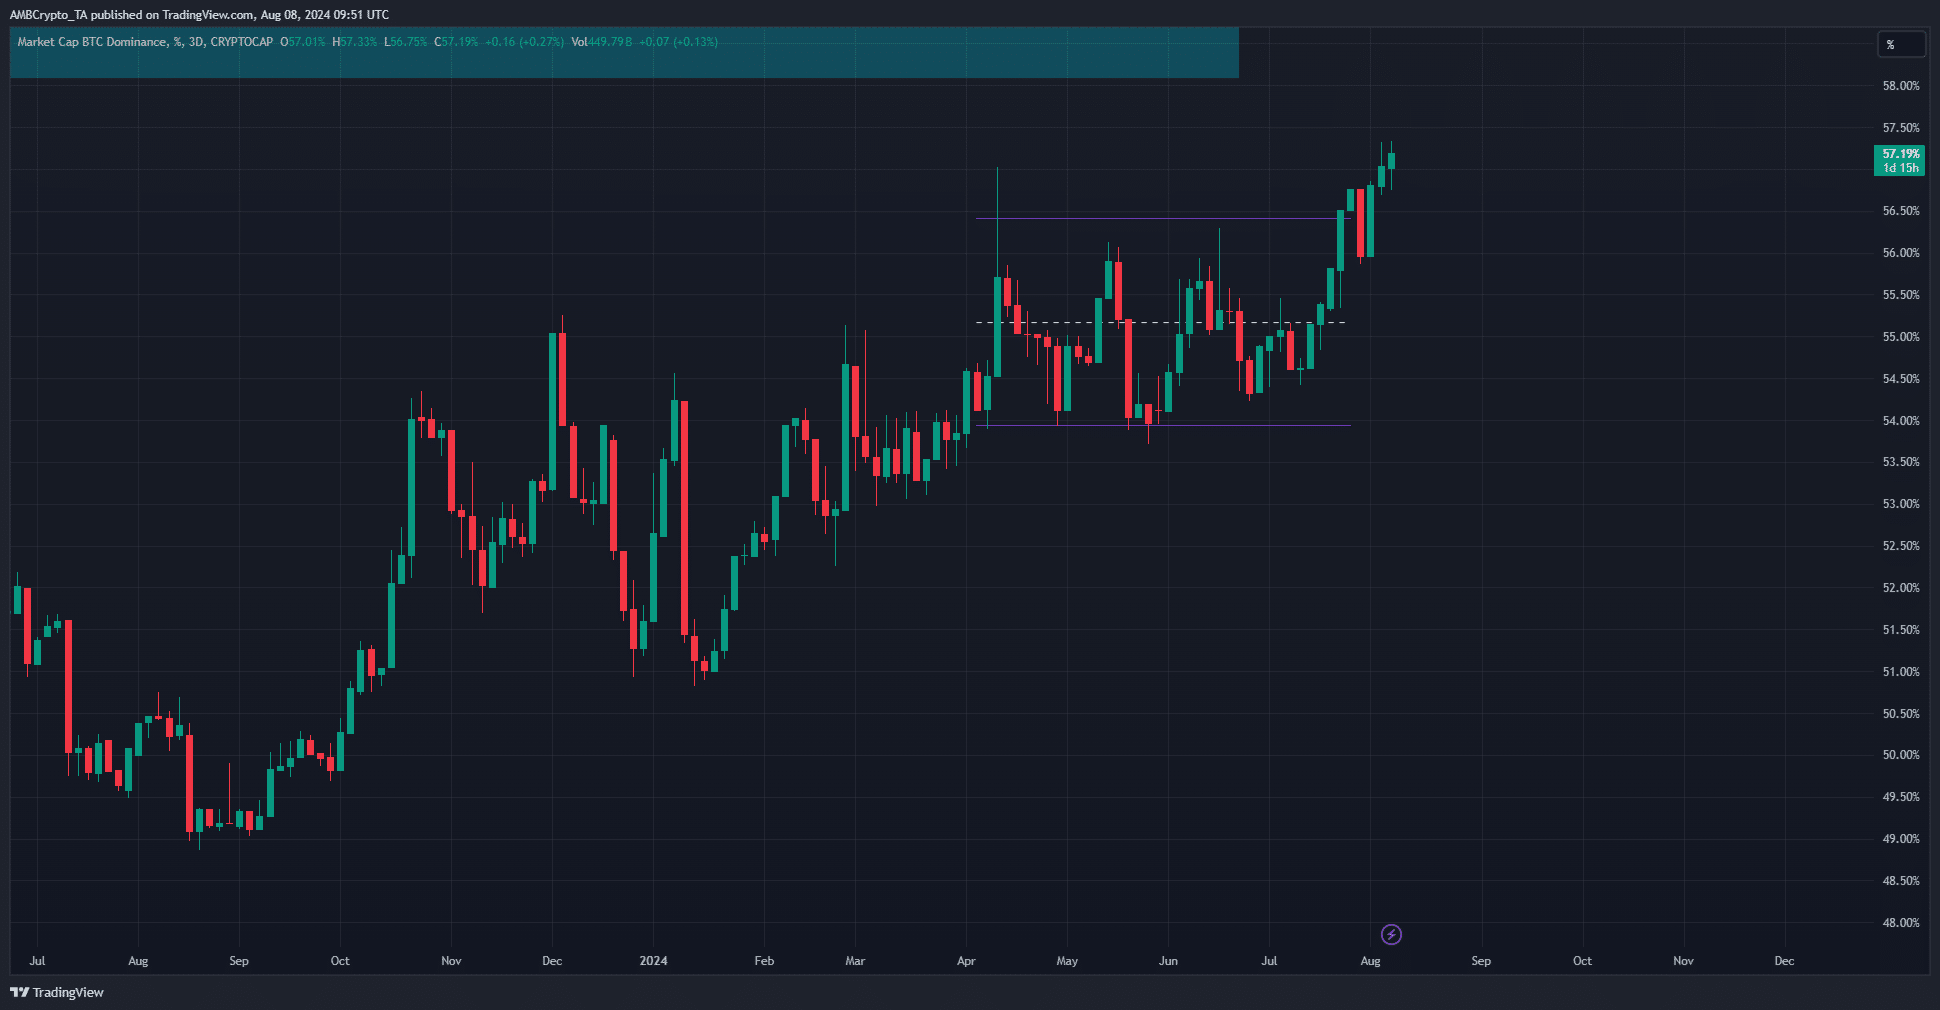
Source: BTC.D on TradingView
The Bitcoin Dominance is a measure of the market cap of BTC as a share of the total crypto market cap. When this metric rises, it means BTC occupies more market cap, meaning its performance has been better than the rest of the altcoin market.
The range breakout seen over the past ten days meant that the harsh market sentiment affected altcoins worse than it did BTC, which happens during times of extreme panic.
The uptrend on the BTC.D was a sign that the altcoin market is likely to see more pain.
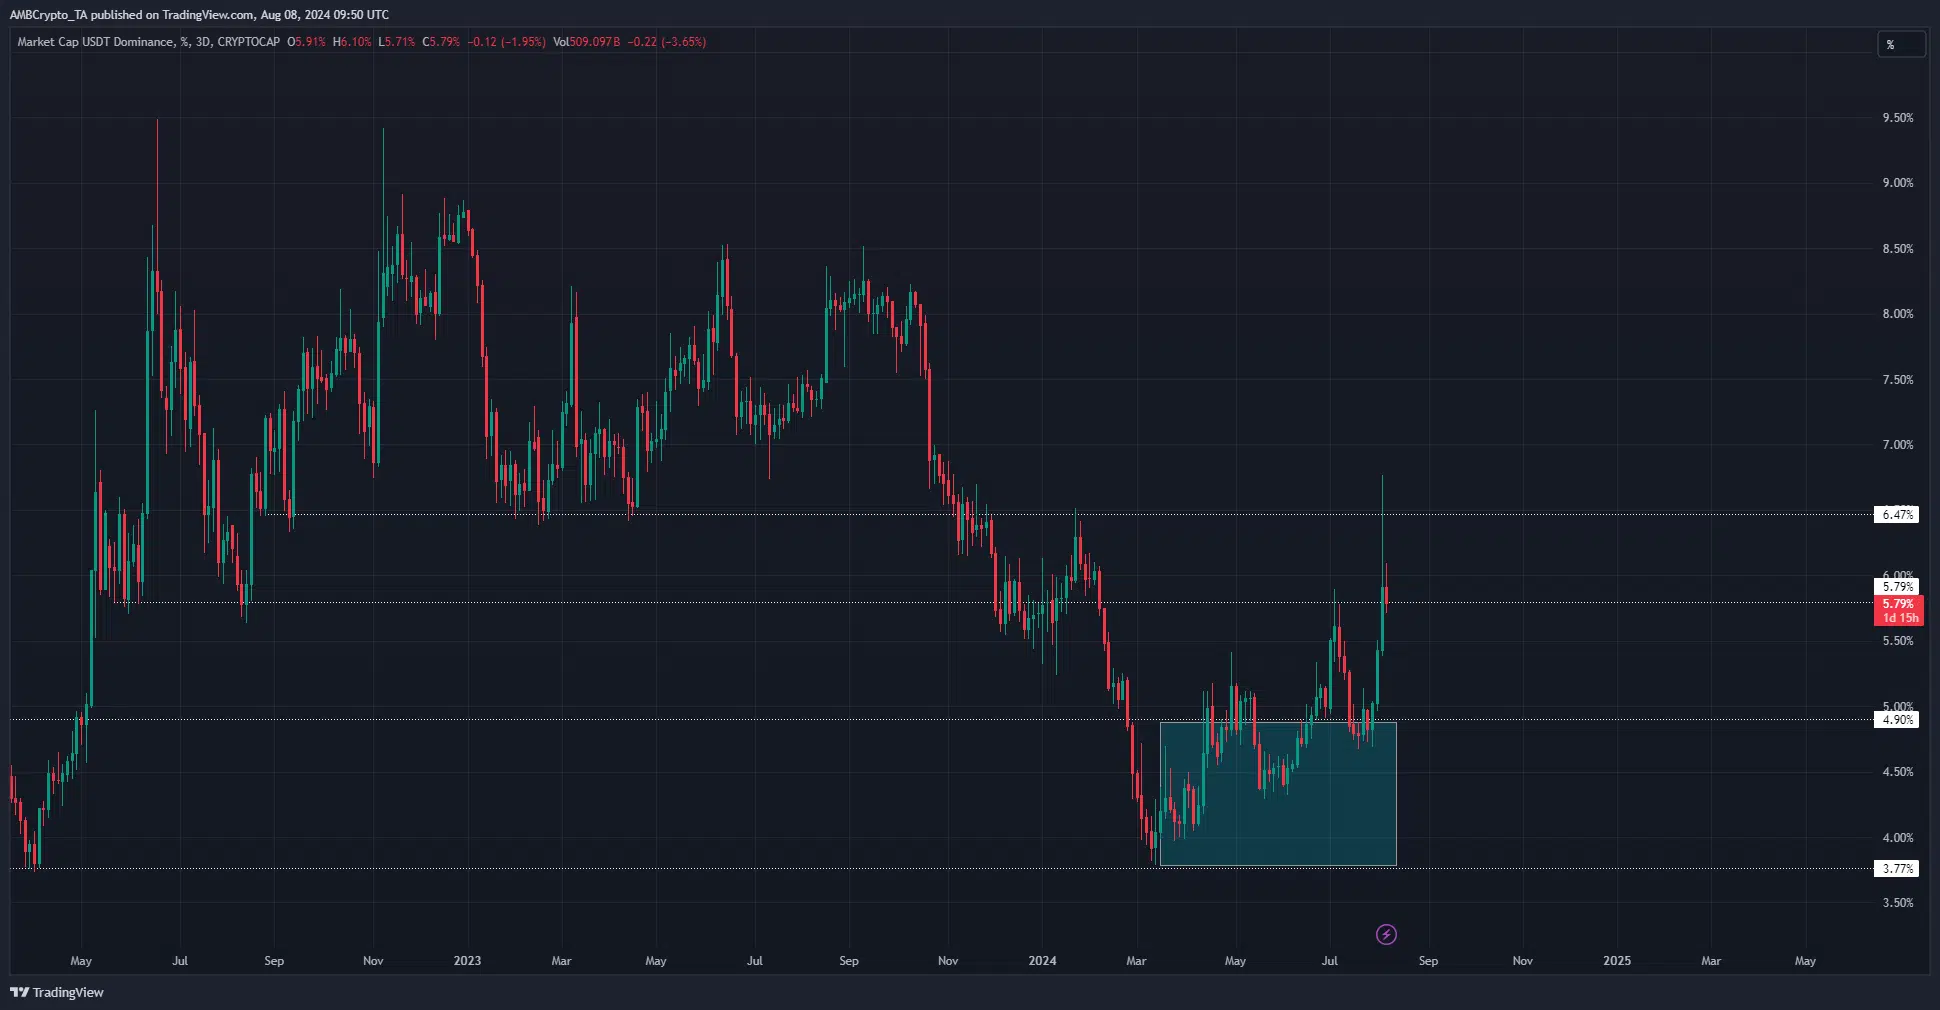
Source: USDT.D on TradingView
The USDT.D, or Tether Dominance, was also trending higher. This meant investors were increasingly exchanging their crypto for stablecoin Tether [USDT], a show of no-confidence in crypto. This was a sign of selling pressure across the market.
Bitcoin might reap the greatest benefits from a price bounce
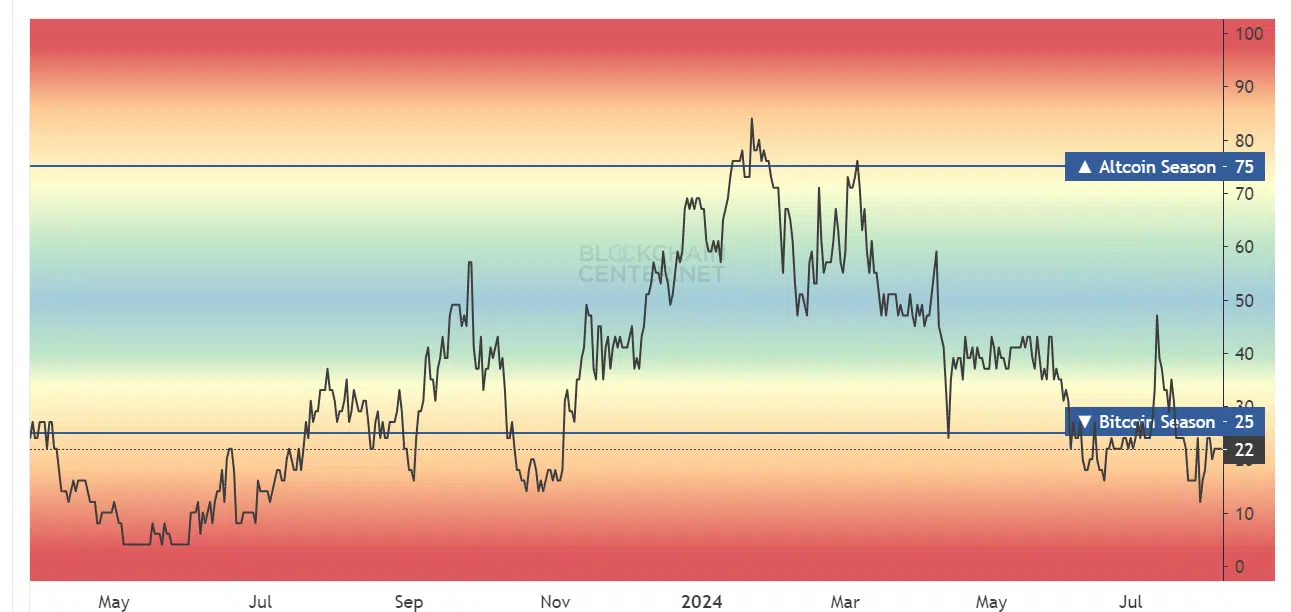
Source: Blockchain Center
The altcoin season index showed a reading of 22, meaning it was Bitcoin season. Combined with the earlier findings, this does not bode well for altcoins.
Even though many of them might bounce double-digit percentages, it is still likely that the market favors Bitcoin due to the Bitcoin Dominance uptrend.
Confidence in the king of crypto has been consistently better than the motley assortment of meme coins and altcoins that populate the list of the biggest crypto tokens.
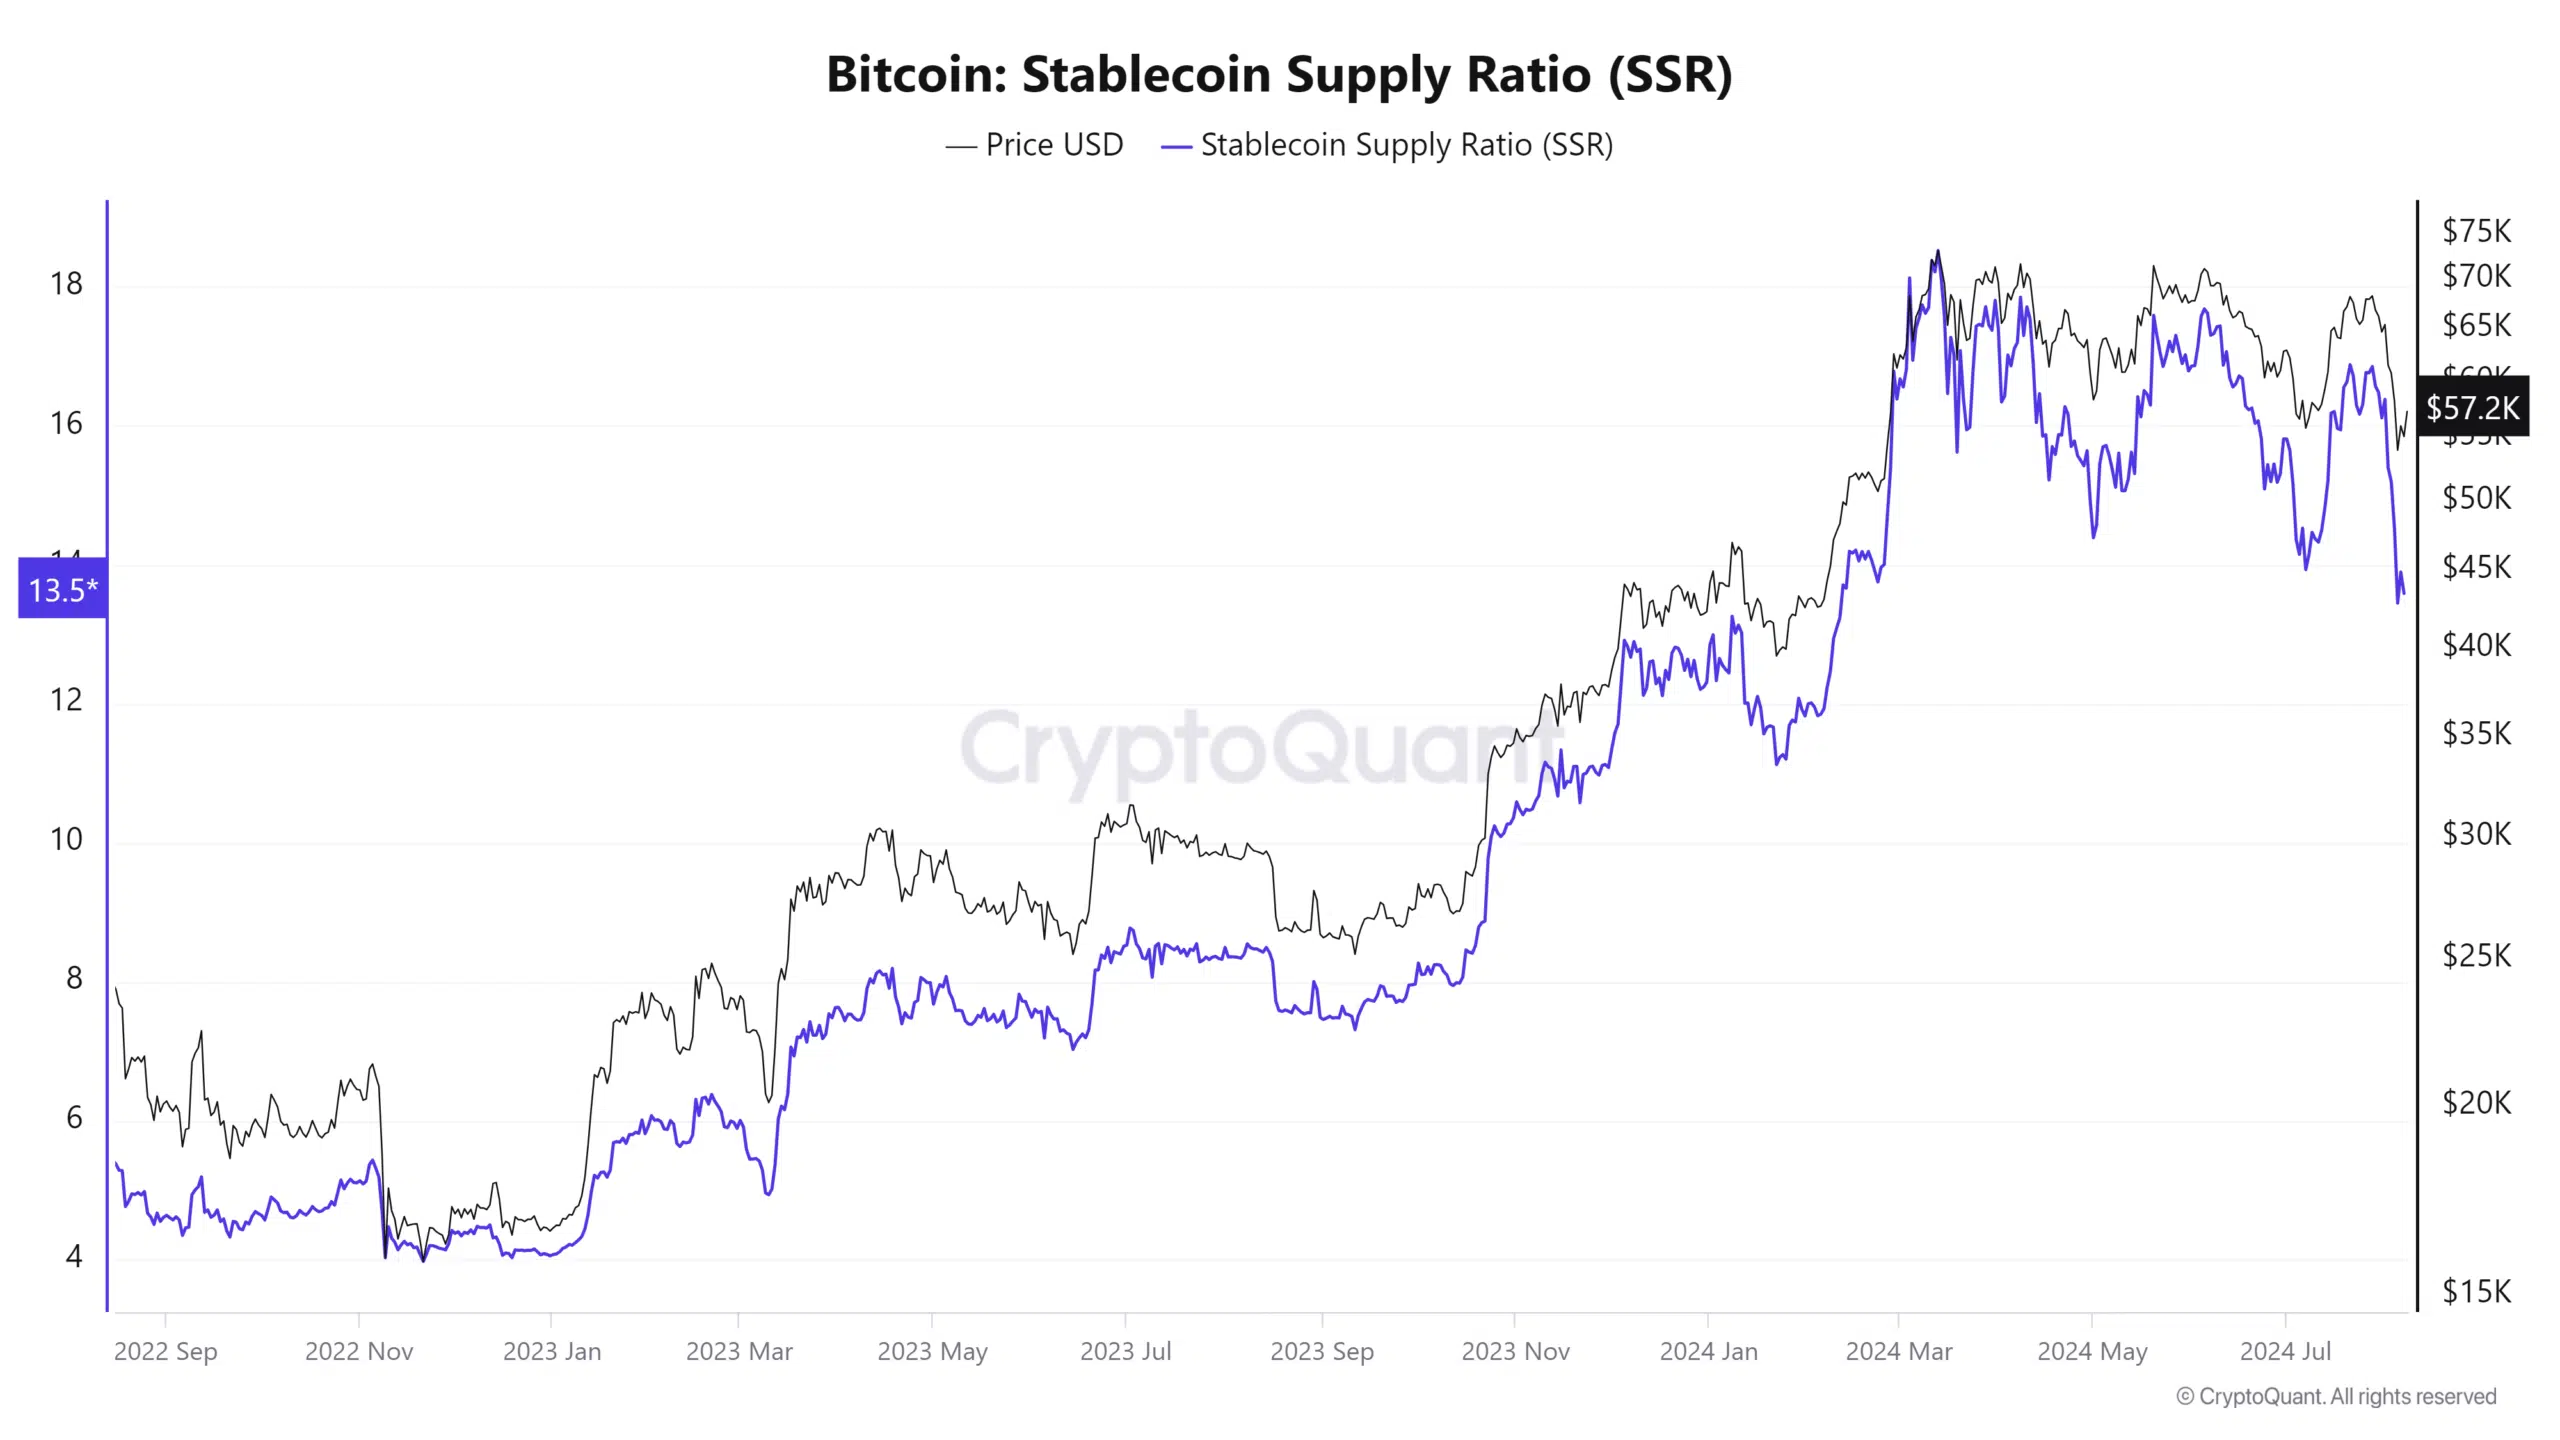
Source: CryptoQuant
Read Bitcoin’s [BTC] Price Prediction 2024-25
The stablecoin supply ratio fell to new lows for the year of 2024. It is the ratio of Bitcoin’s market cap to the stablecoin market cap. A fall in this metric meant there was a higher supply of stablecoins.
In turn, the implication is that there is greater buying power. It could play a key role in the recovery of Bitcoin, and lead to BTC outperforming the rest of the crypto market due to the rising BTC.D trend.


