

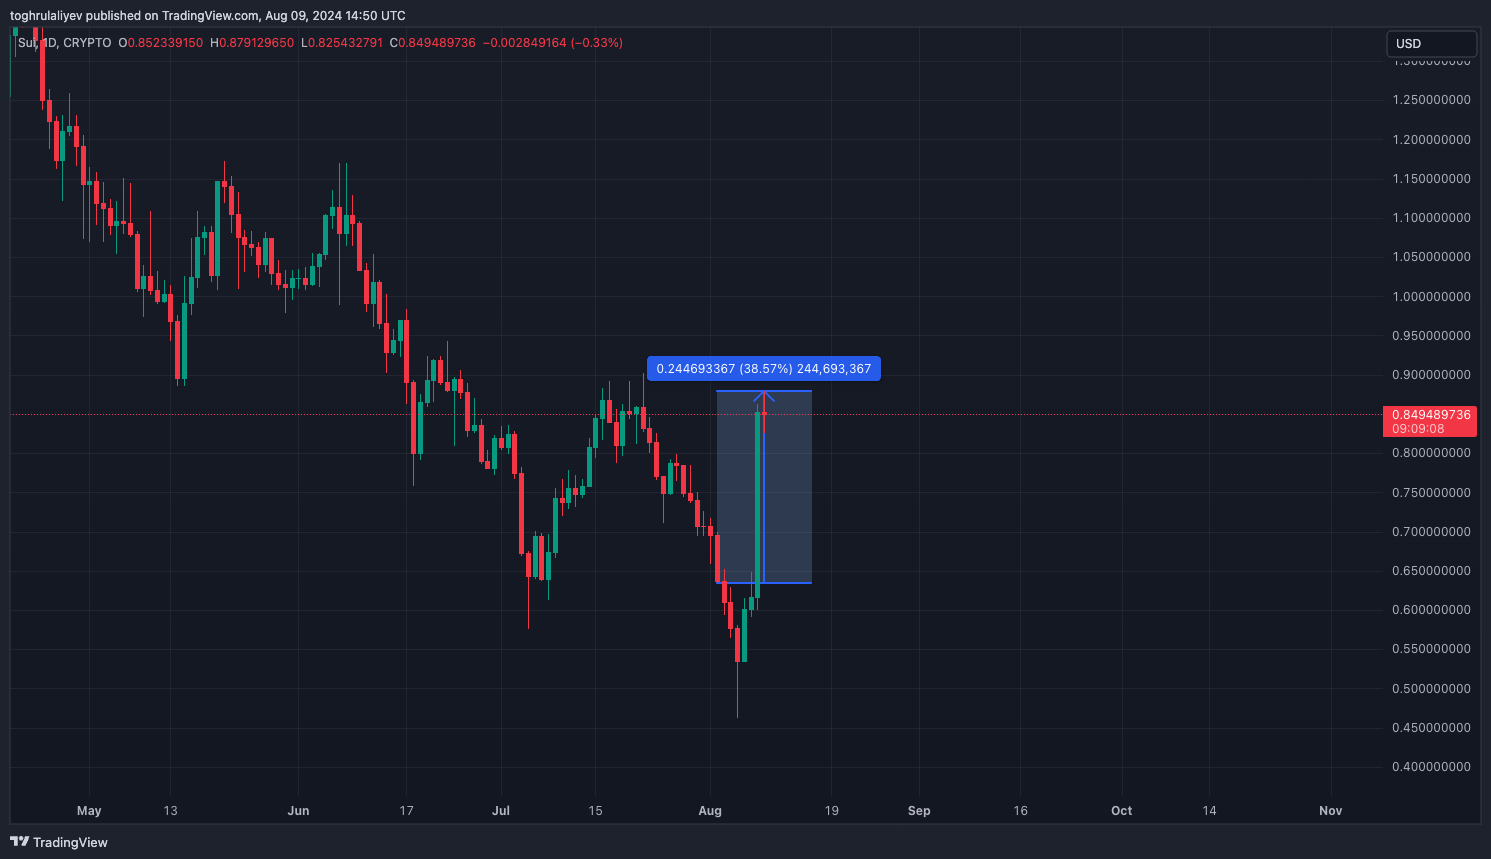
Sui has surged by 38.57% since last Friday due to positive market developments and major news. Grayscale Investments launched two new crypto investment trusts, one including Sui, which boosted investor interest.
Additionally, macroeconomic factors, such as the market’s recovery from a recent Yen rate hike and a selling spree by Jump Trading, contributed to Sui’s rise (SUI). These factors have led to a strong rally, raising the question of whether Sui can sustain this momentum or if a pullback might occur.
Supply dynamics
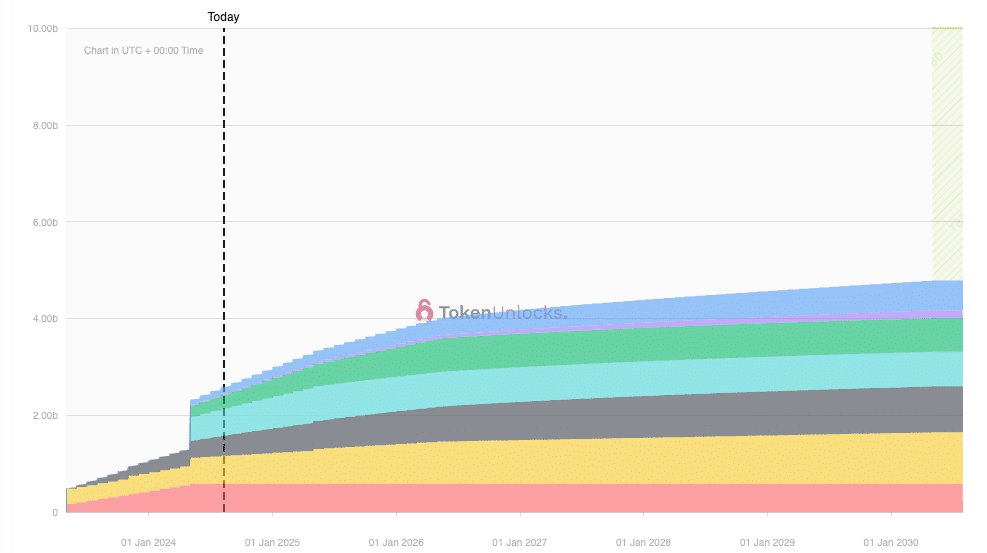
Sui has a high inflation rate, with its supply rising rapidly. This is particularly relevant as token unlocks can lead to downward pressure on the price. Fortunately, the upcoming unlock, which accounts for 2% of the total supply, is still 22 days away. Traders planning to exit before this event may not need to worry about its immediate impact.
Downtrend and parallel channel
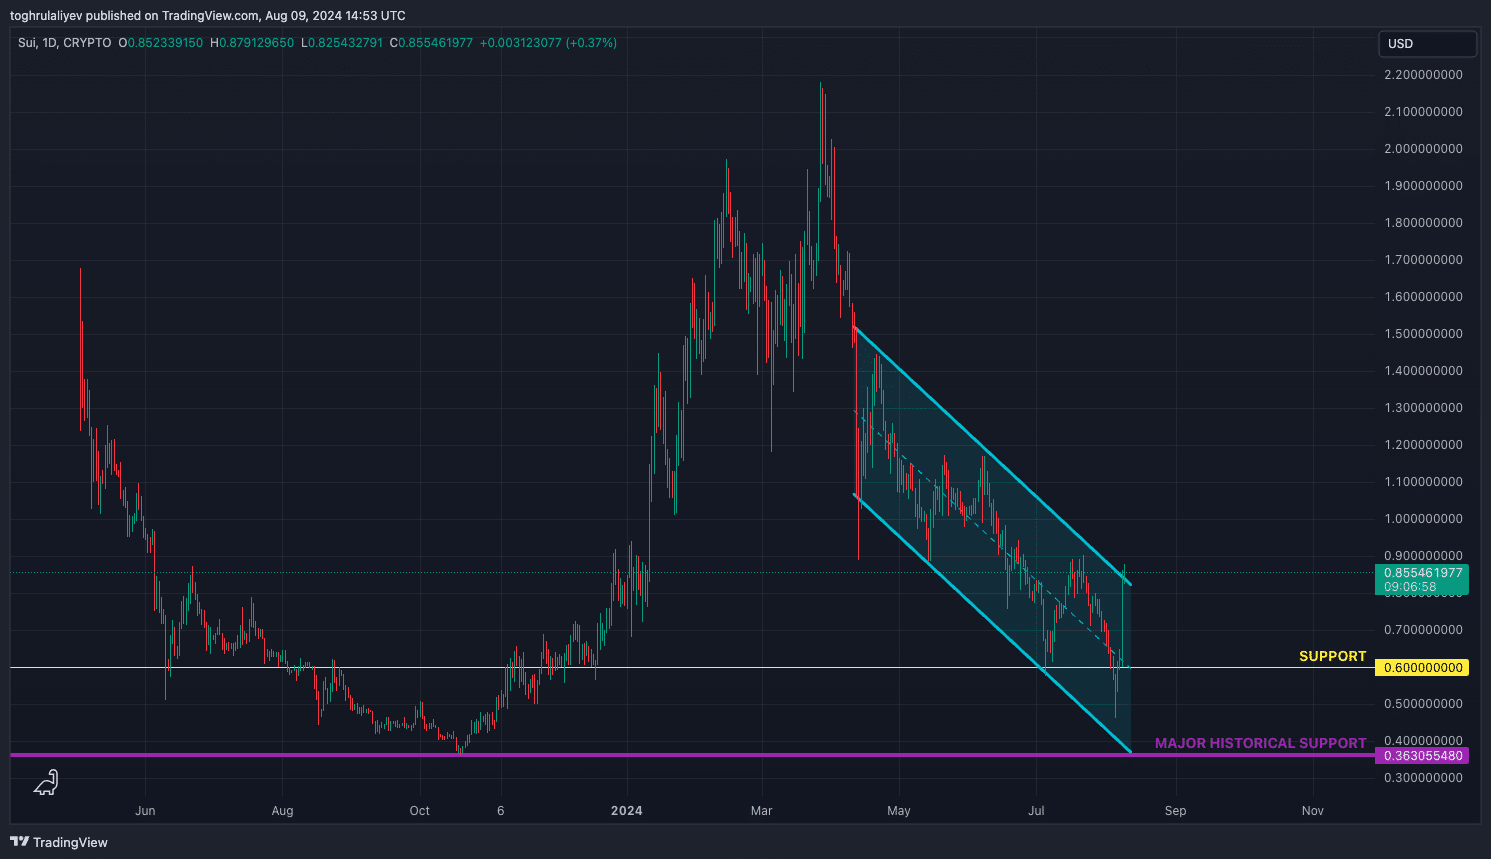
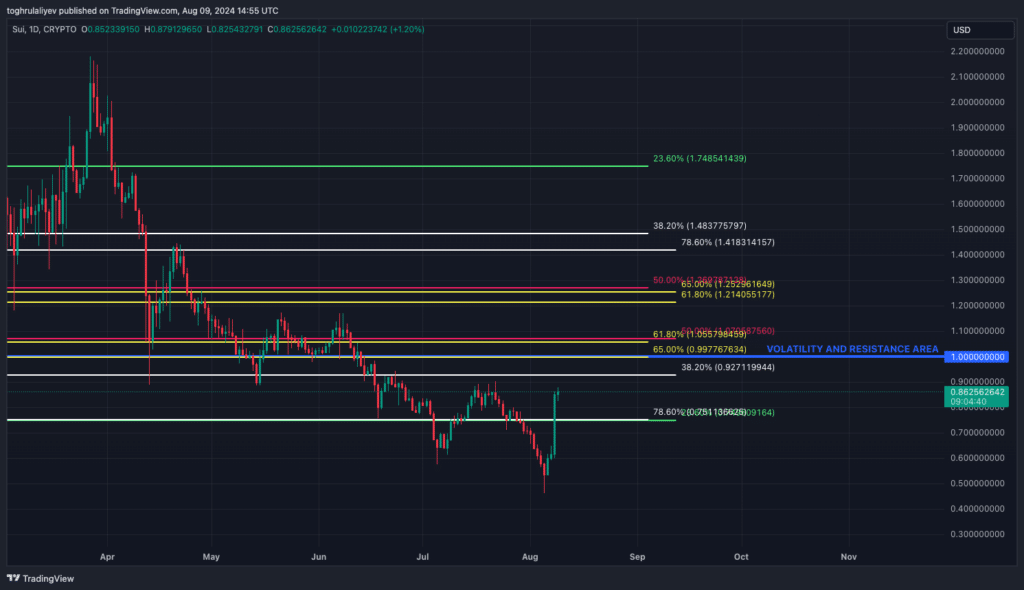
Since late March, Sui has been stuck in a pronounced downtrend, shedding over 61% of its value. From mid-April, the price action formed a parallel channel, which has acted as both support and resistance, containing the price movement within its bounds. At present, Sui is trading near the upper boundary of this channel, where it encounters resistance. A critical support level to watch lies around $0.60, where the midline of the channel coincides with previous historical support.
Fibonacci retracements
Applying Fibonacci retracement from the March high to the August low, we pinpoint a key resistance level at $0.8681. The level also coincides with the upper boundary of the parallel channel and has historically acted as both support and resistance.
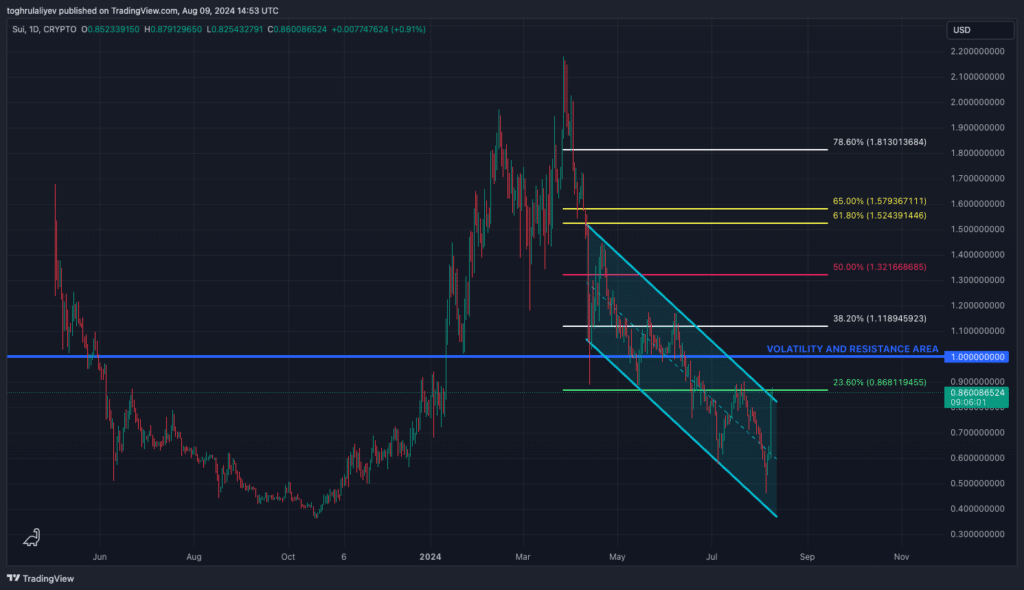
Additionally, a convergence of two macro Fibonacci retracements occurs at $0.75: the 78.6% retracement from Sui’s October 2023 low to its March 2024 high and the 23.6% retracement from its initial trading price in May 2023 to August 2024 low. Moreover, the $1 level, which has proven to be a major resistance and volatility zone, aligns with a golden pocket from the latter Fibonacci retracement.
Strategic considerations
Bullish scenario. Should SUI break out above the $0.8681 resistance level and hold above it on a retest, this could trigger a long entry. Key profit-taking targets would then be at $0.9271 and $1.00, where the next major resistance lies.
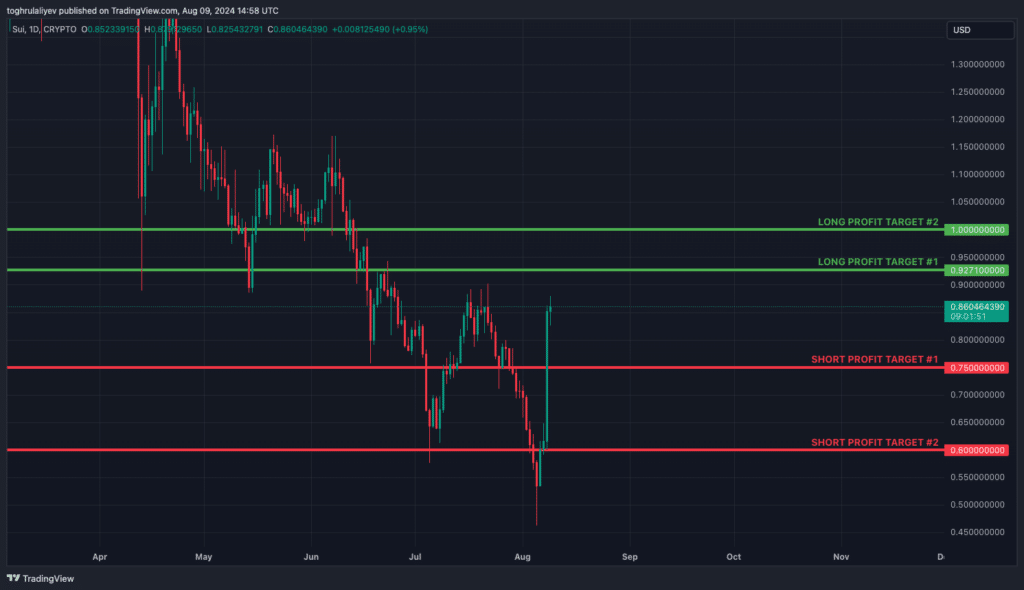
Bearish scenario: Despite the recent bounce in the market, the current rally may be overextended, which suggests a potential pullback. The unresolved yen carry trade situation and historically bearish seasonality in August add downside risk. If SUI fails to clear the $0.8681 resistance and instead faces rejection at this level, this would be a signal to short. Targets are $0.75 and $0.60.
Disclosure: This article does not represent investment advice. The content and materials featured on this page are for educational purposes only.


