

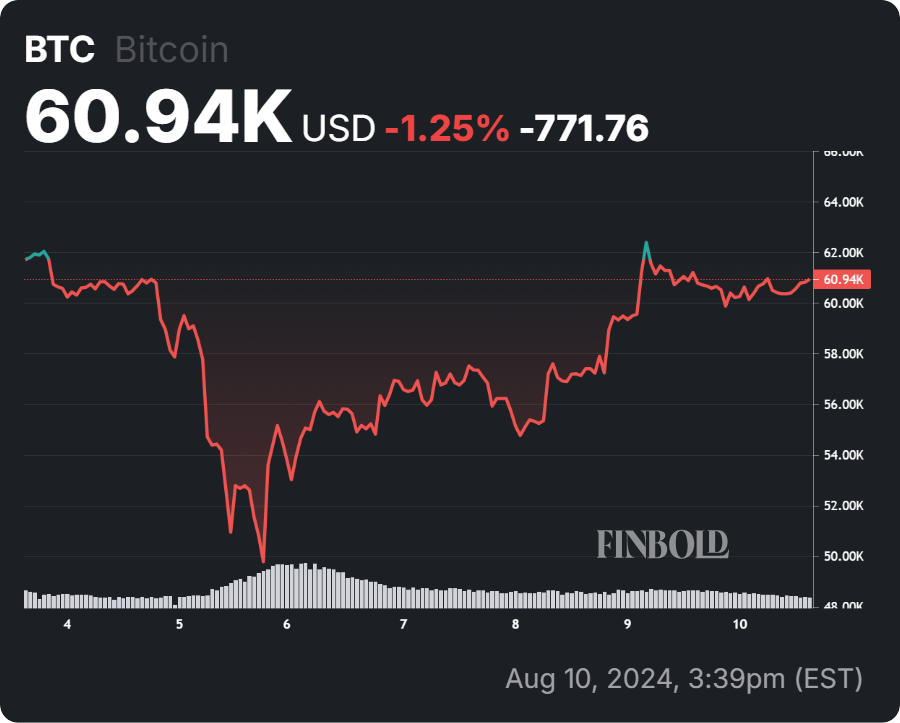
After undergoing a period of consolidation, the price of Bitcoin (BTC) is showing signs of a recovery.
On August 9, a prominent crypto trading expert, TradingShot, shared a Bitcoin price forecast on TradingView, leveraging the ‘Golden Ratio’ correlation. This powerful signal, derived from the relationship between Bitcoin and the Gold/Russell 2000 (GOLD/RUT) ratio, has historically been a reliable predictor of Bitcoin’s parabolic rallies.
The ‘Golden Ratio’ correlation and its historical significance
According to the analysis, the chart pattern is beginning to unfold again, suggesting that a substantial upward movement could be imminent.
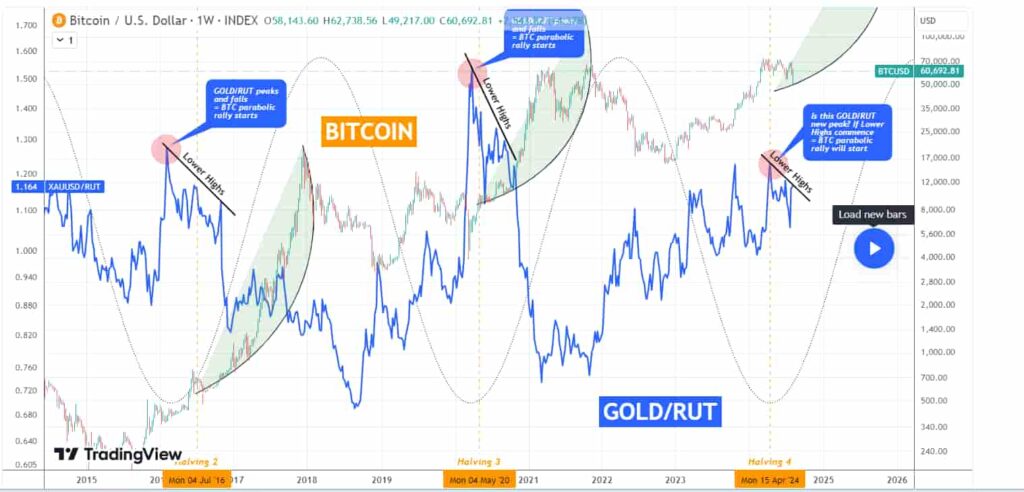
The pattern highlights a significant correlation between Bitcoin’s price movements and the GOLD/RUT ratio, which measures the relationship between Gold and the Russell 2000 Index.
Historically, when the GOLD/RUT ratio peaks and subsequently begins to form Lower Highs, Bitcoin tends to enter a parabolic rally. This cyclical pattern suggests that the GOLD/RUT ratio serves as a leading indicator for Bitcoin’s price trajectory, with each decline in the ratio potentially signaling the start of a strong upward move in BTC.
After the 2016 halving, Bitcoin began a significant upward move that culminated in the 2017 bull market, where prices reached an all-time high of nearly $20,000.
Similarly, the 2020 halving was followed by an even more dramatic rally, propelling Bitcoin to its previous all-time high of approximately $68,000 in late 2021.
These patterns show the potential for another major rally if the current cycle follows the established historical precedent.
Current market analysis and future projections
According to the latest data, the GOLD/RUT ratio may have peaked in April 2024. If the ratio now begins to form Lower Highs, as it has done in previous cycles, Bitcoin may soon enter the most aggressive phase of its bull cycle, characterized by a steep and rapid price increase.
Since Bitcoin’s parabolic rally could be imminent, a reasonable short-term target would be $80,000 to $85,000. This range is just above the previous all-time high of $73,000 and aligns with the expected steep rise during the aggressive phase of the bull cycle.
In the long term, if the parabolic rally gains significant momentum, Bitcoin could potentially reach $100,000 to $120,000 during this cycle. This target is based on the historical magnitude of Bitcoin’s price movements during previous parabolic phases, especially following halving events.
Bitcoin price analysis
At the moment, Bitcoin is trading at $60,637, having rallied about 0.02% in the last 24 hours.
If Bitcoin follows the pattern indicated by the chart, the next major price target could range from $80,000 to $120,000. However, this projection relies on the GOLD/RUT ratio continuing to form lower highs, signaling the beginning of Bitcoin’s next parabolic move.
Given the current situation, Bitcoin is expected to reclaim the $70,000 resistance level, potentially paving the way for a new all-time high. However, it’s crucial to remember that past performance is not indicative of future performance, and the cryptocurrency market is highly volatile.
Investors should remain vigilant and consider market conditions and other external factors that could influence Bitcoin’s price trajectory.
Disclaimer: The content on this site should not be considered investment advice. Investing is speculative. When investing, your capital is at risk

