

Bitcoin’s recent rally could be setting the stage for a downturn, as several indicators suggest. The recent distribution of BTC from Mt. Gox, coupled with the German government’s large-scale sell-off, initially dampened Bitcoin’s price but led to a temporary recovery. However, metrics such as the Net Unrealized Profit/Loss and Stochastic RSI are signaling potential declines ahead. The article examines how these factors might affect Bitcoin’s future movements.
Mt. Gox distributions and German government sell-offs
July and August brought a cascade of bad news for Bitcoin (BTC). The month began with the turmoil initiated by the German government’s large-scale BTC liquidation and the commencement of Mt. Gox’s distribution process.
The initial wave of selling from Germany triggered a downtrend in Bitcoin’s price, which reached a low of $53,542 on July 5.
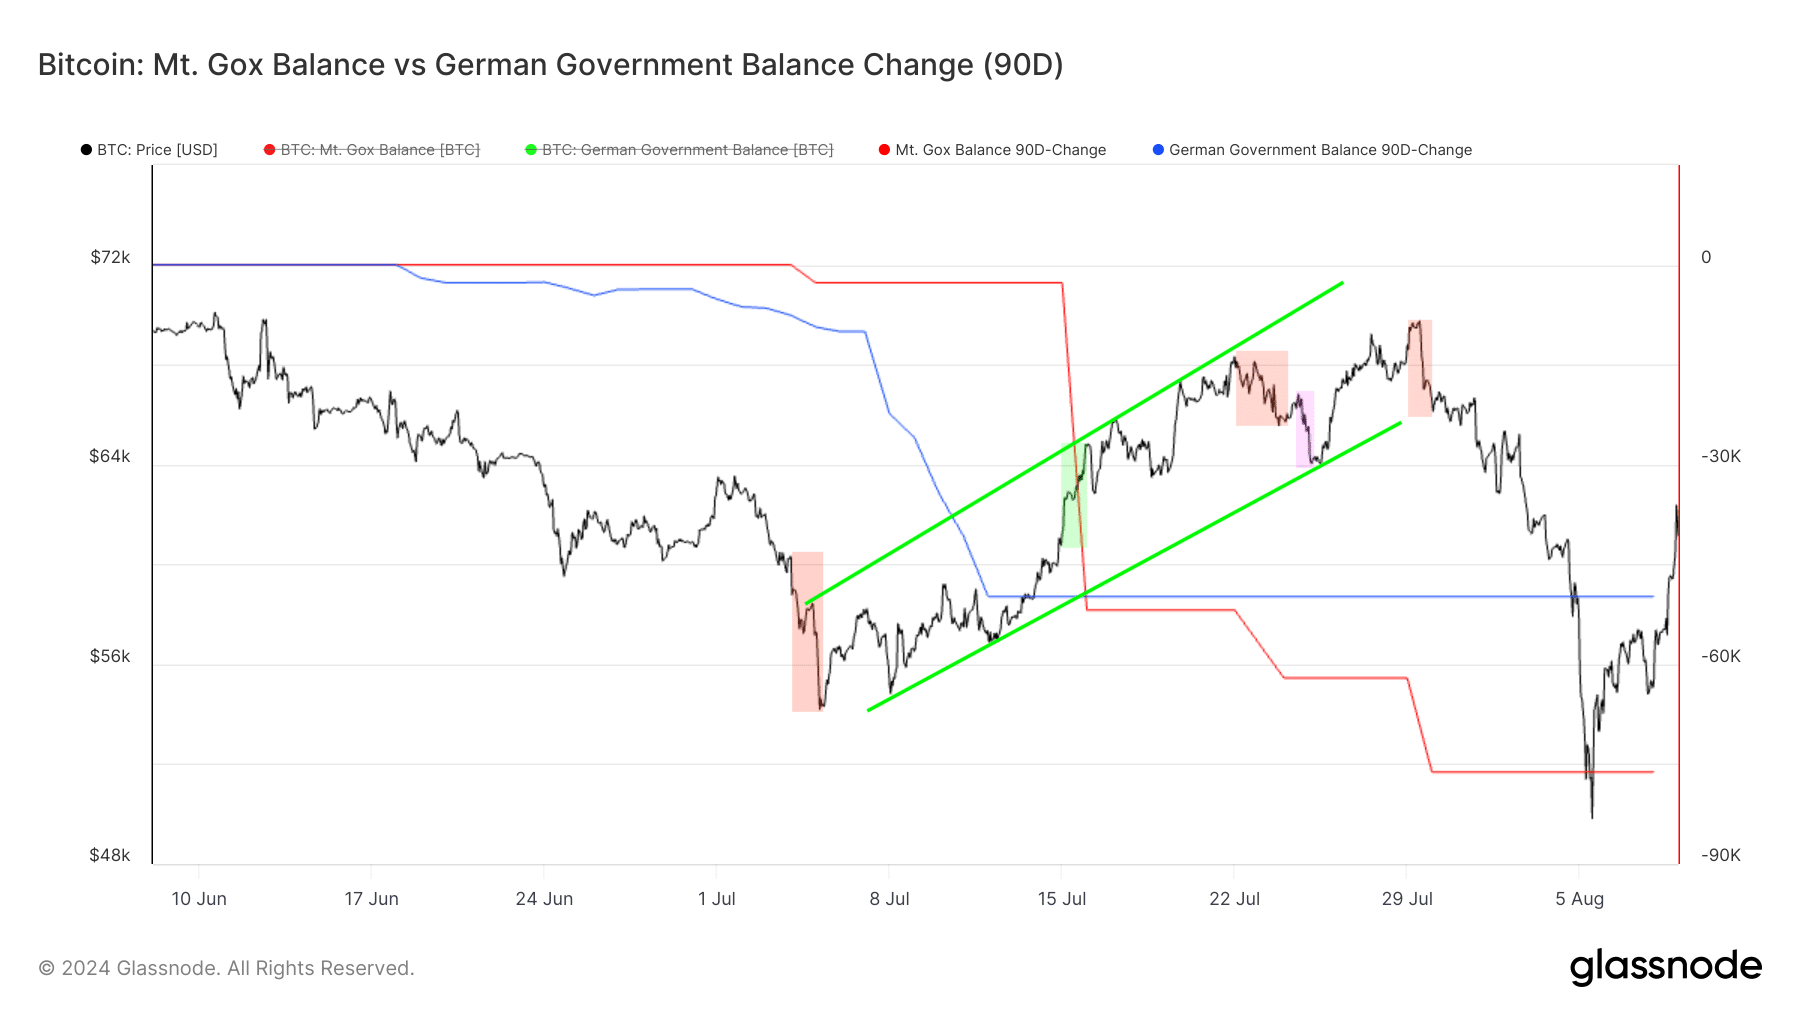
The decline was further intensified when Mt. Gox released 2,701 BTC. By then, Germany had already offloaded 9,332 BTC during its selling spree. After July 5, Bitcoin’s market began to recover, even though Germany sold another 59,190 BTC. By July 12, the price had climbed to $57,889, marking an over 8% recovery.
The recovery shows that after the initial selling pressure eased, Bitcoin became more appealing to investors. The market’s ability to absorb the government’s selling pressure hinted at a growing demand. Later, news that Germany had sold all the BTC held in its wallets led to further price appreciation.
Even the larger Mt. Gox movement of 49,079 BTC failed to halt the upward trend, which saw a 26% increase from the July 5 low. Although subsequent distributions from Mt. Gox did create short-lived dips in the market, they did not stop the overall recovery.
The psychological factor likely played a big role here. Those receiving BTC from Mt. Gox had not been holding the cryptocurrency over the years by choice; they simply had no access to it until the recent distributions. Over time, many may have realized that keeping BTC could be more beneficial than selling it right away. The mindset shift likely came from Bitcoin’s past price highs in 2017, 2021, and even 2024. If they had had their BTC during those peaks, many might have sold their holdings. Instead, the forced delay unintentionally positioned them as long-term holders, which worked to their advantage. The perspective is supported by the market’s reaction to the distributions. The minor 4% drop observed after Kraken and Bitstamp began their distributions on July 24 was quickly absorbed, indicating that the selling pressure from these recipients was relatively low.
The pattern suggests that future distributions of the remaining 65,476 BTC from Mt. Gox are unlikely to cause significant market disruptions. Any potential disruptions are expected to be quickly absorbed by the market, as most recipients are likely to hold rather than sell their assets.
Entity-Adjusted Dormancy Flow as a predictor of Bitcoin market bottoms
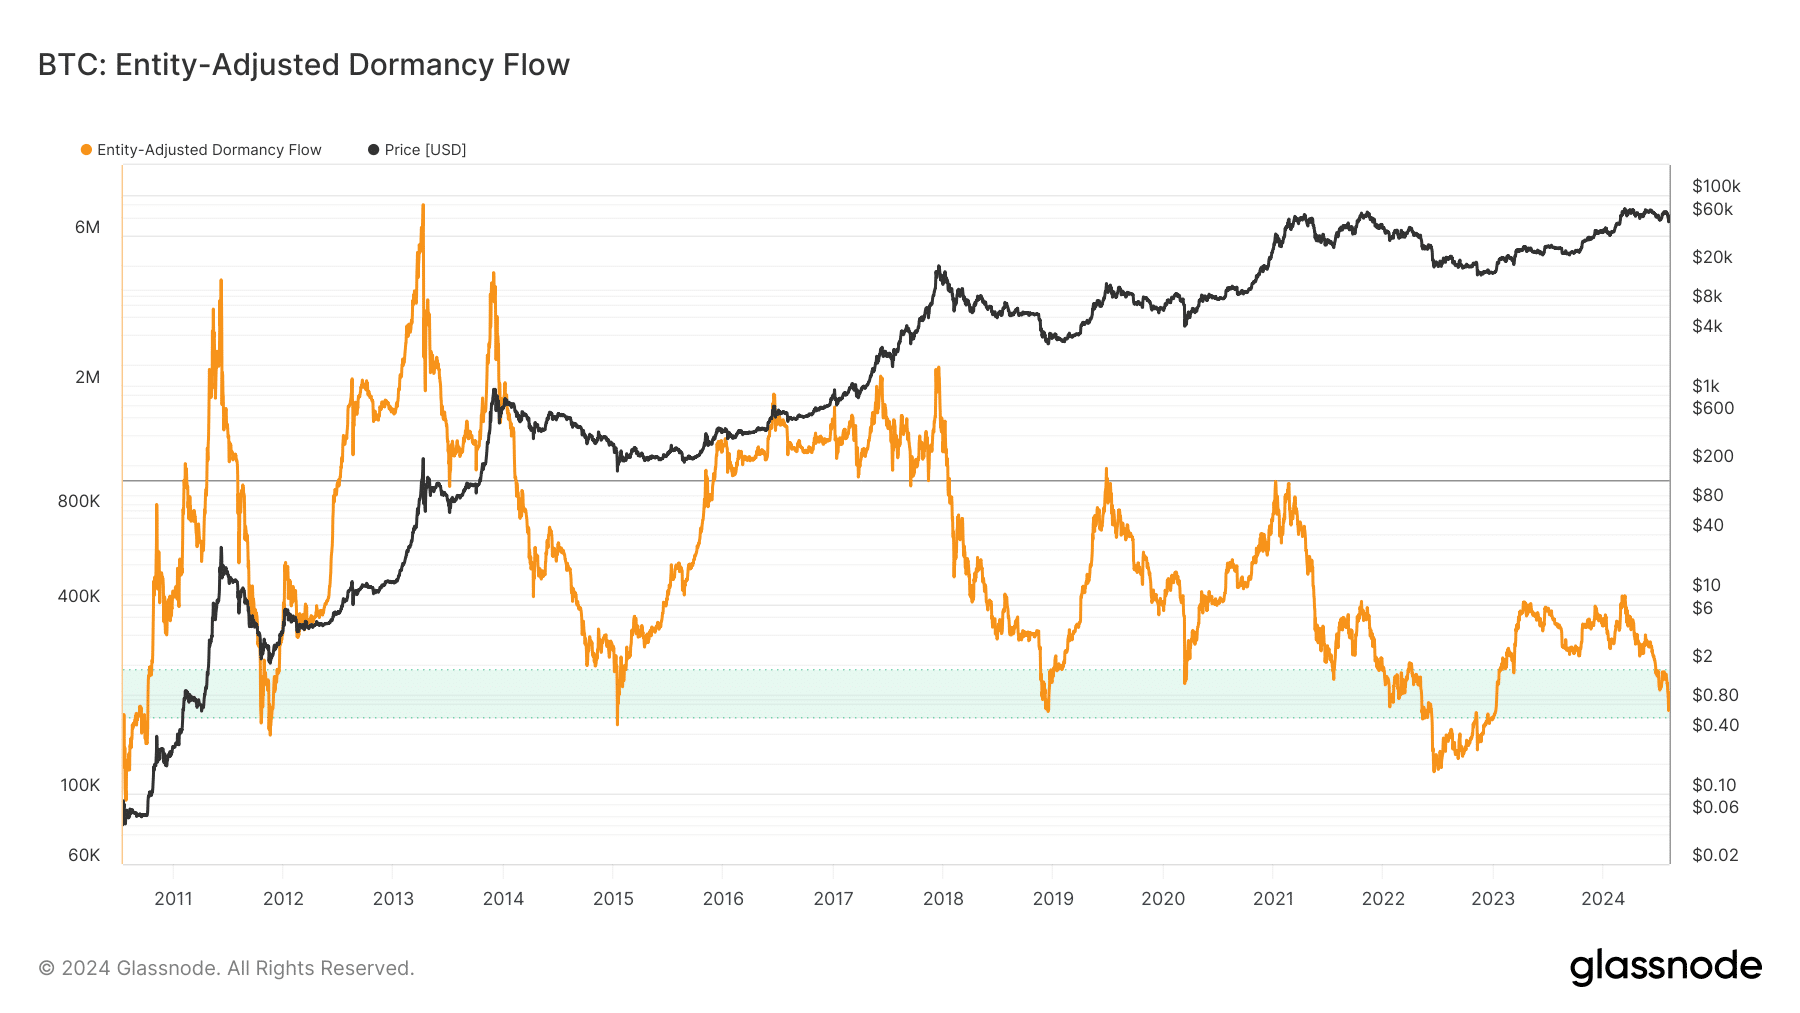
Entity-Adjusted Dormancy Flow (EADF) measures the ratio between the current market capitalization and the annualized dormancy value. Dormancy value is the average number of days that each BTC remains dormant (held without being moved) multiplied by the amount of BTC moved on that day and then converted into USD. The metric provides insight into the behavior of long-term holders by indicating how much “older” Bitcoin is being spent or moved in the market.
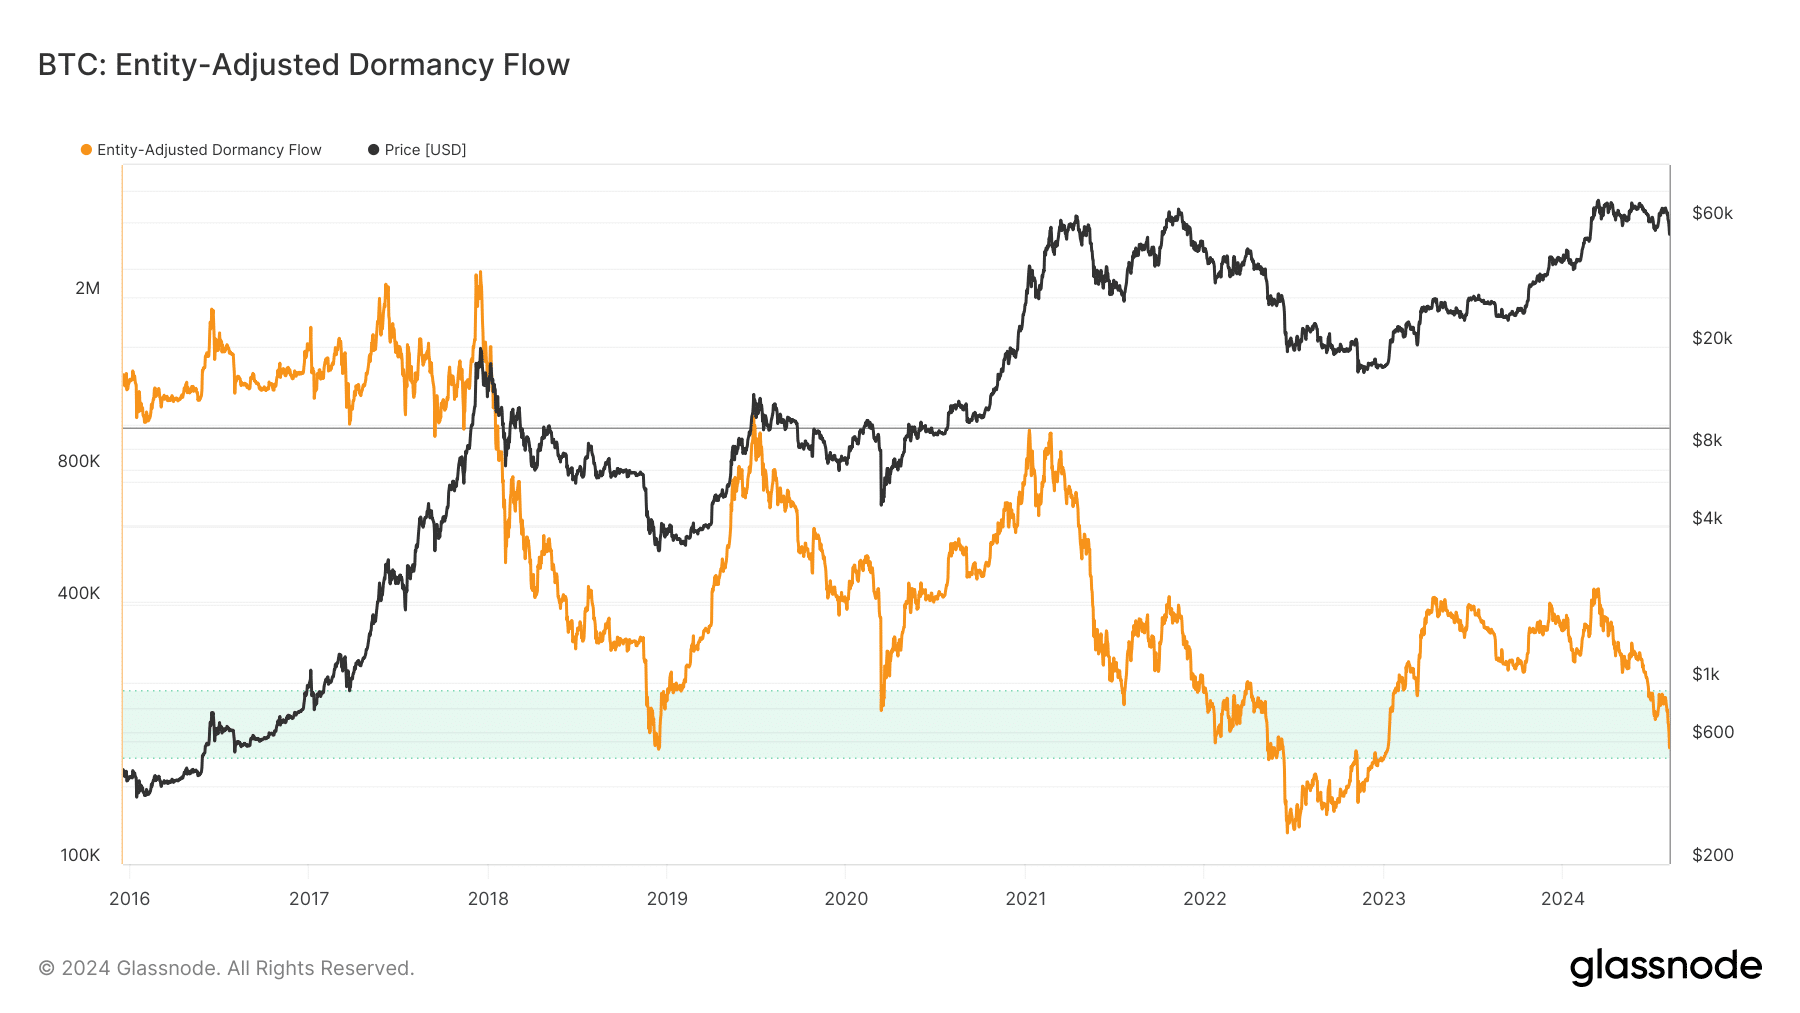
This tool has proven indispensable in timing market lows and assessing whether the Bitcoin market remains within typical parameters during a bullish trend or is shifting toward a bearish phase.
Each time EADF drops into the green zone, between $170 and $250, it signals a market low. The lower band, especially around $170, has consistently predicted Bitcoin’s price bottoms with good accuracy. Recently, on August 5, EADF hit a low of $184, which, based on past data, likely indicates Bitcoin has reached its bottom. The following upward movement of EADF suggests the start of a recovery phase, which, if patterns hold, could lead to an appreciation of Bitcoin’s price in the near future.
Net Unrealized Profit/Loss as a predictor of Bitcoin market tops
Net Unrealized Profit/Loss (NUPL) is a metric that reflects the overall sentiment of Bitcoin holders by quantifying the difference between the total amount of Bitcoin that is in profit (relative unrealized profit) and the total amount of Bitcoin that is at a loss (unrealized loss). NUPL, therefore, represents the net result of these two figures, indicating whether the market, on average, is in a state of profit or loss.
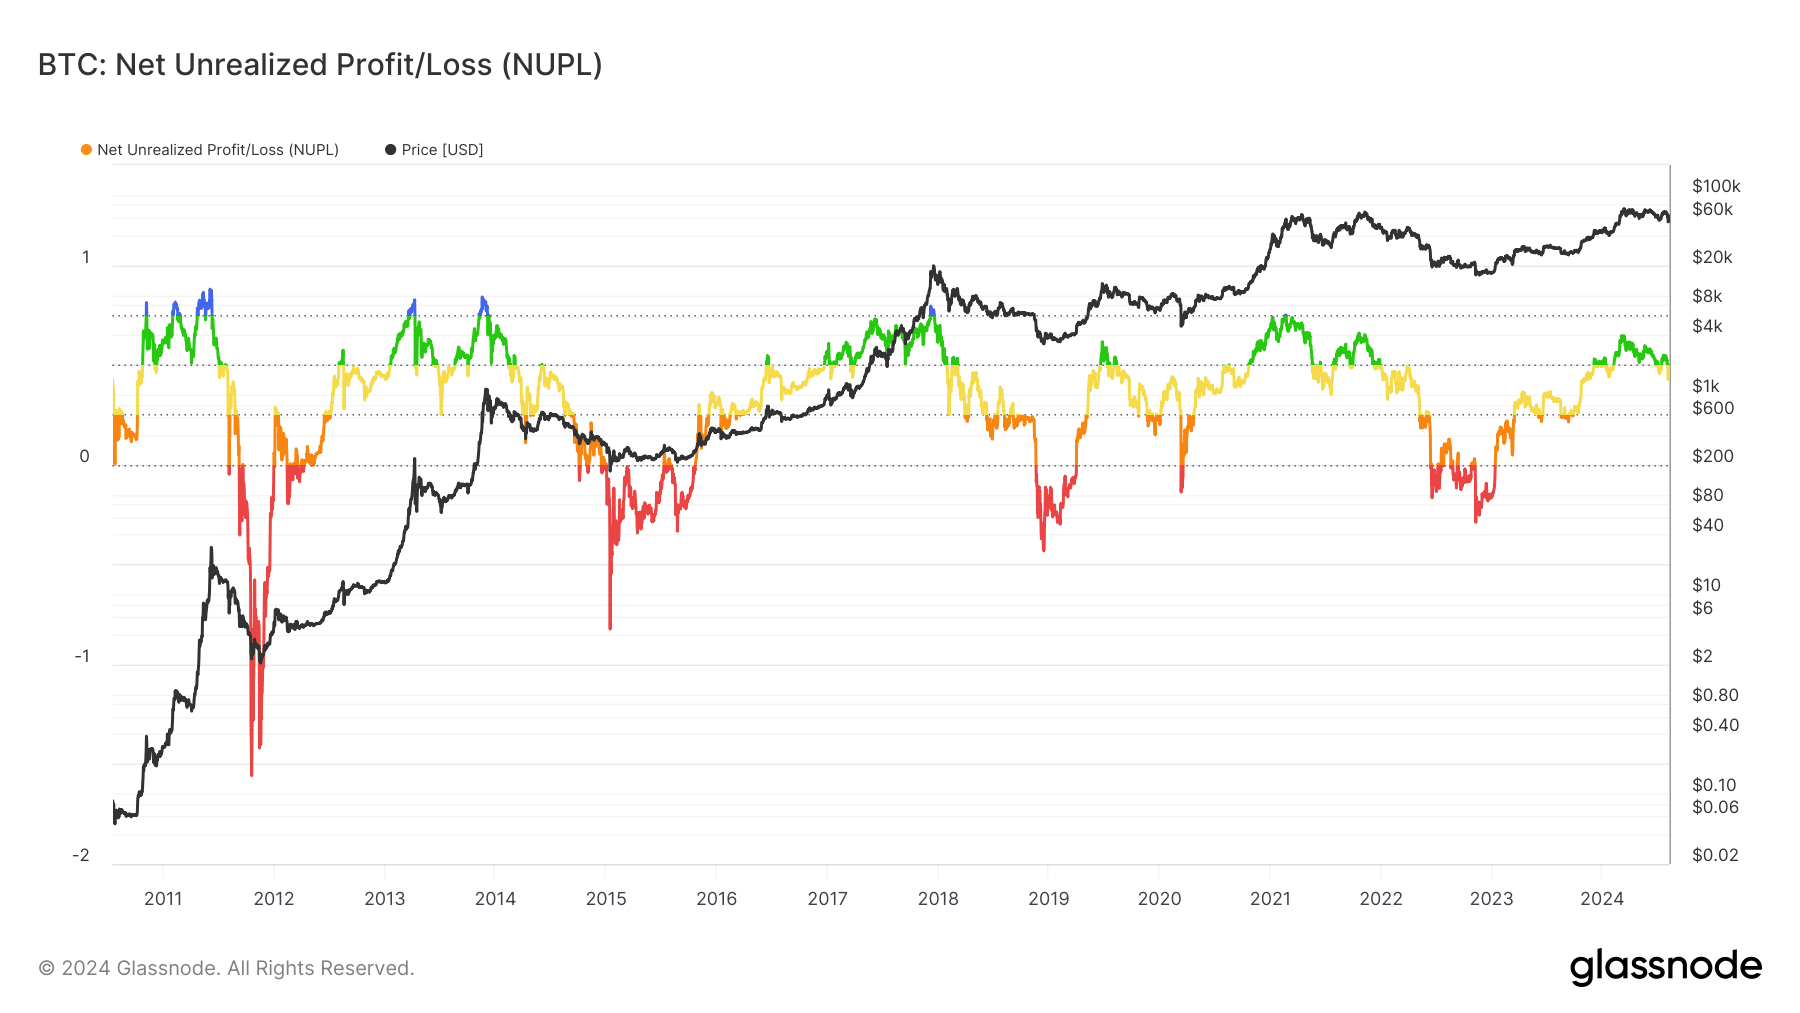
Historically, every time NUPL has risen above 0.4, it has signaled that Bitcoin may be entering a phase of overvaluation. However, this does not necessarily mean that Bitcoin’s price will immediately start to decline. Previously, from 2010-2011, 2013-2014, 2017-2018, and 2020-2021, NUPL remained above the 0.4 threshold for extended periods—sometimes nearly a year—before eventually dropping below it, marking the end of a bullish phase.
Given the current market conditions, it is possible that Bitcoin may stay in the NUPL zone above 0.4, occasionally dipping barely below it, until a market top is reached, which could occur around 2025. However, a closer resemblance might be drawn to the scenario in 2019.
During that year, NUPL reached 0.4 in June and remained at that level until August, after which it began to decline. A key factor influencing this was the Federal Reserve’s decision to lower interest rates starting on July 31. The rate cut, coupled with the subsequent halt in further cuts or hikes, may have contributed to the decline in NUPL and the corresponding downtrend in Bitcoin’s price.
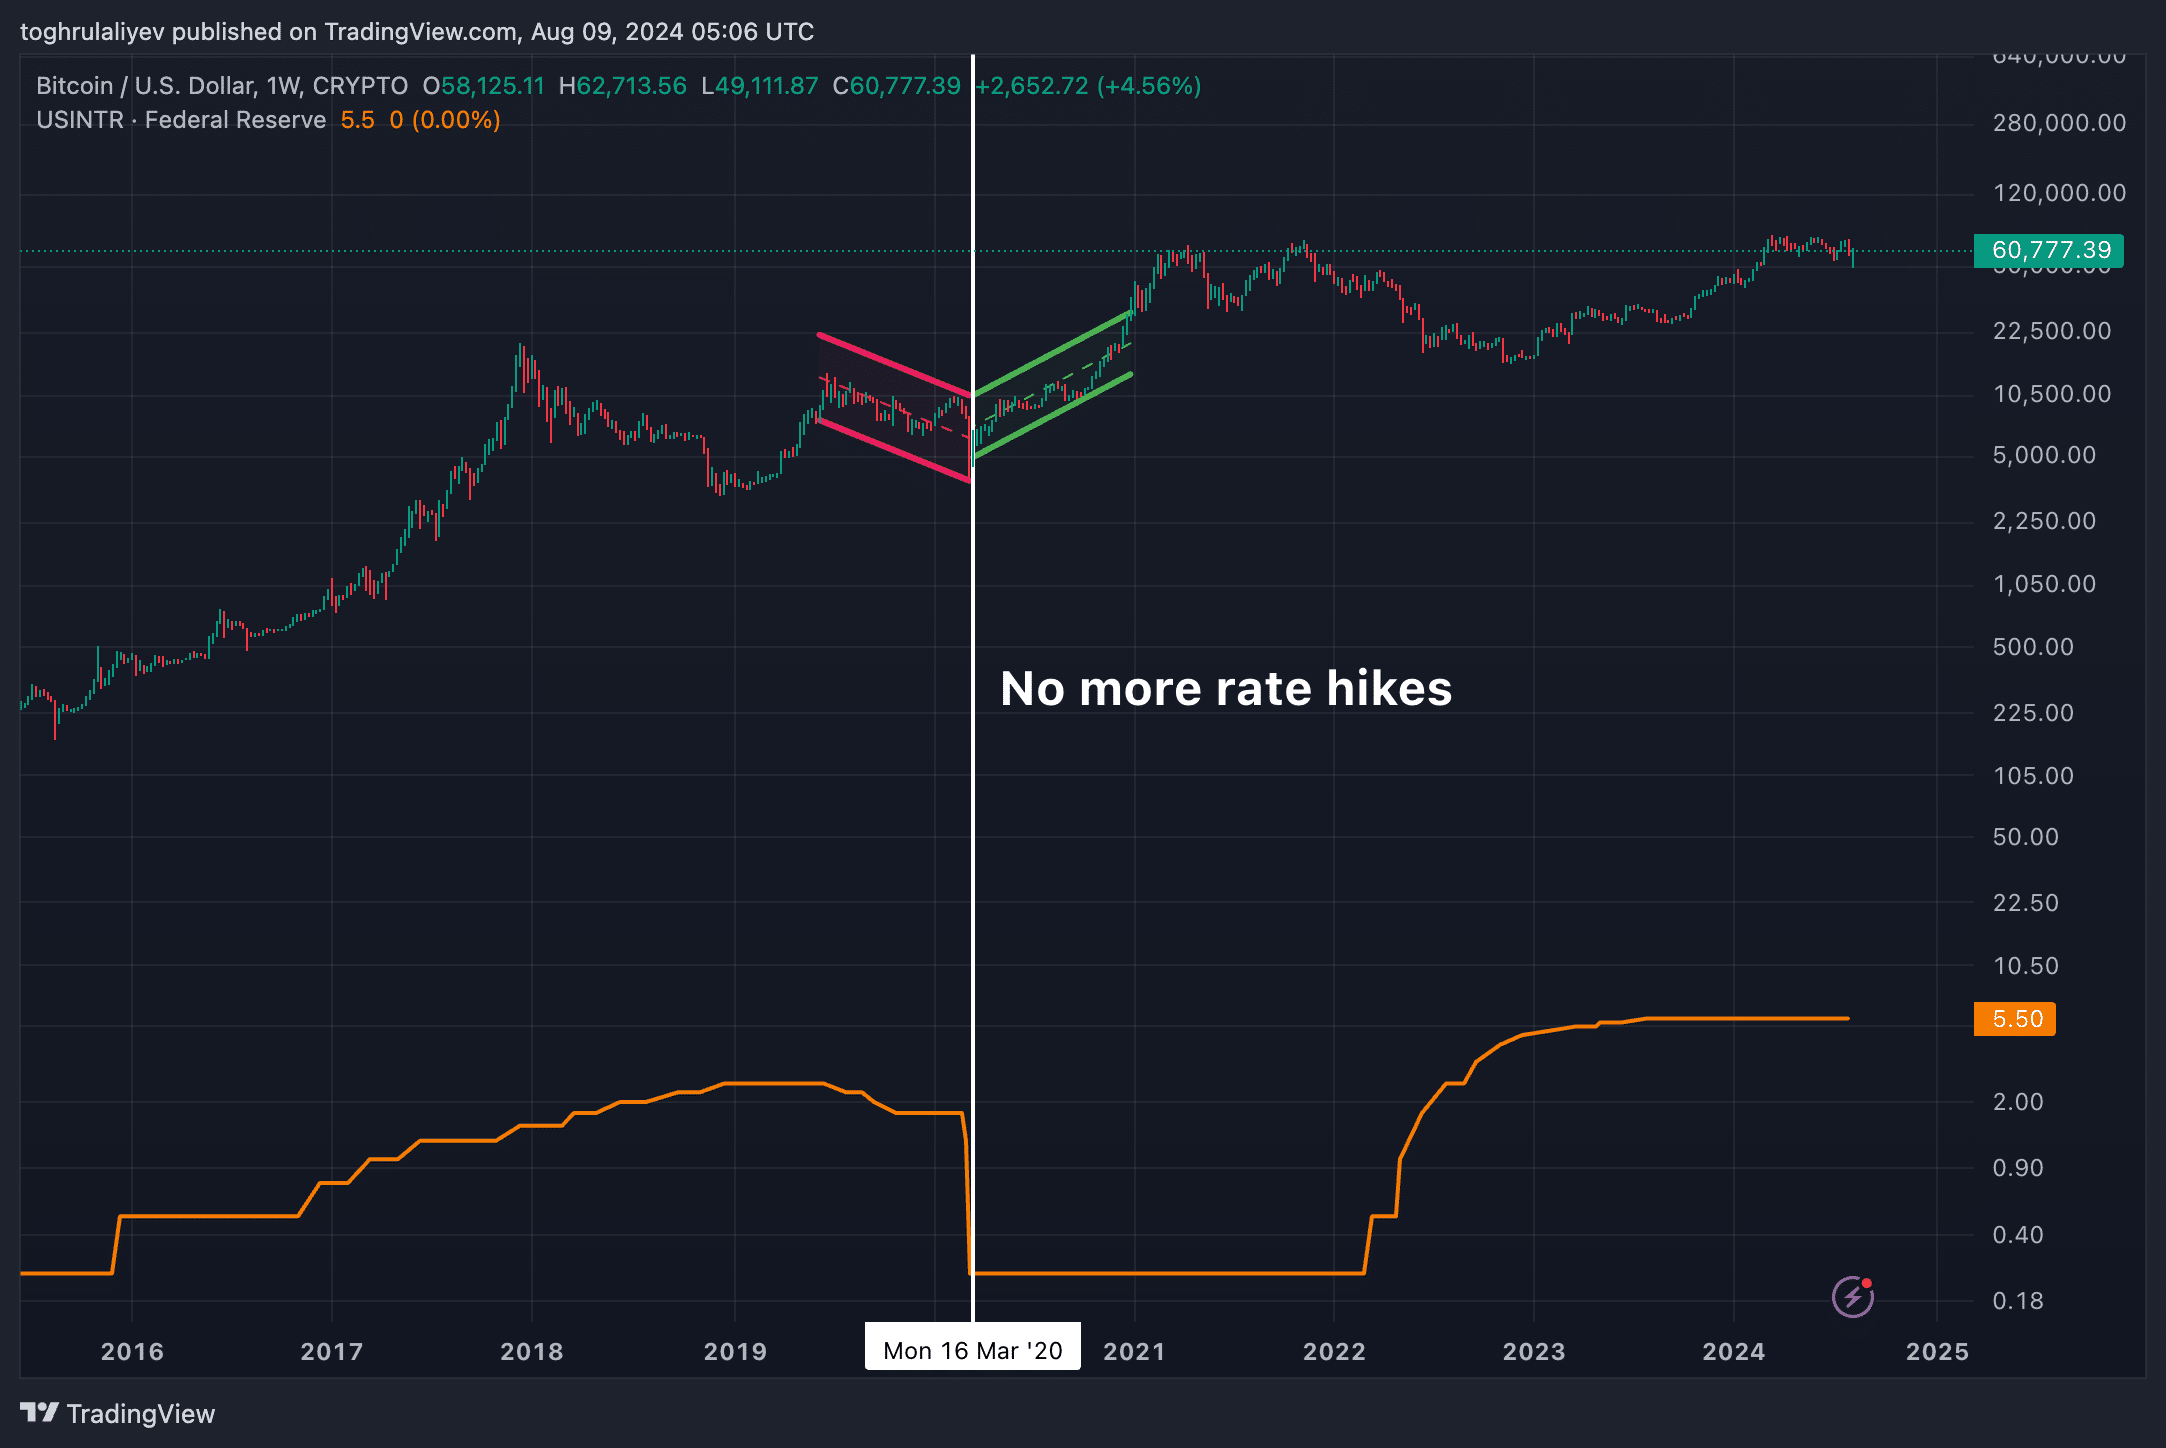
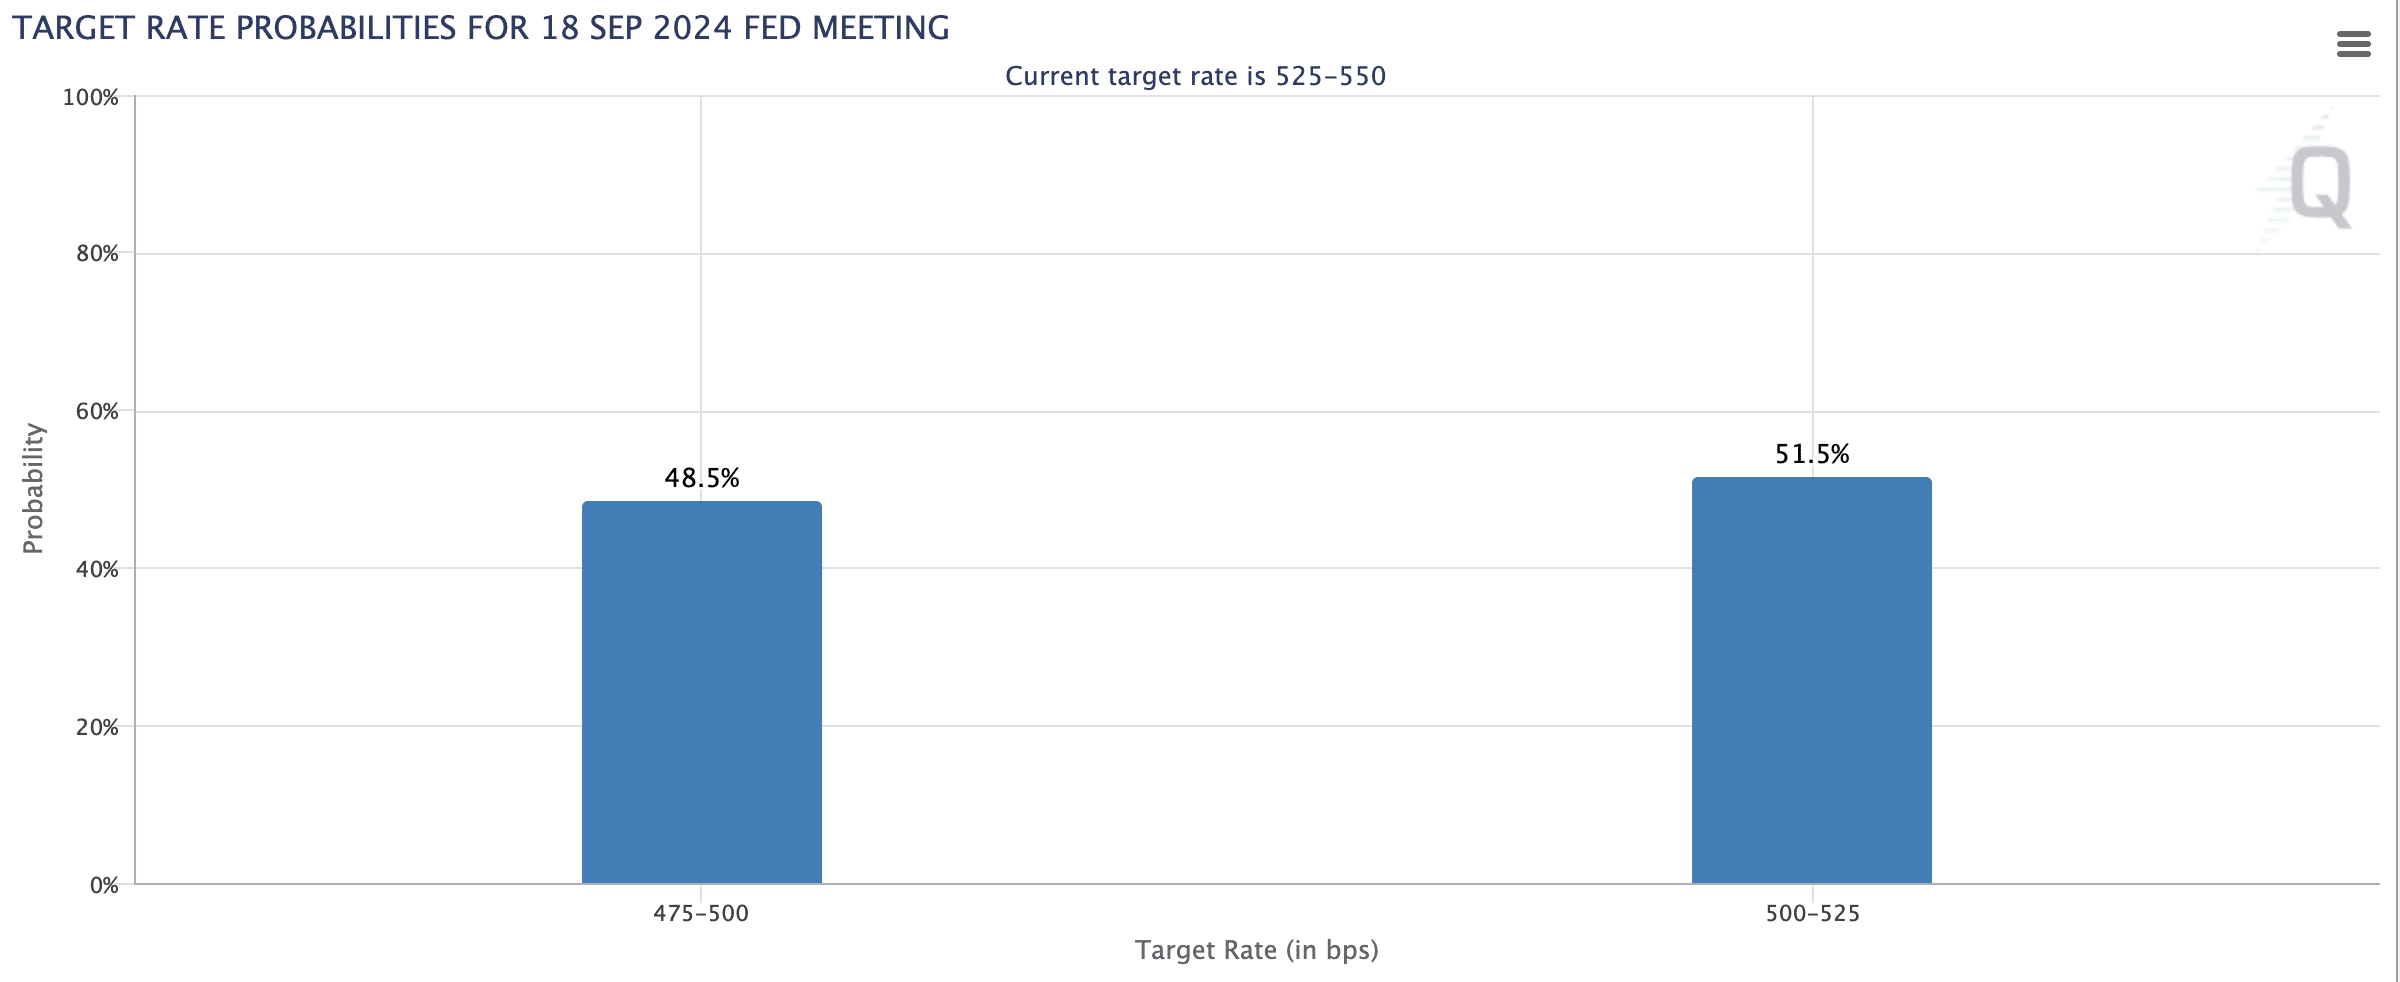
By March 2020, NUPL had dropped below 0, coinciding with the onset of the COVID-19 pandemic and the Federal Reserve’s decision to stop adjusting rates for a prolonged period. Once the Federal Reserve ceased cutting rates, both Bitcoin’s price and NUPL reversed their downward trends and began to rise again. With the Federal Reserve expected to cut rates in September, a similar pattern to 2019 might occur, possibly leading to a decline in Bitcoin’s price.
Stochastic Relative Strength Index patterns in Bitcoin market cycles
Stochastic Relative Strength Index (Stoch RSI) is a momentum indicator that traders use to assess the potential direction of an asset’s price by comparing the current closing price to its price range over a specific period. It is an oscillator that measures the level of the RSI relative to its high-low range over a set period rather than comparing price levels. This makes it more sensitive to recent price changes and provides information about potential overbought or oversold conditions.
The Stoch RSI oscillates between 0 and 1, with readings above 0.8 typically indicating overbought conditions and readings below 0.2 indicating oversold conditions. However, rather than just looking at whether the indicator is overbought or oversold, a more nuanced approach involves examining the behavior of the Stoch RSI as it breaches these levels.
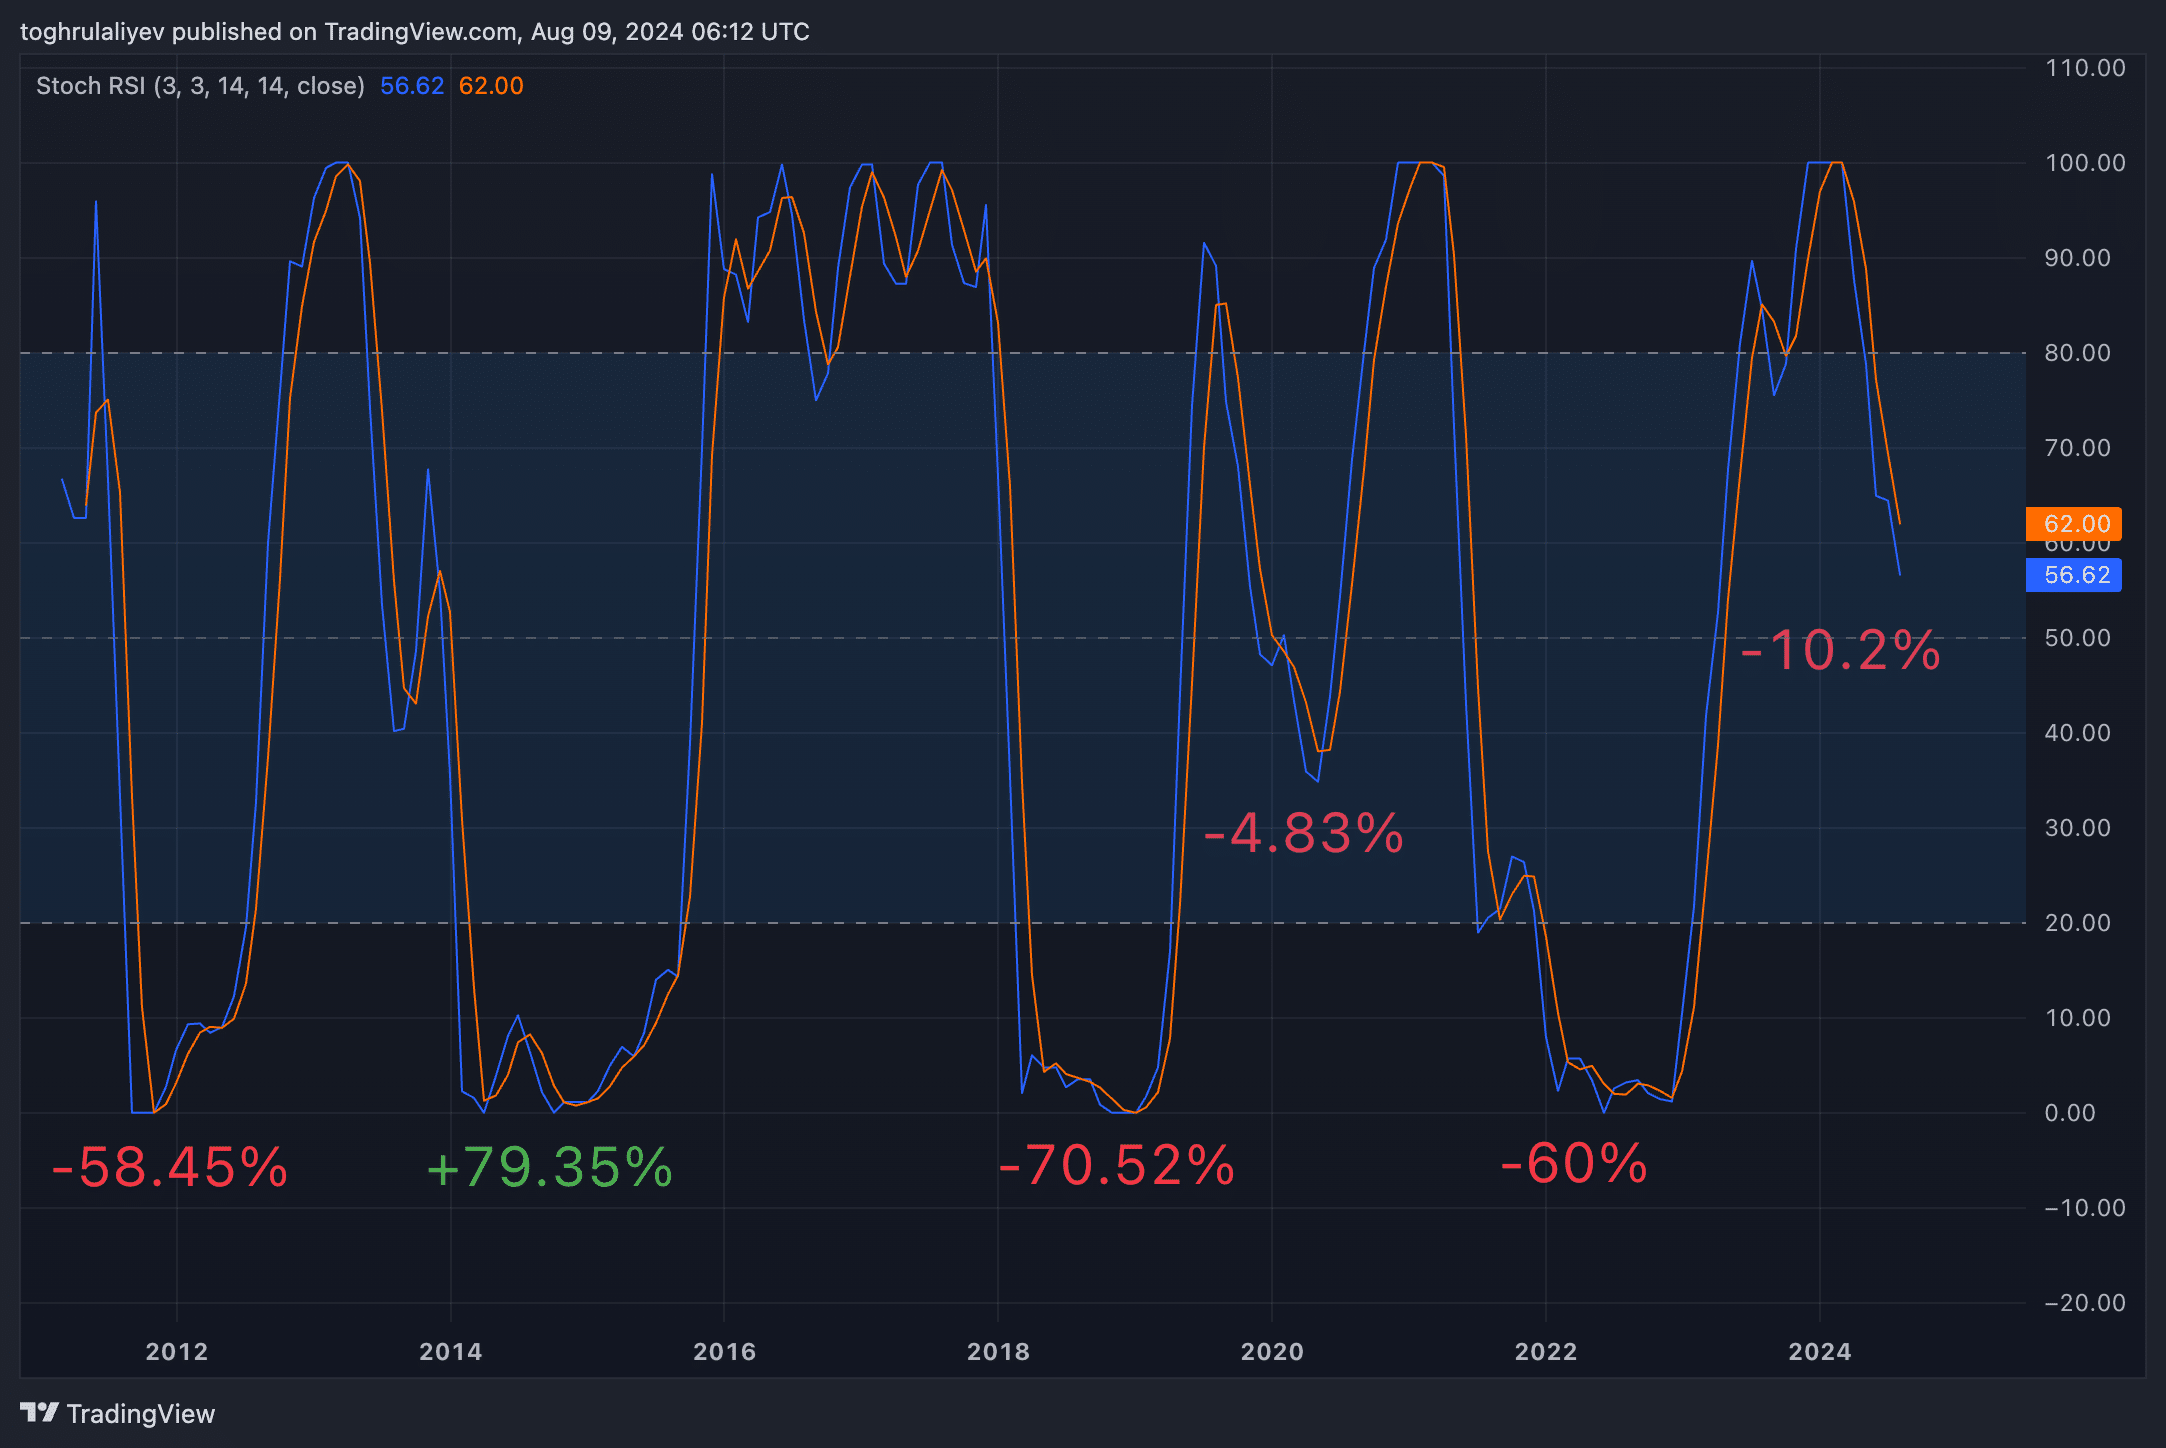
Historically, when the BTC’s Stoch RSI has breached its upper band (downward trend), then fallen below the lower band (oversold), and later breached the lower band again on its way upward, Bitcoin’s price has typically experienced a decline. On average, from the open price on the day of the first breach below the upper band to the open price on the day of the first upward breach of the lower band, Bitcoin has seen a decline of -22.89%.
This method is preferred because it avoids the pitfalls of false signals. Simply relying on the Stoch RSI topping or bottoming can be misleading, as the indicator might give false bottoms where it briefly rises before dropping again. By waiting for the sequence of breaches—first of the upper band, then the lower band, and finally the upward breach of the lower band—the analysis achieves a higher success rate, albeit at the cost of potentially being late to the trend.
However, if the anomaly of the 2014-2015 period is excluded, the average drawdown is significantly steeper, around -48.45%. For simplicity, this figure can be rounded to a 50% average drawdown.
Currently, examining the monthly view, Bitcoin has declined by -10.2% from the open prices, which indicates that if the historical trend holds, the price could drop further to around $36,000 this year. Nonetheless, there is an alternative scenario similar to what occurred during the last halving cycle in 2020.
In 2020, the Stoch RSI did not breach the lower band but instead showed a pattern where it breached the upper band, then the middle band, and finally breached the middle band again on its way up. If this pattern repeats, Bitcoin might stabilize around $58,000 to $60,000—a level it is currently hovering around. If this scenario plays out, it could mark the last significant bottom for Bitcoin before the next major bull run, much like what happened after the 2020 halving.
Conclusion
In light of the current indicators, Bitcoin faces a challenging road ahead. With three out of four key metrics signaling bearish trends, the potential for further price declines seems strong. While the dormancy flow indicator remains within its typical range, history shows that it can dip below the lower band, suggesting that downside risks are still present. As a result, our outlook remains cautious, and we expect Bitcoin to stay below $60,000 until at least late September or October.
Disclosure: This article does not represent investment advice. The content and materials featured on this page are for educational purposes only.


