

Amid a slow period for the price performance of Bitcoin (BTC), which has been struggling to pull itself above the psychologically critical level of $60,000, cryptocurrency analyst Ali Martinez believes it might happen very soon, placing the next target for the maiden crypto asset at $64,000.
Specifically, Martinez has noticed similarities in price movements between Toncoin (TON), the native token of decentralized layer-1 blockchain The Open Network, and Bitcoin, with the former possibly “leading the way” for the latter, according to his X post on August 14.
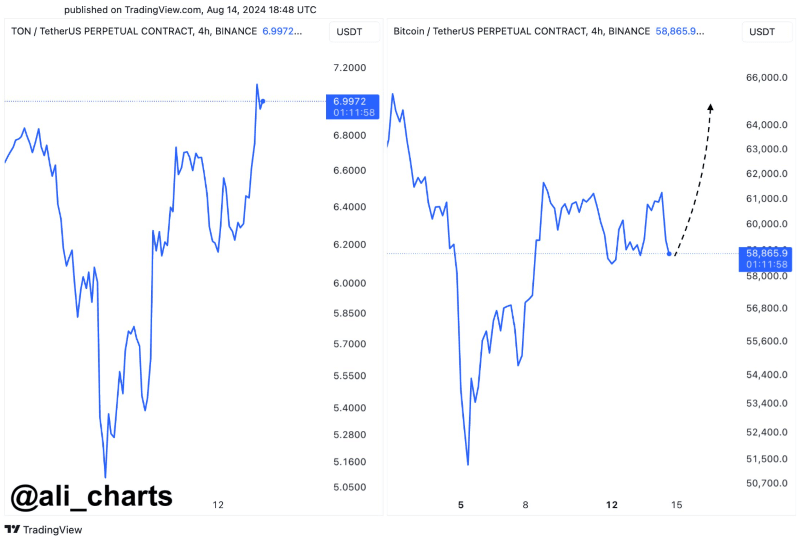
Indeed, Bitcoin’s current price performance remarkably mimics that of TON, which is currently changing hands at the price of $6.63, down 6.88% in the last 24 hours, but still recording an increase of 6.89% on its weekly chart, reducing its monthly losses to 10.85%.
Should Bitcoin actually follow TON in this manner, the crypto trading expert has argued that the flaghip decentralized finance (DeFi) asset could begin a parabolic movement in the next several days, which would see it hit the price target of $64,000, as well as continue upwards during the weekend.
What others say
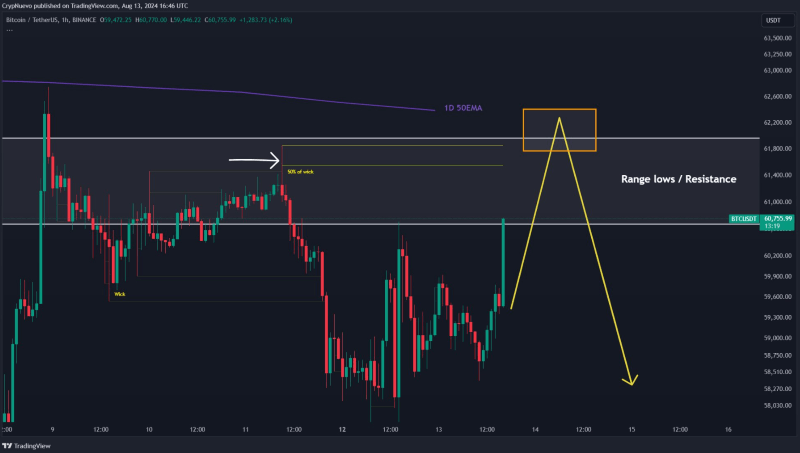
Meanwhile, pseudonymous crypto market analyst CrypNuevo recently observed that Bitcoin was making a key wick in the one-hour timeframe within a resistance zone, arguing that this wick could serve as a magnet for upside liquidity, expecting to see $62,000 and a bull trap outside of this zone.
On the other hand, the expert has also warned that a rejection of the key resistance between $61,800 and $62,200 could drive the largest asset in the crypto industry by market capitalization all the way down $58,000 before bouncing back up, as Finbold reported on August 14.
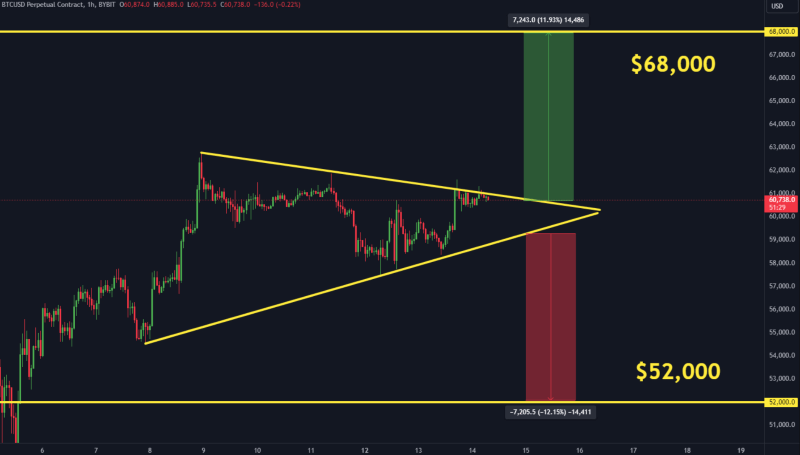
At the same time, a crypto analyst under the pseudonym The Moon has presented both a bearish and bullish scenario, setting a price target at $52,000 for the former and as high as $68,000 for the latter, depending on the direction of its breakout from a large symmetrical triangle pattern on the one-hour chart.
Bitcoin price analysis
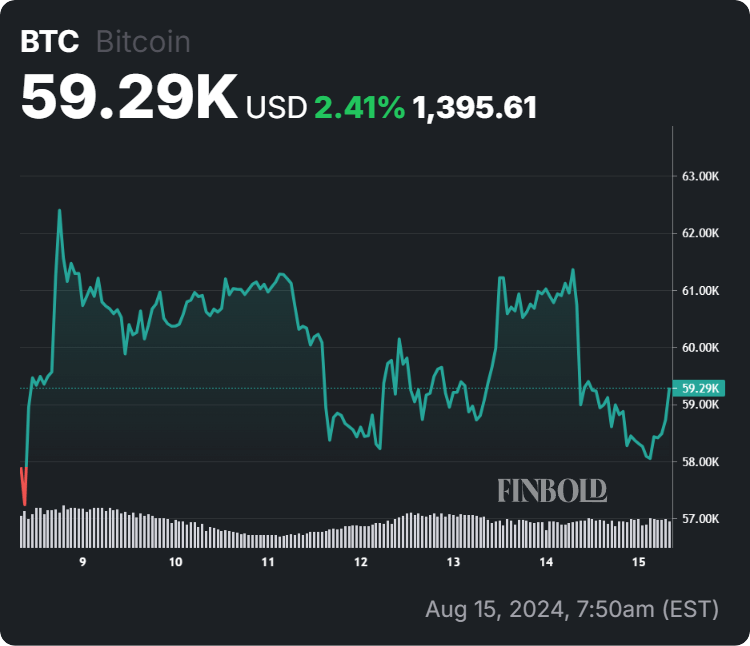
For now, Bitcoin is trading at the price of $59,290, reflecting a 3.41% drop on the day but advancing 2.41% across the past week, reducing to 7.75% the losses it accumulated in the last month, according to the most recent chart data retrieved by Finbold on August 15.
All things considered, analysts are on the fence regarding the price of Bitcoin in the near future, trying to find clues as to where and when it might end up, including taking hints from other assets. However, regardless of their conclusions, trends can easily change, so doing one’s own research is critical.
Disclaimer: The content on this site should not be considered investment advice. Investing is speculative. When investing, your capital is at risk.


