

Bitcoin might be up 20% after flash crashing and breaching $50,000 in early August. However, the coin remains within a tight range while there is excitement.
Looking at the events in the daily chart, Bitcoin is now moving between $57,000 and $63,000, stuck in a sideways movement even though traders are upbeat and expect prices to rise in the coming days.
Bitcoin Consolidates, But Addresses Are Stacking
As prices consolidate horizontally and bulls struggle to breach $63,000 and register fresh highers, on-chain data points to strength and confidence. While the stagnation has led to the formation of a tight and even dull range, Glassnode notes that players are accumulating.
Looking at the Glassnode Accumulation Trend Score (ATS) for Bitcoin, the figure recently rose to 1.0, the maximum reading. This development means there has been a strong shift back to accumulation, with large entities, mostly institutions and whales, steadily accumulating and taking advantage of the current low prices.
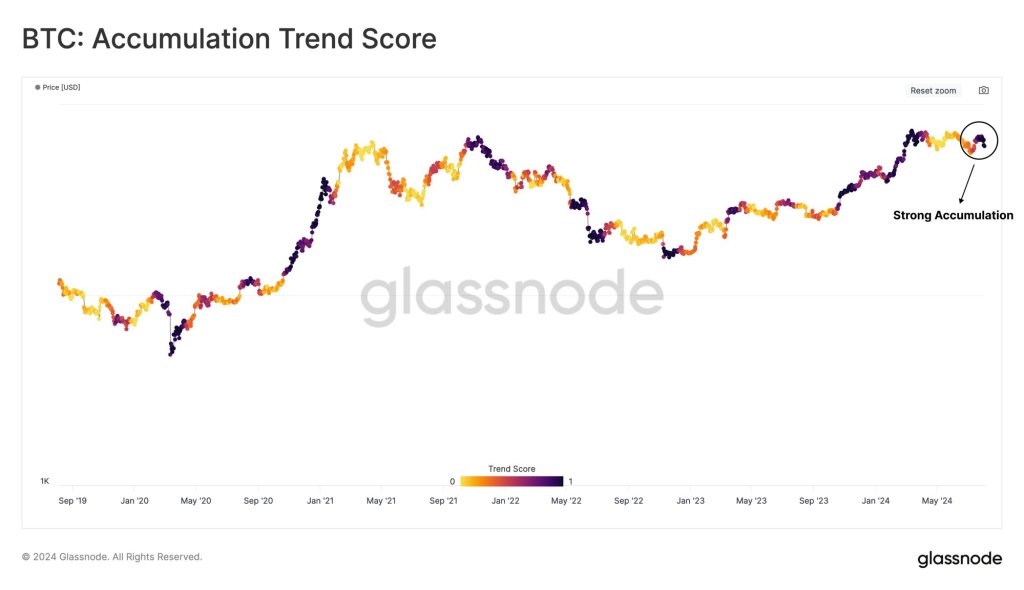
Earlier, the ATS revealed widespread distribution, which impacted prices. Most importantly, when this occurred after prices peaked in March, there was a deluge of supply across all wallets.
BTC holders were more keen to unload and take profit. This trend is reversing, especially as seen by addresses controlled by spot Bitcoin ETFs.
BTC HODLers In As Speculators Flushed: What’s Next?
According to Glassnode, the entry of HODLers and large entities is a huge boost of confidence since they are positive about what lies ahead. This interest shows that over 300,000 BTC have been added to long-term holders (LTHs) over the last three months.
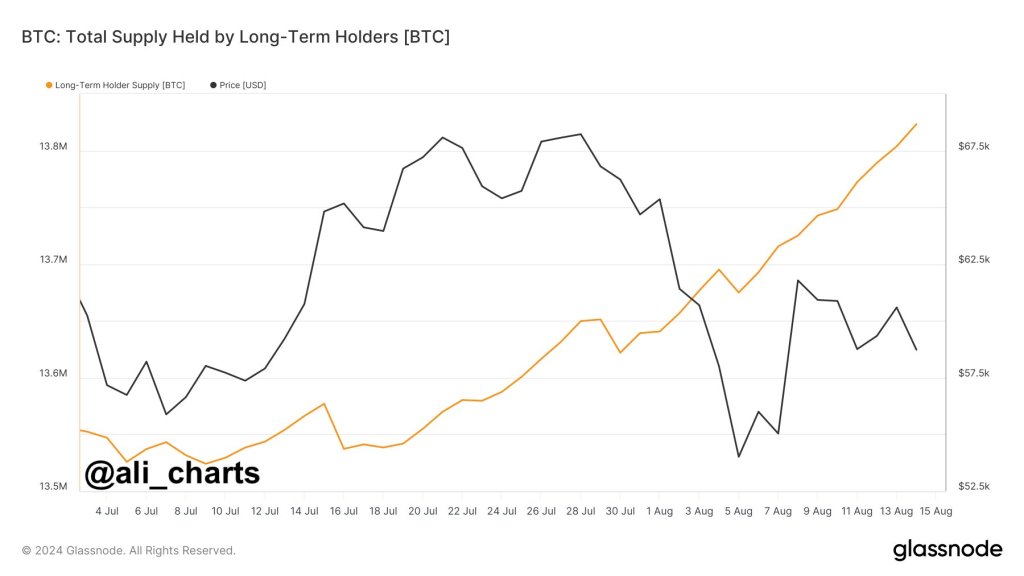
Moreover, as this prints out, one analyst observes that the long/short-term holder ratio is up 8.7% over the last month. This increment shows that LTHs hold more BTC.
Amid this, the demand among short-term holders (or addresses that bought within the last 155 days) has been fizzling. As STH activity decreases, it translates to more stable price action, allowing LTHs to double.

For now, traders have to wait for clean signals. Though aggressive traders might buy the dip, the more conservative might want to wait for a clean break above $63,000 before committing. Any surge might lift prices to the multi-month resistance zone between $70,000 and $72,000.
Feature image from Canva, chart from TradingView


