

Disclaimer: The opinions expressed by our writers are their own and do not represent the views of U.Today. The financial and market information provided on U.Today is intended for informational purposes only. U.Today is not liable for any financial losses incurred while trading cryptocurrencies. Conduct your own research by contacting financial experts before making any investment decisions. We believe that all content is accurate as of the date of publication, but certain offers mentioned may no longer be available.
Over the past few weeks, Shiba Inu has been in a dormant state with little movement in its price. SHIB continues to trade in a narrow range, making its lack of volatility more and more obvious. According to the provided chart, SHIB is presently exhibiting minimal deviation, circling around the $0.000013 level.
Further highlighting the lack of momentum in the market is the lack of convergence of the 50-day and 200-day moving averages, which normally points to possible bullish or bearish trends. Recent on-chain data highlights the lack of significant whale activity, which further implies that big investors are not interested in the asset right now, which adds to the stagnation.
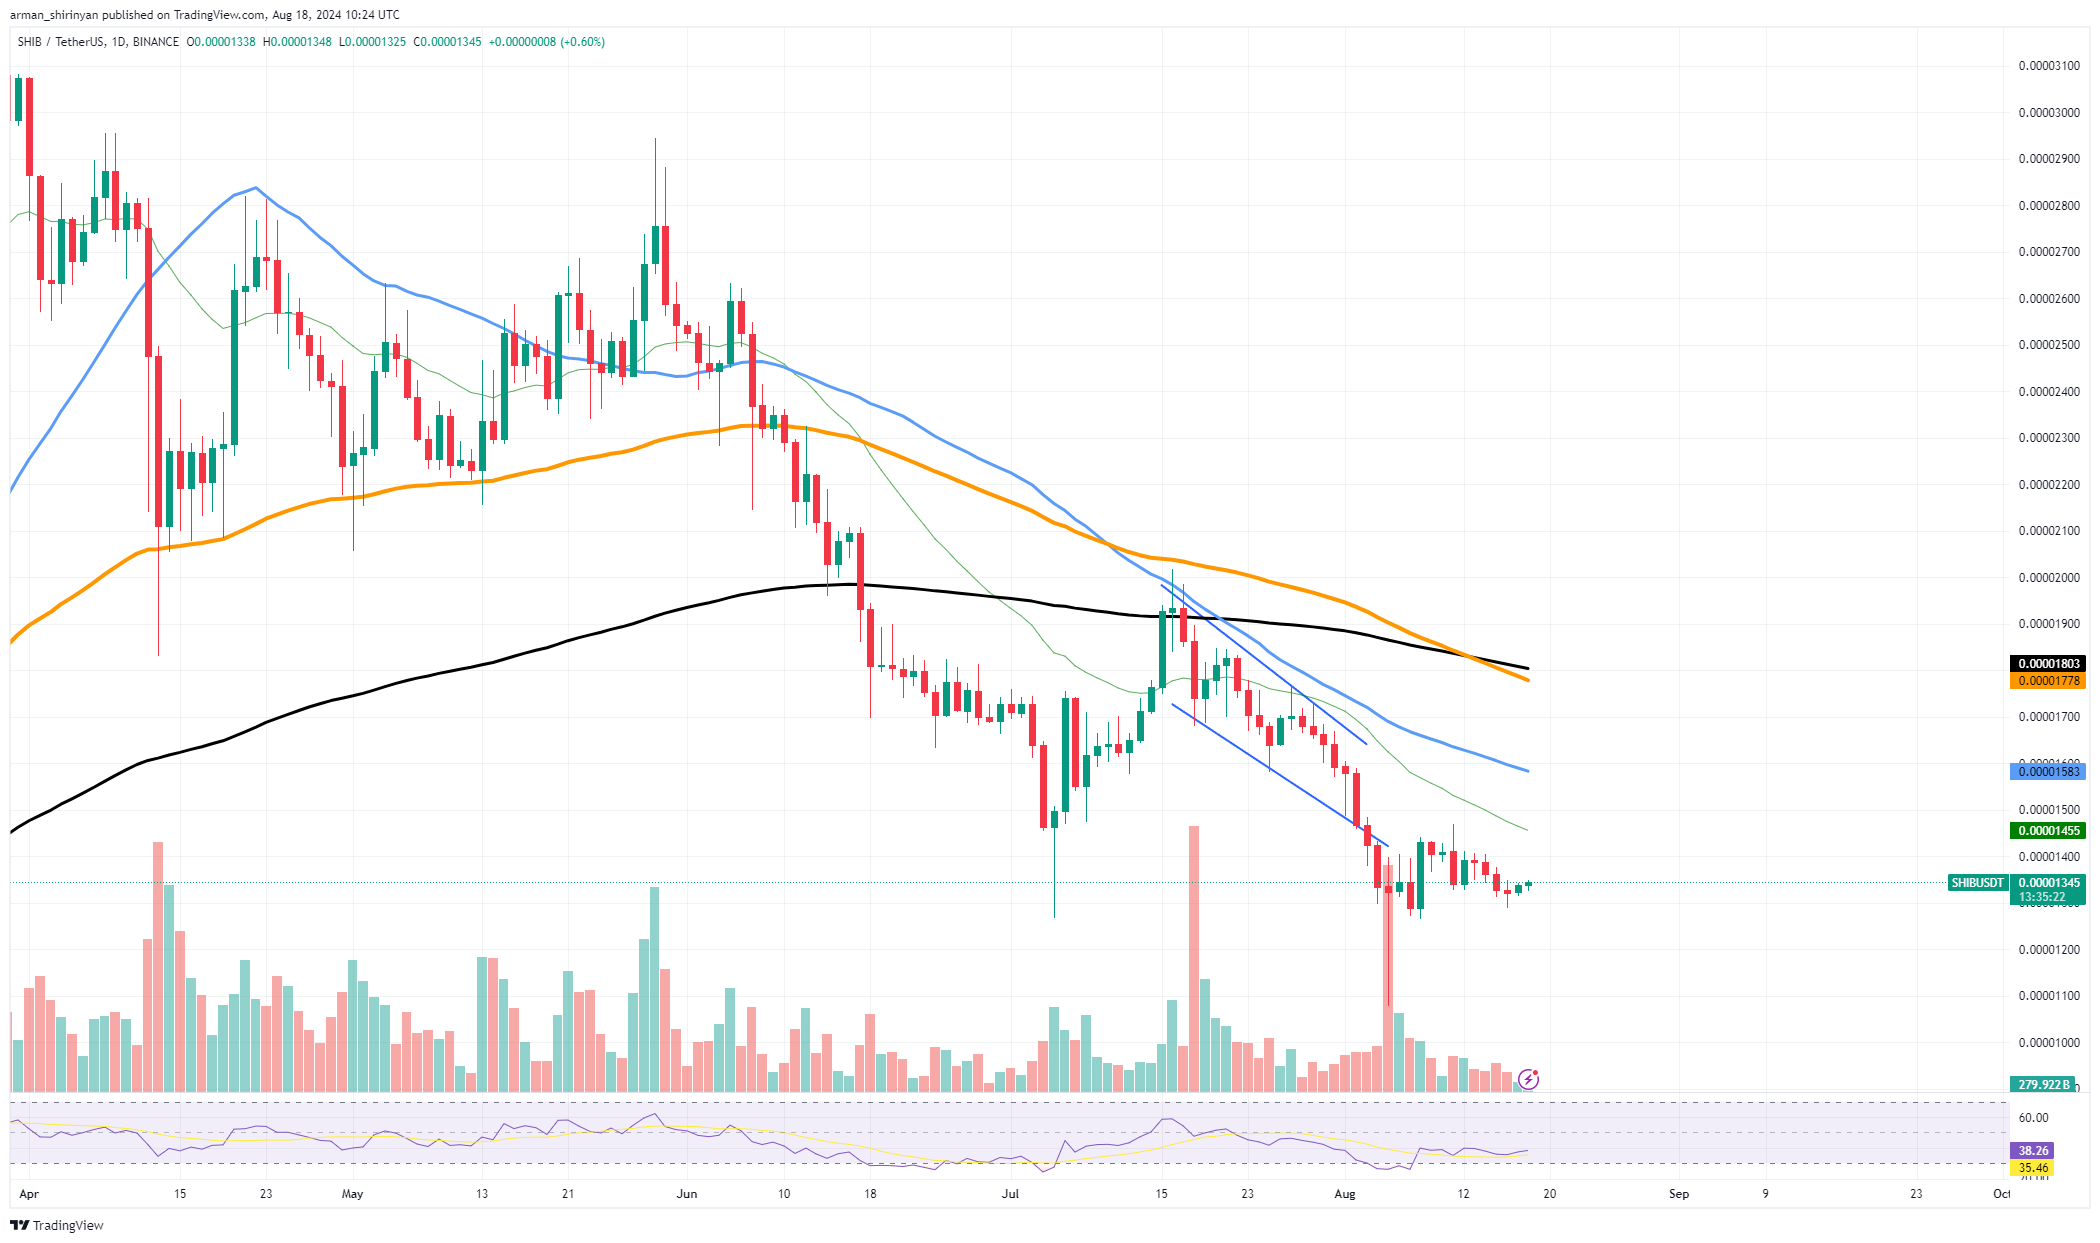
Because of the resistance that this price level has historically provided, a break above it may spark a spike in buying interest and raise volatility. Further momentum could be added to altcoins like SHIB by the general state of the market, which is seeing positive flows into Ethereum and Bitcoin ETFs.
Time-wise, we might witness a sharp rise in volatility driving the price toward the next psychological level of $0.000018 if SHIB breaks through the $0.000015 resistance in the next two weeks.
Solana reaches support
At $140, the 200-day exponential moving average (EMA) represents a critical support level where Solana is currently resting. It is important for traders and investors to keep an eye on this level because it historically served as a reliable predictor of possible reversals or bounce-backs.
The way the market is acting right now indicates that Solana may see a sharp pullback in the next few days, but how far this pullback takes will depend largely on the overall state of the market. At present, the market is in a rather stable state with Bitcoin remaining at approximately $60,000 and other cryptocurrencies such as Solana not gaining much traction.
Related

Solana might see a significant rebound from the $140 mark if the market’s sentiment turns more optimistic, possibly aiming for the next resistance levels at $151 or even higher. However, in the event that the market as a whole stays flat or becomes bearish, Solana may find it difficult to hold its current position above the 200 EMA.
If this support is broken, there could be more losses with possible targets at or below $130. On the daily chart, Solana’s relative strength index (RSI) indicates that it is in a relatively neutral zone, indicating that it may move in either direction in response to market catalysts.
Bitcoin hits $60,000
The psychological threshold of $60,000, which traders and investors have been keeping a careful eye on, has been breached by Bitcoin recently. But the question still stands: Is Bitcoin really safe right now or are there any underlying problems that might jeopardize its stability?
According to the technical chart, Bitcoin has recovered the $60,000 mark following a period of volatility, demonstrating its resilience. The 50-day exponential moving average (EMA), which has historically served as a major resistance level, is coincident with this level. Bitcoin is confronted with several obstacles that may hinder it from staying above $60,000. This is true even with the recent surge in price.
Related

First, there is still uncertainty in the broader market sentiment. Although Bitcoin has continued to trade above $60,000, overall market activity is still low and the performance of altcoins is inconsistent. The market appears to be cautious based on the lack of strong buying momentum, and any unfavorable news or macroeconomic factors could easily drive Bitcoin back below this critical level.
Second, there has been a lot of selling pressure on the $60,000 level during each test. This suggests that a lot of traders remain doubtful about Bitcoin’s capacity to continue rising after this. Bitcoin may start to decline back to the $59,000 or even $58,000 range if it is unable to break above the next resistance level at $62,000.


