

Bitcoin’s price remained in a tight range on Aug. 19, continuing a consolidation phase that has persisted for almost two weeks.
Trading at $58,000, Bitcoin (BTC) contributed to a 2.2% decline in the global crypto market cap, bringing it down to $2.06 trillion.
BTC consolidation continues
This uneventful price action occurred as volumes in both the spot and futures markets stagnated. Bitcoin’s open interest slightly increased on Monday to $30 billion but remained lower than this month’s peak of $36 billion.
Spot market volume for Bitcoin dropped to $17 billion on Monday, a significant decrease from the Aug. 6 high of over $120 billion. Typically, Bitcoin and other cryptocurrencies experience low volumes when they are not in an uptrend. The volume in Solana (SOL), Ethereum (ETH), and Base Decentralized Exchange platforms has dropped by over 20% in the last seven days.
Meanwhile, some large Bitcoin holders seem to be exiting their positions. According to a post on X by Lookonchain, Ceffu, a company offering custody and liquidity solutions to institutions, moved coins worth $211 million to Binance since July 31.
Despite these developments, there are some positive signs for Bitcoin. For one, Bitcoin has remained stable even amid the ongoing Mt. Gox movements. Data shows that the Bitcoin held in Mt. Gox wallets decreased from 141,686 coins on January 1 to 46,164, indicating that the market has absorbed these sales without a significant drop.
Another positive is the increasing number of large institutions holding spot Bitcoin ETFs, signaling that the asset is gaining mainstream acceptance. Notable companies include Goldman Sachs, HSBC, and Barclays.
Bitcoin price weekly chart
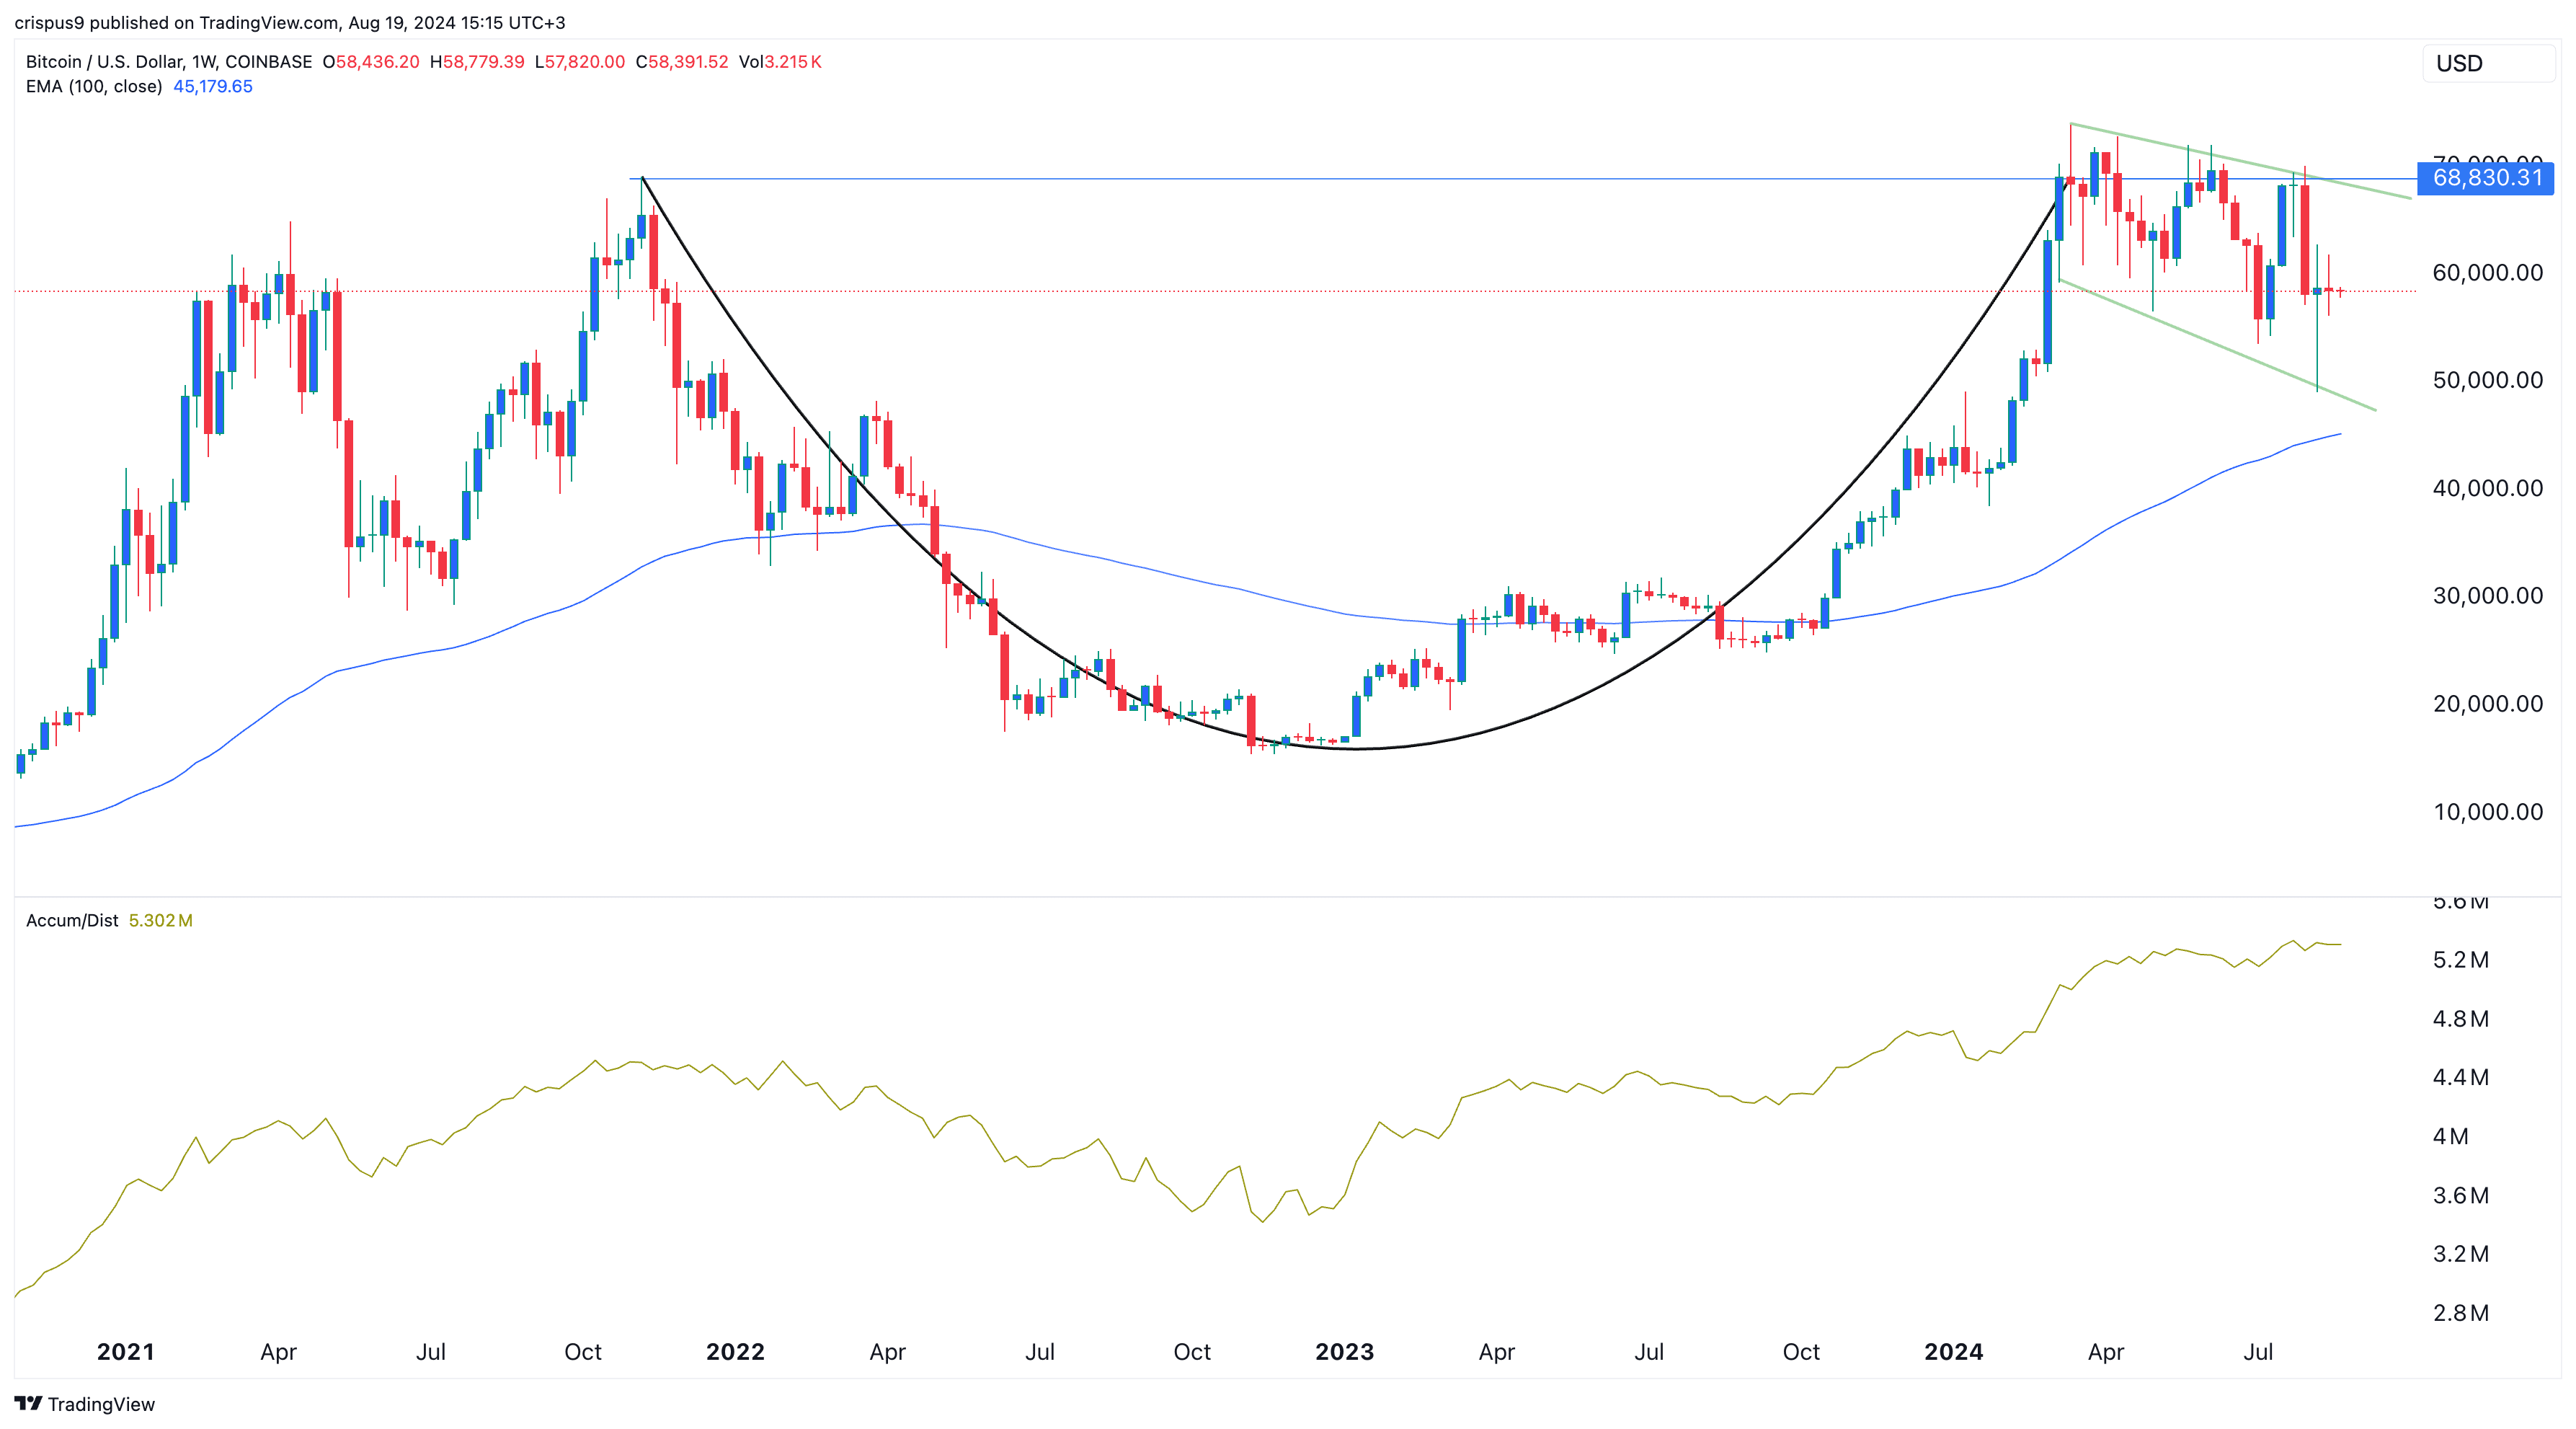
Longer-term charts also suggest that Bitcoin is holding up well. On the weekly chart, Bitcoin has consistently stayed above the 100-week Exponential Moving Average since October last year.
Bitcoin has also formed a falling broadening wedge chart pattern, often leading to a bullish breakout. This pattern, characterized by connecting the lower lows and lower highs, typically sees a significant breakout when the price moves above the lower side of the wedge.
Additionally, Bitcoin has formed a cup and handle pattern, with the upper boundary at $68,830. The wedge pattern is part of this handle, and the accumulation and distribution indicator has reached its highest level in years.
BTC price monthly chart
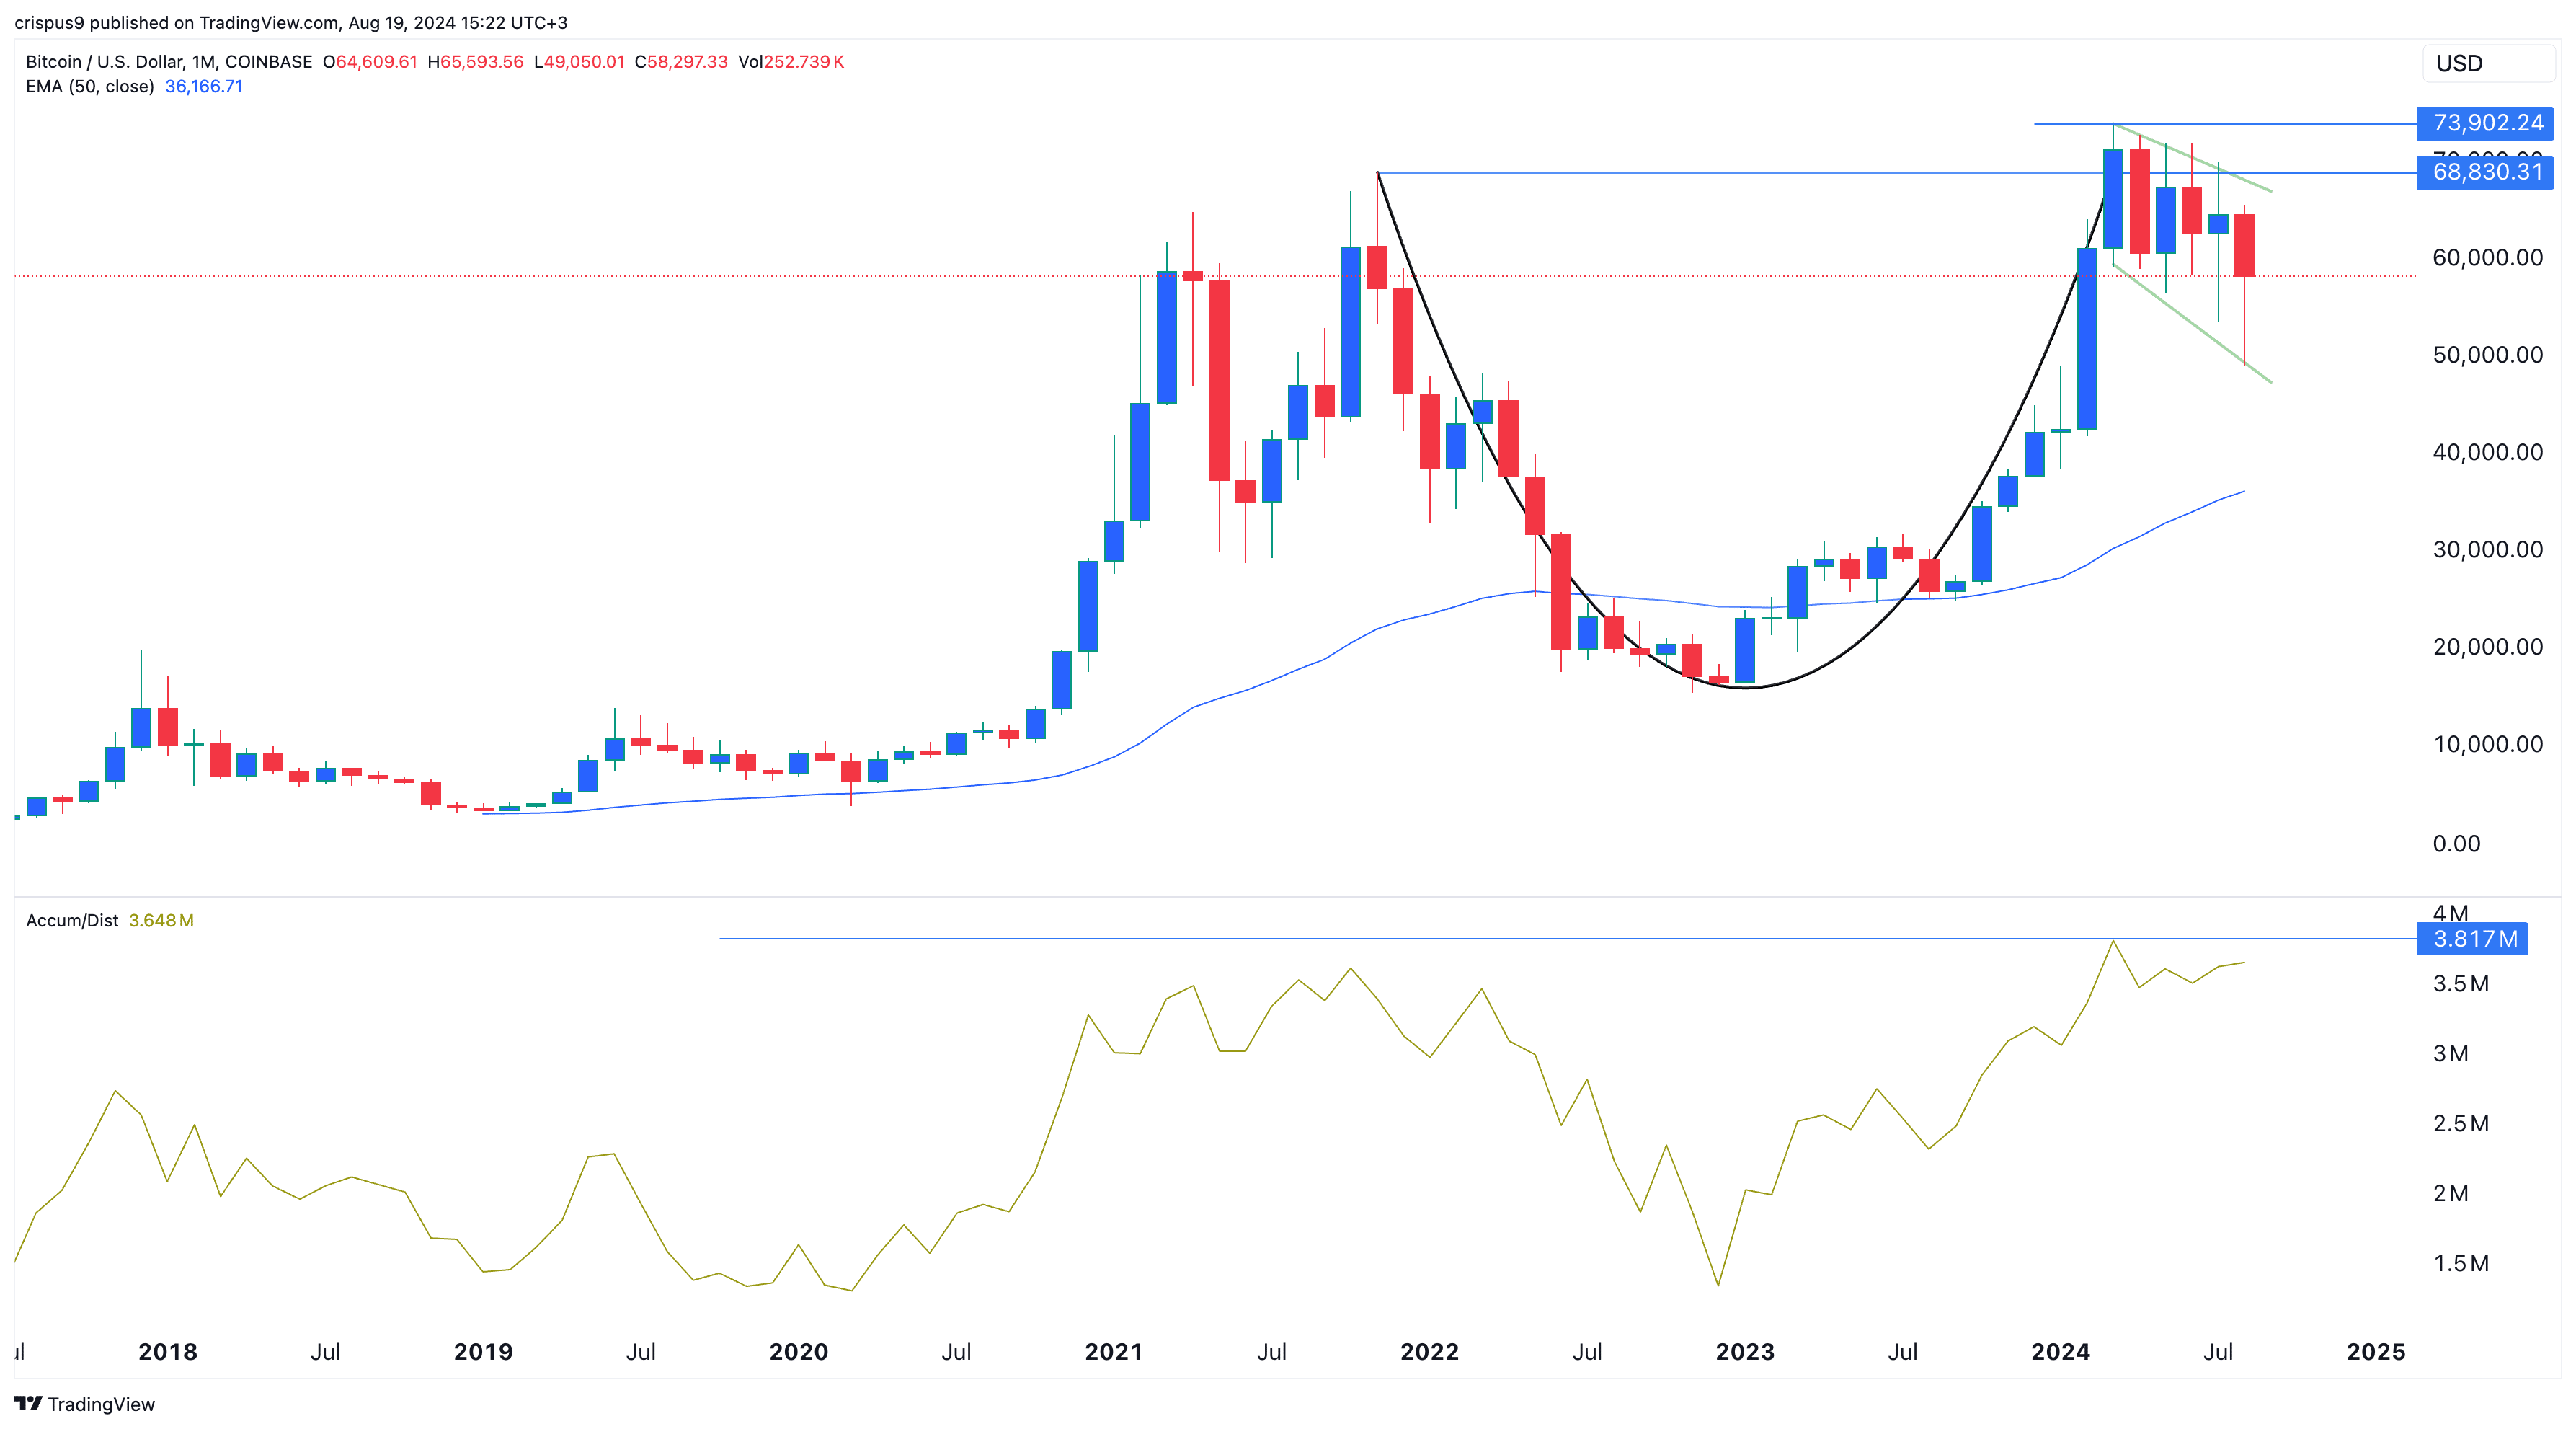
The monthly chart also points to potential upside for Bitcoin. Similar to the weekly chart, it shows a cup and handle pattern, with the accumulation and distribution indicator near its all-time high. Bitcoin has remained above the 50-month moving average.
Bitcoin is also forming a hammer candlestick pattern, characterized by a long lower shadow, a small body, and little to no upper shadow. For this pattern to fully form, Bitcoin needs to close the month slightly below $64,000. If this occurs, it could signal further upside.
In the long run, a Bitcoin rally will be confirmed if it breaks above the year-to-date high of $73,902.


