
Bitcoin’s (BTC) price may have officially hit “reset” following an incredible rise in the coin’s long-term holder net position change. Historically, a rise in this metric helps the price recover.
But will it be the same this time? This on-chain analysis examines the chances.
$20 Billion in the Bag for Bitcoin HODLers
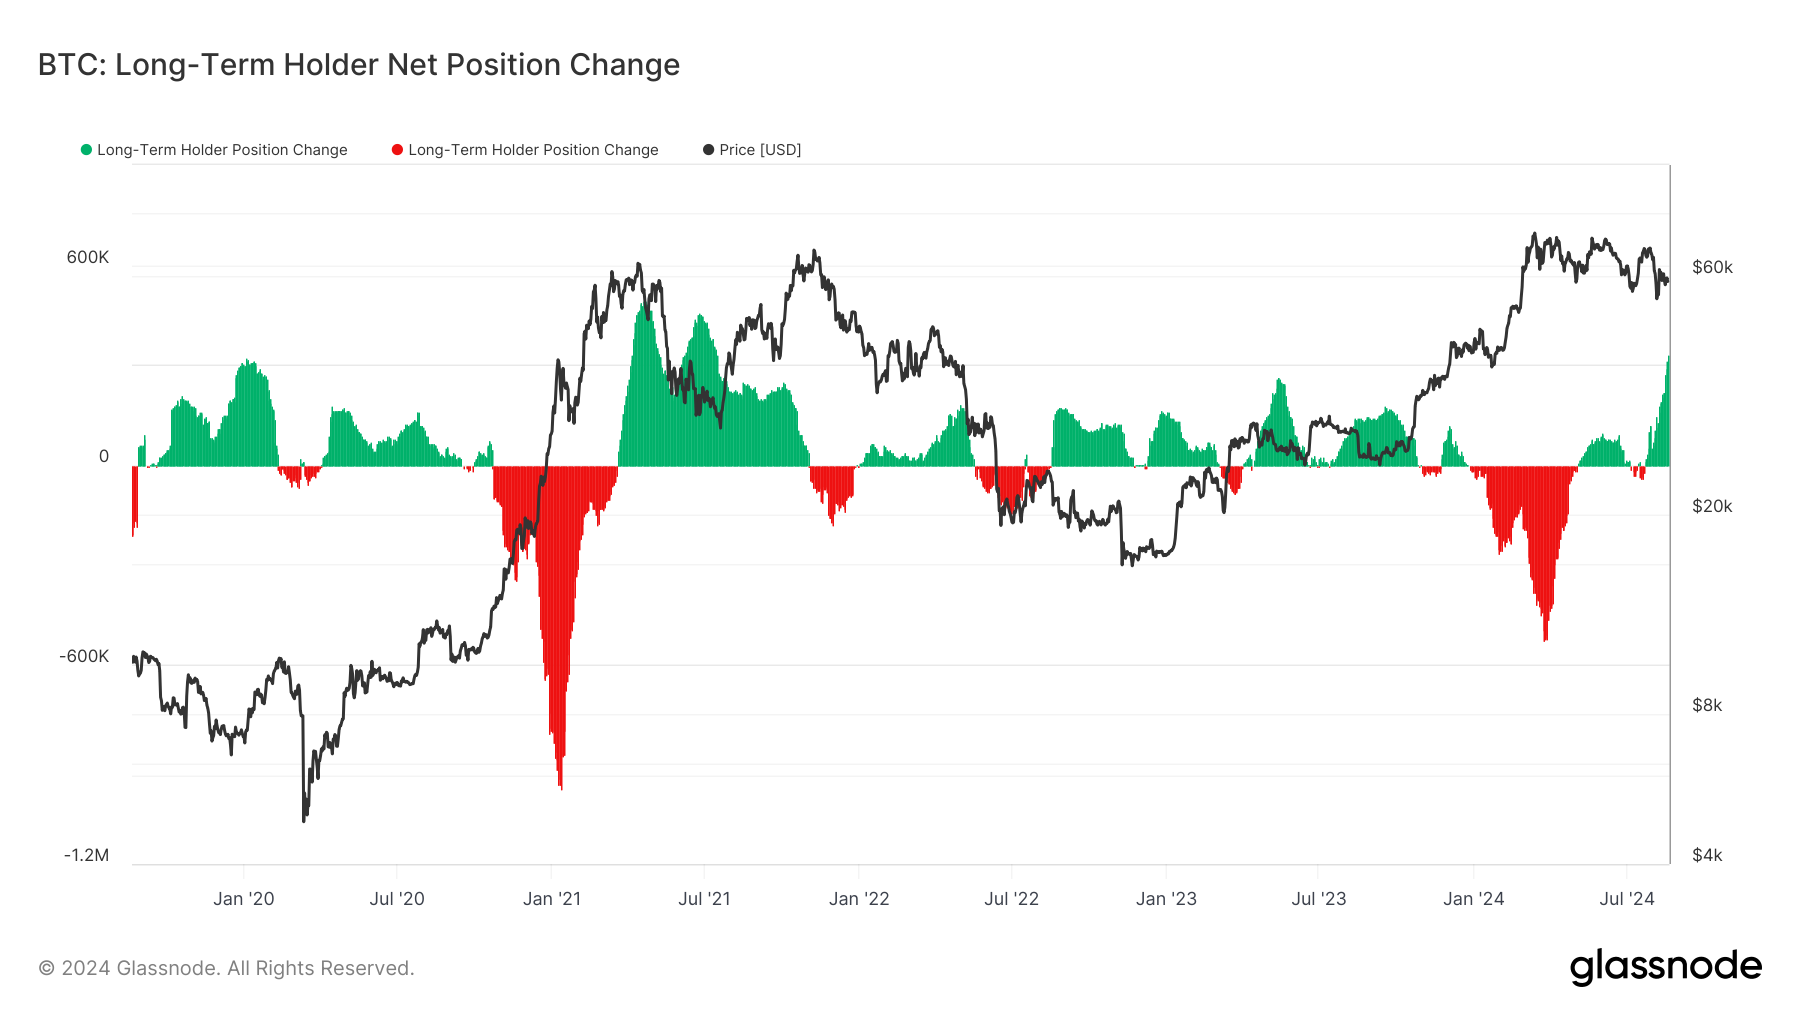
According to Glassnode, Bitcoin’s long-term holder net position change has been increasing since July 22. However, today, the metric, which tracks the 30-day change in supply held by long-term holders, hit its highest point since January 2020.
As seen in the image below, long-term holders purchased 334,358 BTC today. At the coin’s current price, this value is worth nearly $20 billion. Purchasing such a large amount of Bitcoin suggests that holders are confident in the coin’s long-term potential.
For instance, the last time holders accumulated such a number, Bitcoin’s price was $10,300 (in 2020). By the end of the same year, the value had increased to $28,988, representing approximately a 300% price increase.
While history doesn’t exactly repeat, patterns often rhyme. If long-term holder supply impacts Bitcoin similarly, a breakout could occur mid to long term. However, this surge might not lead to the massive 200%-300% gains seen previously. Currently, Bitcoin is priced at $58,579, marking an 11.95% drop in the last 30 days.
In the short term, Bitcoin could find relief due to the Miner’s Position Index (MPI). The MPI is the ratio of the total miner outflow, measured in dollars, to the 365-day moving average of the same ratio. Higher values suggest that miners are taking coins out of their reserves and selling them.
Usually, this leads to a price drop. However, according to CryptoQuant, the MPI is down to its lowest level since the previous week.
Read more: Who Owns the Most Bitcoin in 2024?
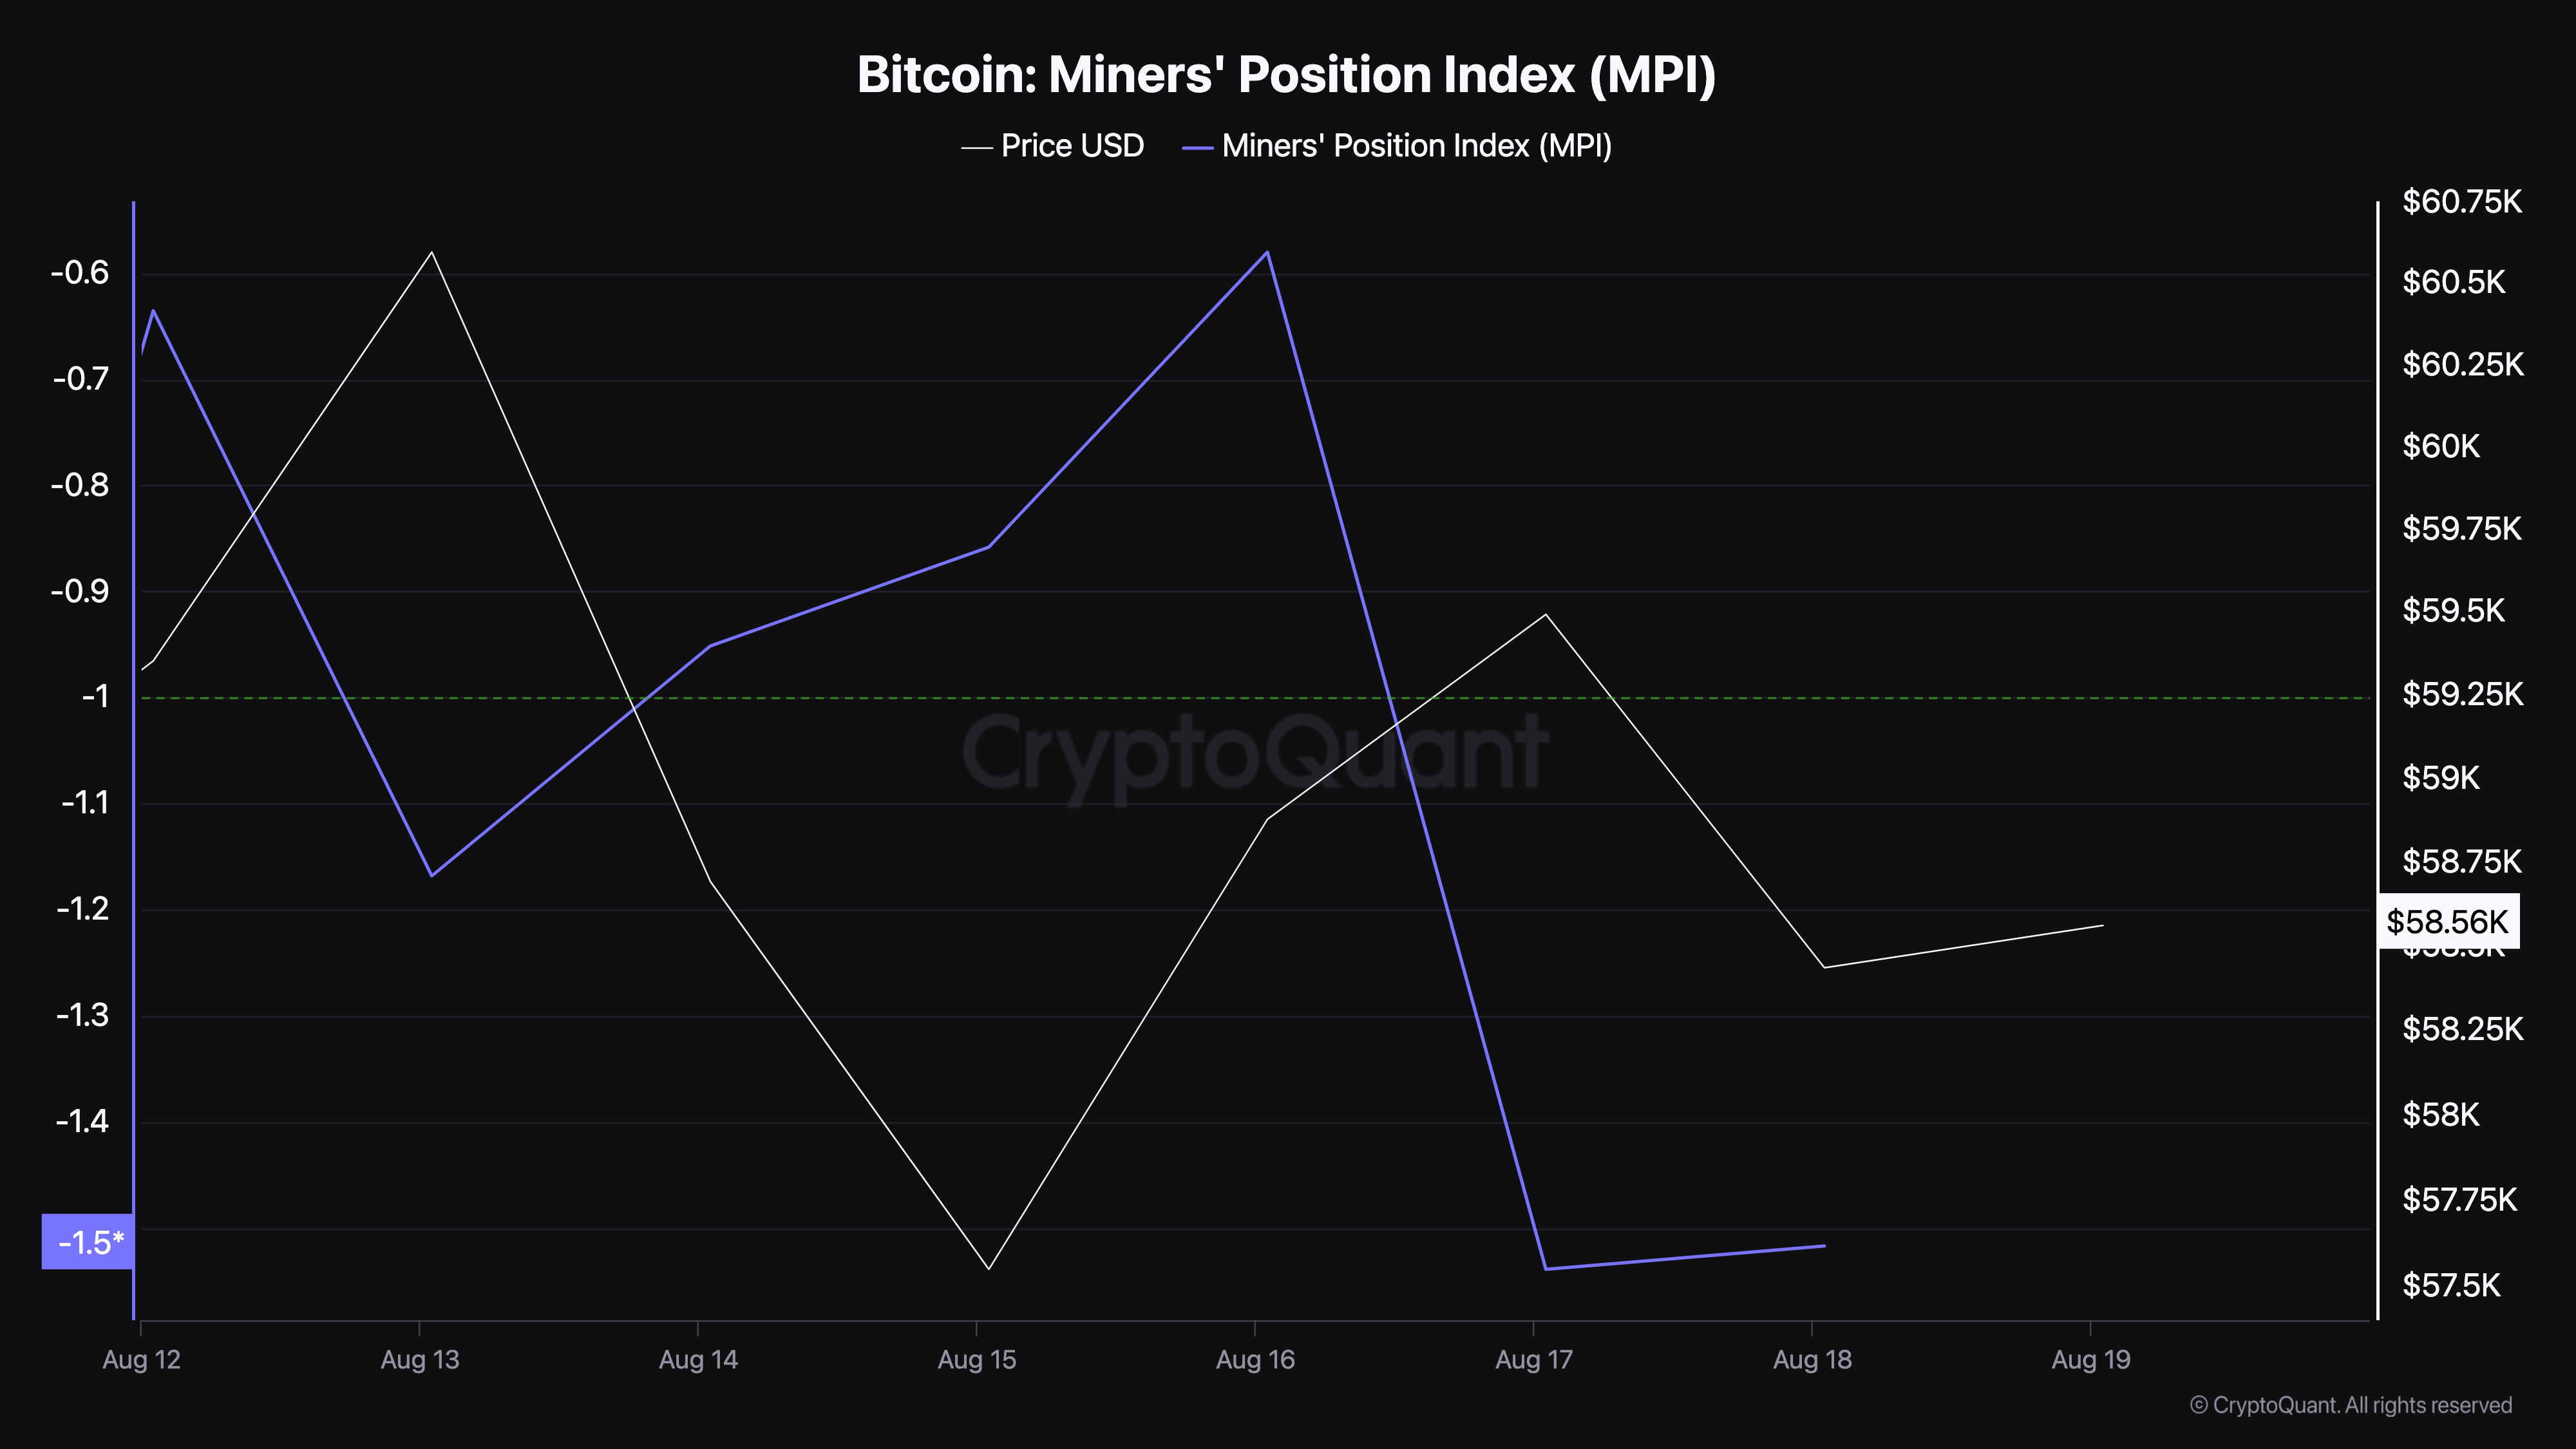
The recent drawdown indicates that miners have refrained from selling. If this remains the case, BTC might avoid another drop. Instead, the cryptocurrency’s price might attempt to revisit $60,000.
Bulls Ready to Pull the Buy Trigger
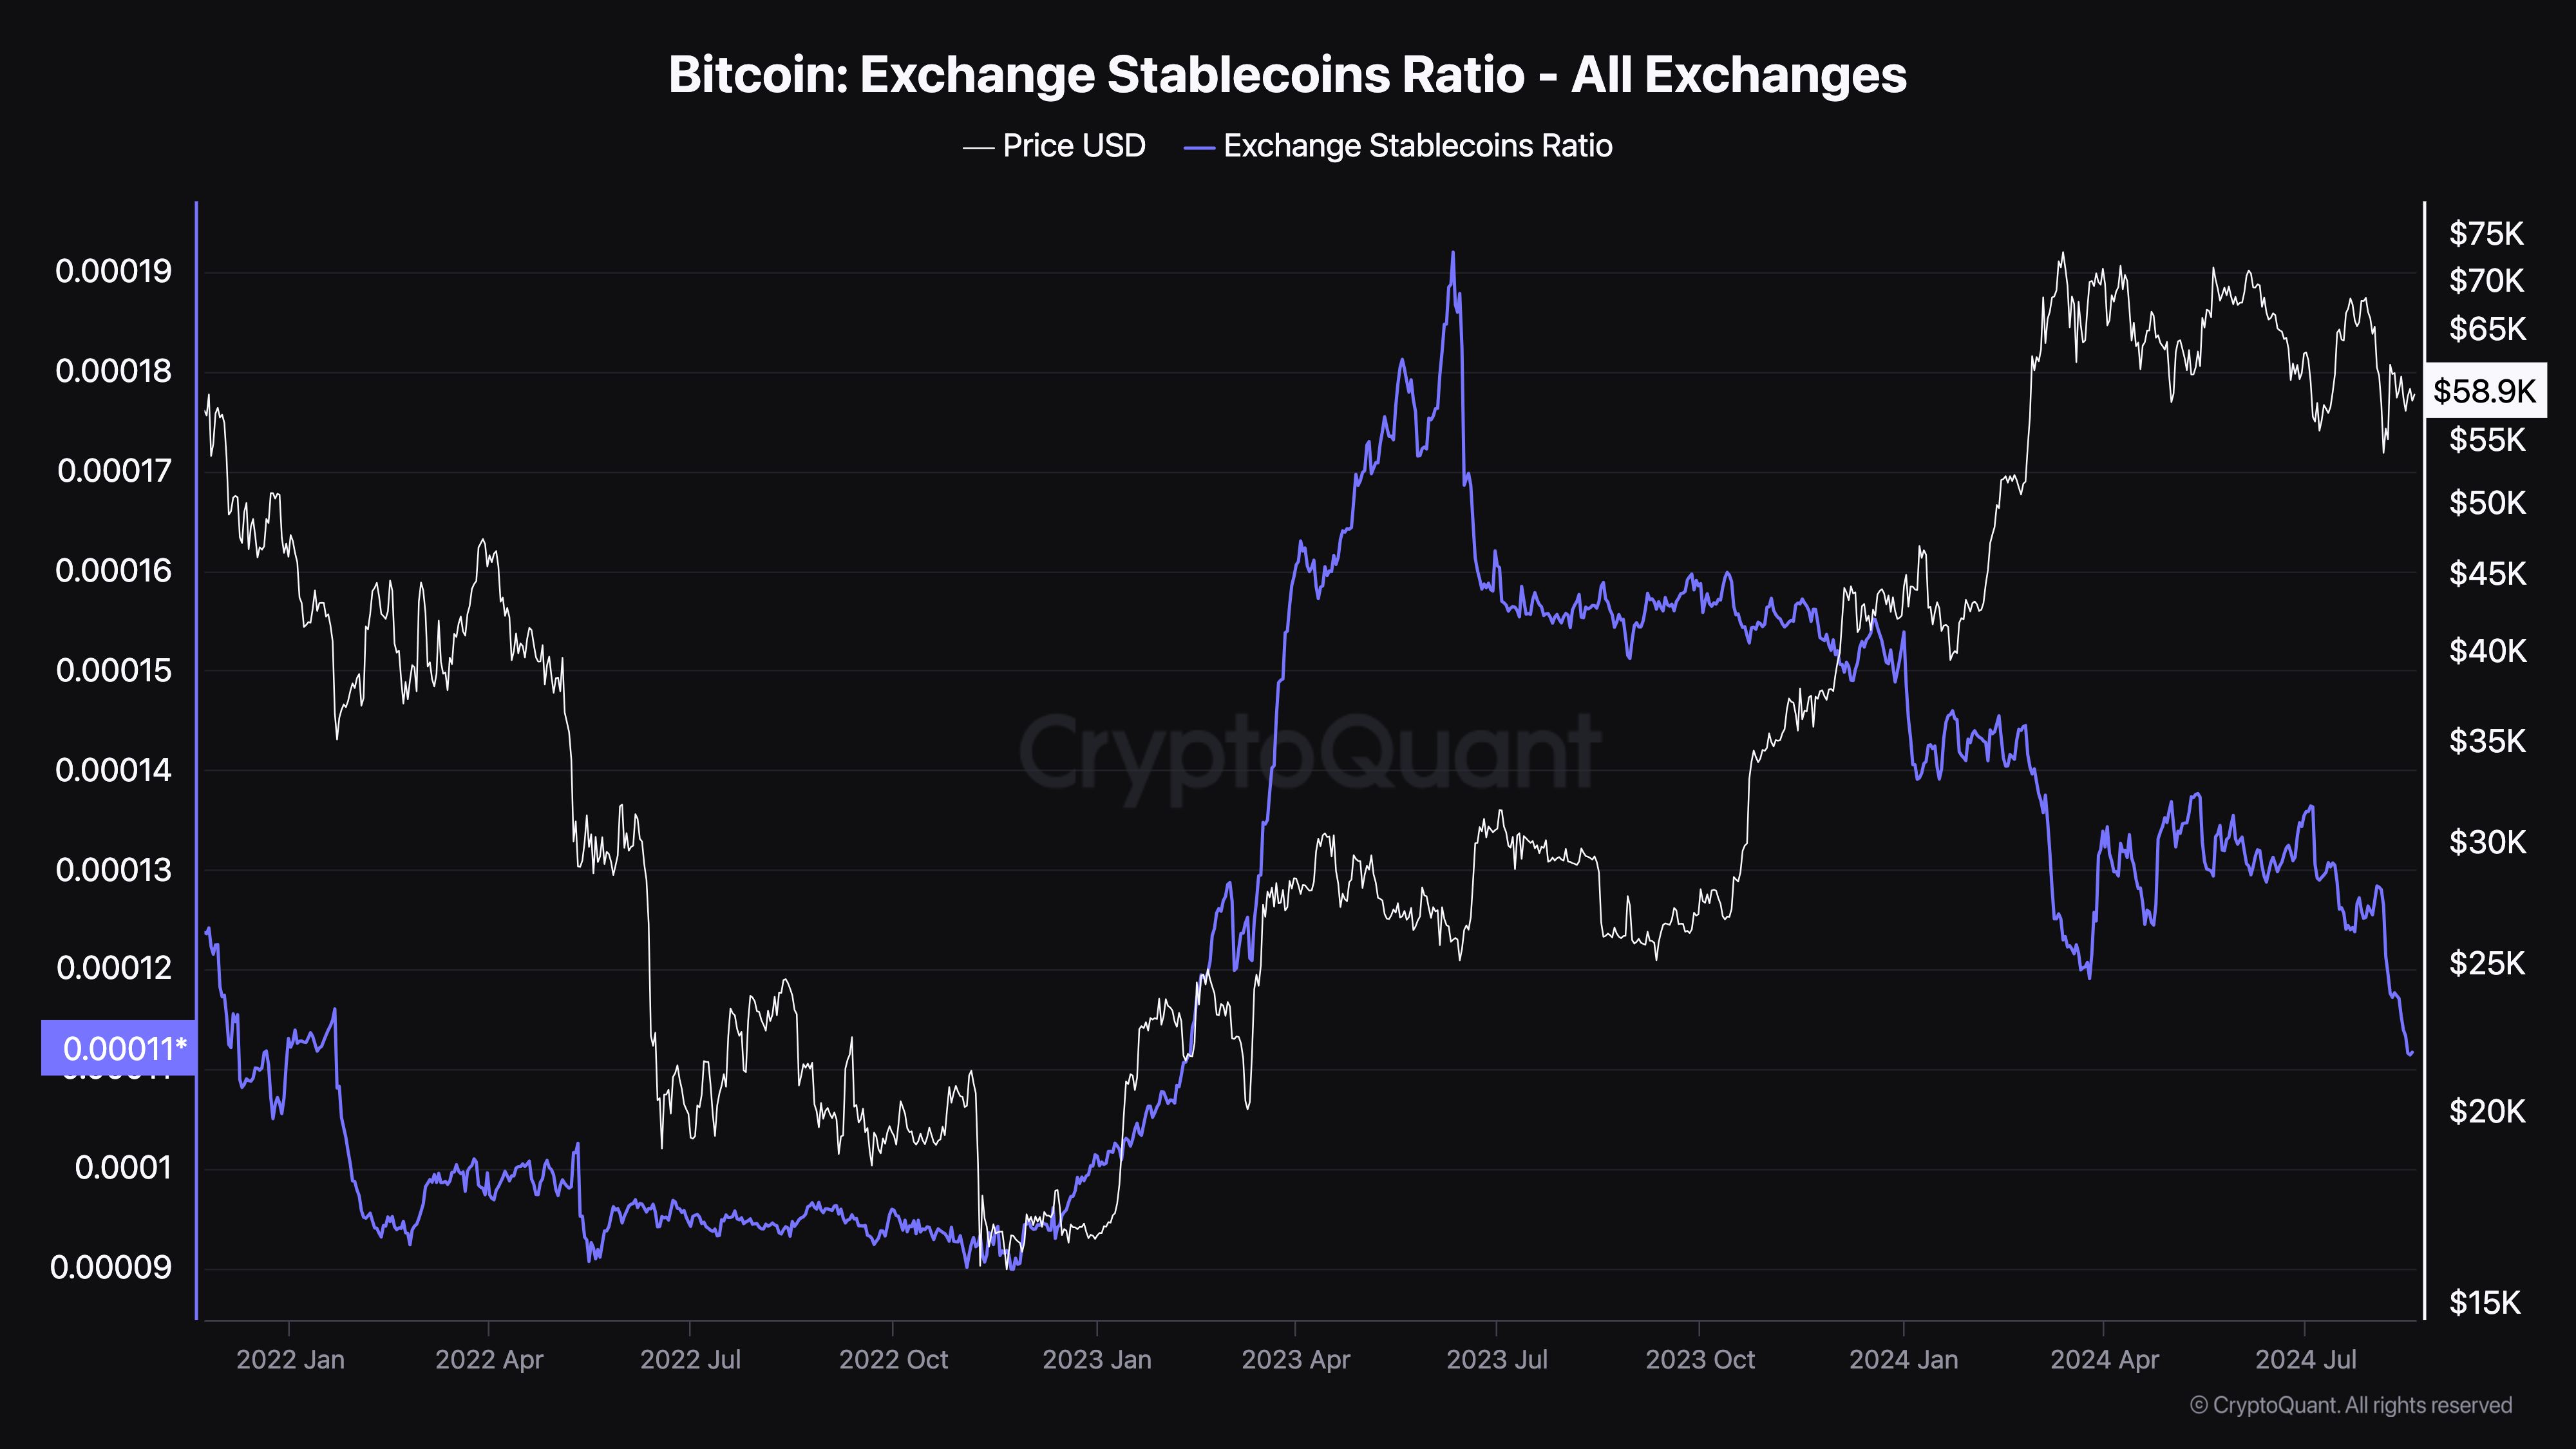
Another metric that supports this is the Exchange Stablecoin Ratio, which measures the buying power in the market. When the stablecoin ratio is high, buying power is low, indicating a higher chance of a price drop.
However, at press time, Bitcoin’s Exchange Stablecoin Ratio is at its lowest since February 2023. This decline suggests that market participants have significant buying power to drive a price increase.
Regarding this, CryptoQuant analyst Axel Adler opined that Bitcoin is nearing the end of its consolidation period.
“The current 5-month consolidation looks healthy, with most investors having sold their coins to others at a profit, and there have been no massive stress-induced panic sales. Now, realized losses have exceeded profits, which often occurs at the end of a consolidation period,” Adler wrote.
BTC Price Prediction: $63,000 Could Be Next
From a technical standpoint, Bitcoin is currently trading below the 200-day Exponential Moving Average (EMA). This indicator typically signals trend direction, and with BTC below it, the outlook suggests a potential bearish trend in the short term.
However, it is also worth noting that a brief price increase could send Bitcoin’s price above the 200 EMA (purple). If this happens, bulls may push the price higher. Should this be the case, the value of BTC might reach $60,536.
Additionally, the price could trade higher if MACD turns positive and the 12 EMA (blue) crosses the 26 EMA (orange). As seen below, a crossover of the shorter EMA over the longer one brought about a substantial price increase for BTC.
Read more: Bitcoin (BTC) Price Prediction 2024/2025/2030
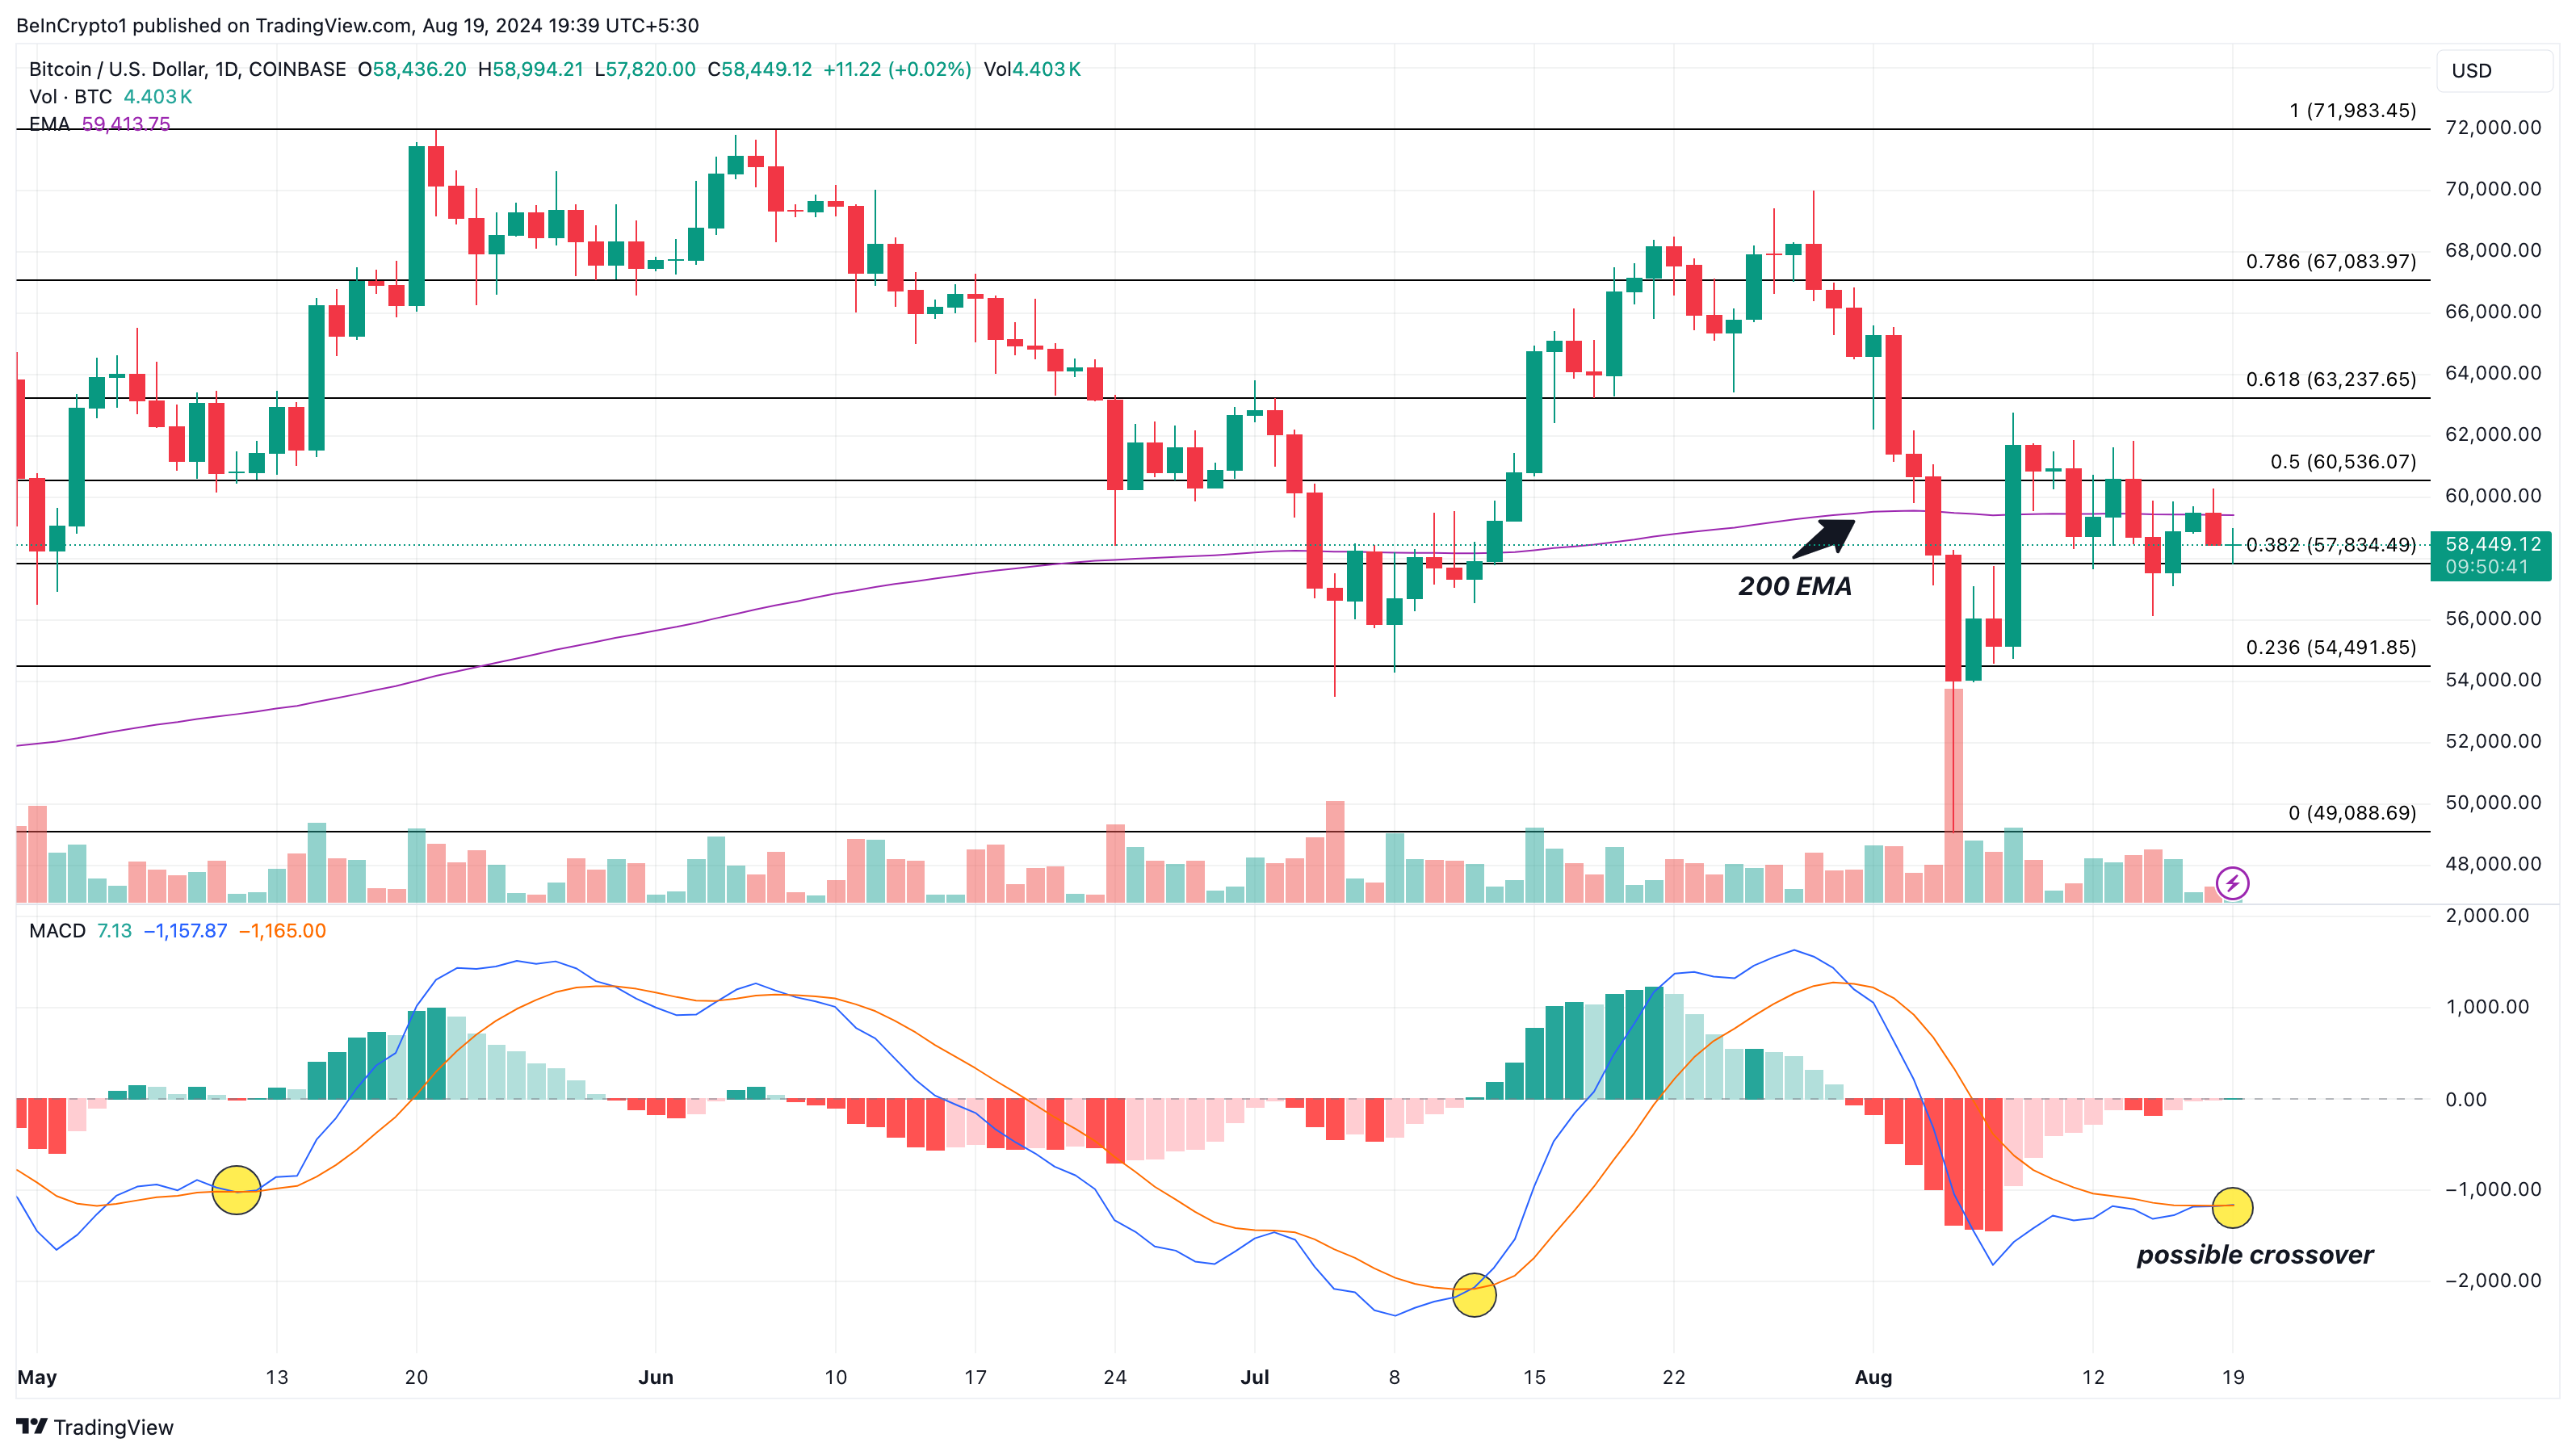
For instance, the May crossover propelled BTC to $72,045, and in July, it reached $68,308 after another bullish crossover. Currently, the EMAs are aligned similarly. If the 12 EMA crosses above the 26 EMA, it would confirm a bullish trend, potentially pushing Bitcoin to $63,237.
However, if a bearish crossover occurs, the outlook could reverse, leading BTC to a decline toward $54,491.
Disclaimer
In line with the Trust Project guidelines, this price analysis article is for informational purposes only and should not be considered financial or investment advice. BeInCrypto is committed to accurate, unbiased reporting, but market conditions are subject to change without notice. Always conduct your own research and consult with a professional before making any financial decisions. Please note that our Terms and Conditions, Privacy Policy, and Disclaimers have been updated.


