

PlanB, the pseudonymous creator of the Bitcoin (BTC) stock-to-flow model, shared a chart on X, suggesting that the asset’s price could increase fourfold from current levels.
Bitcoin currently trades at $60,676, following a 4% increase in the last 24 hours. But will BTC’s price reach $240,000 by the end of the bull market?
Bitcoin Eyes a Repeat of 2017 and 2021
PlanB recently posted on X, highlighting how Bitcoin’s price has historically increased fourfold whenever it crossed above the 200-week Moving Average (MA). The 200 MA is a widely-used technical analysis tool that helps identify long-term trends for cryptocurrencies.
This indicator is often used to gauge whether the trend is bullish or bearish. Typically, when BTC rises above the 200 MA, it signals potential price growth and suggests that the bull market is still intact.
Conversely, a drop below the 200 MA indicates that a long-term bull run may not yet be confirmed. In the chart shared by PlanB, he pointed to the 2017 bull market, where at one stage, BTC dipped below $4,000, illustrating how these movements can impact market sentiment.
Read more: 7 Ways To Survive the Crypto Bear Market
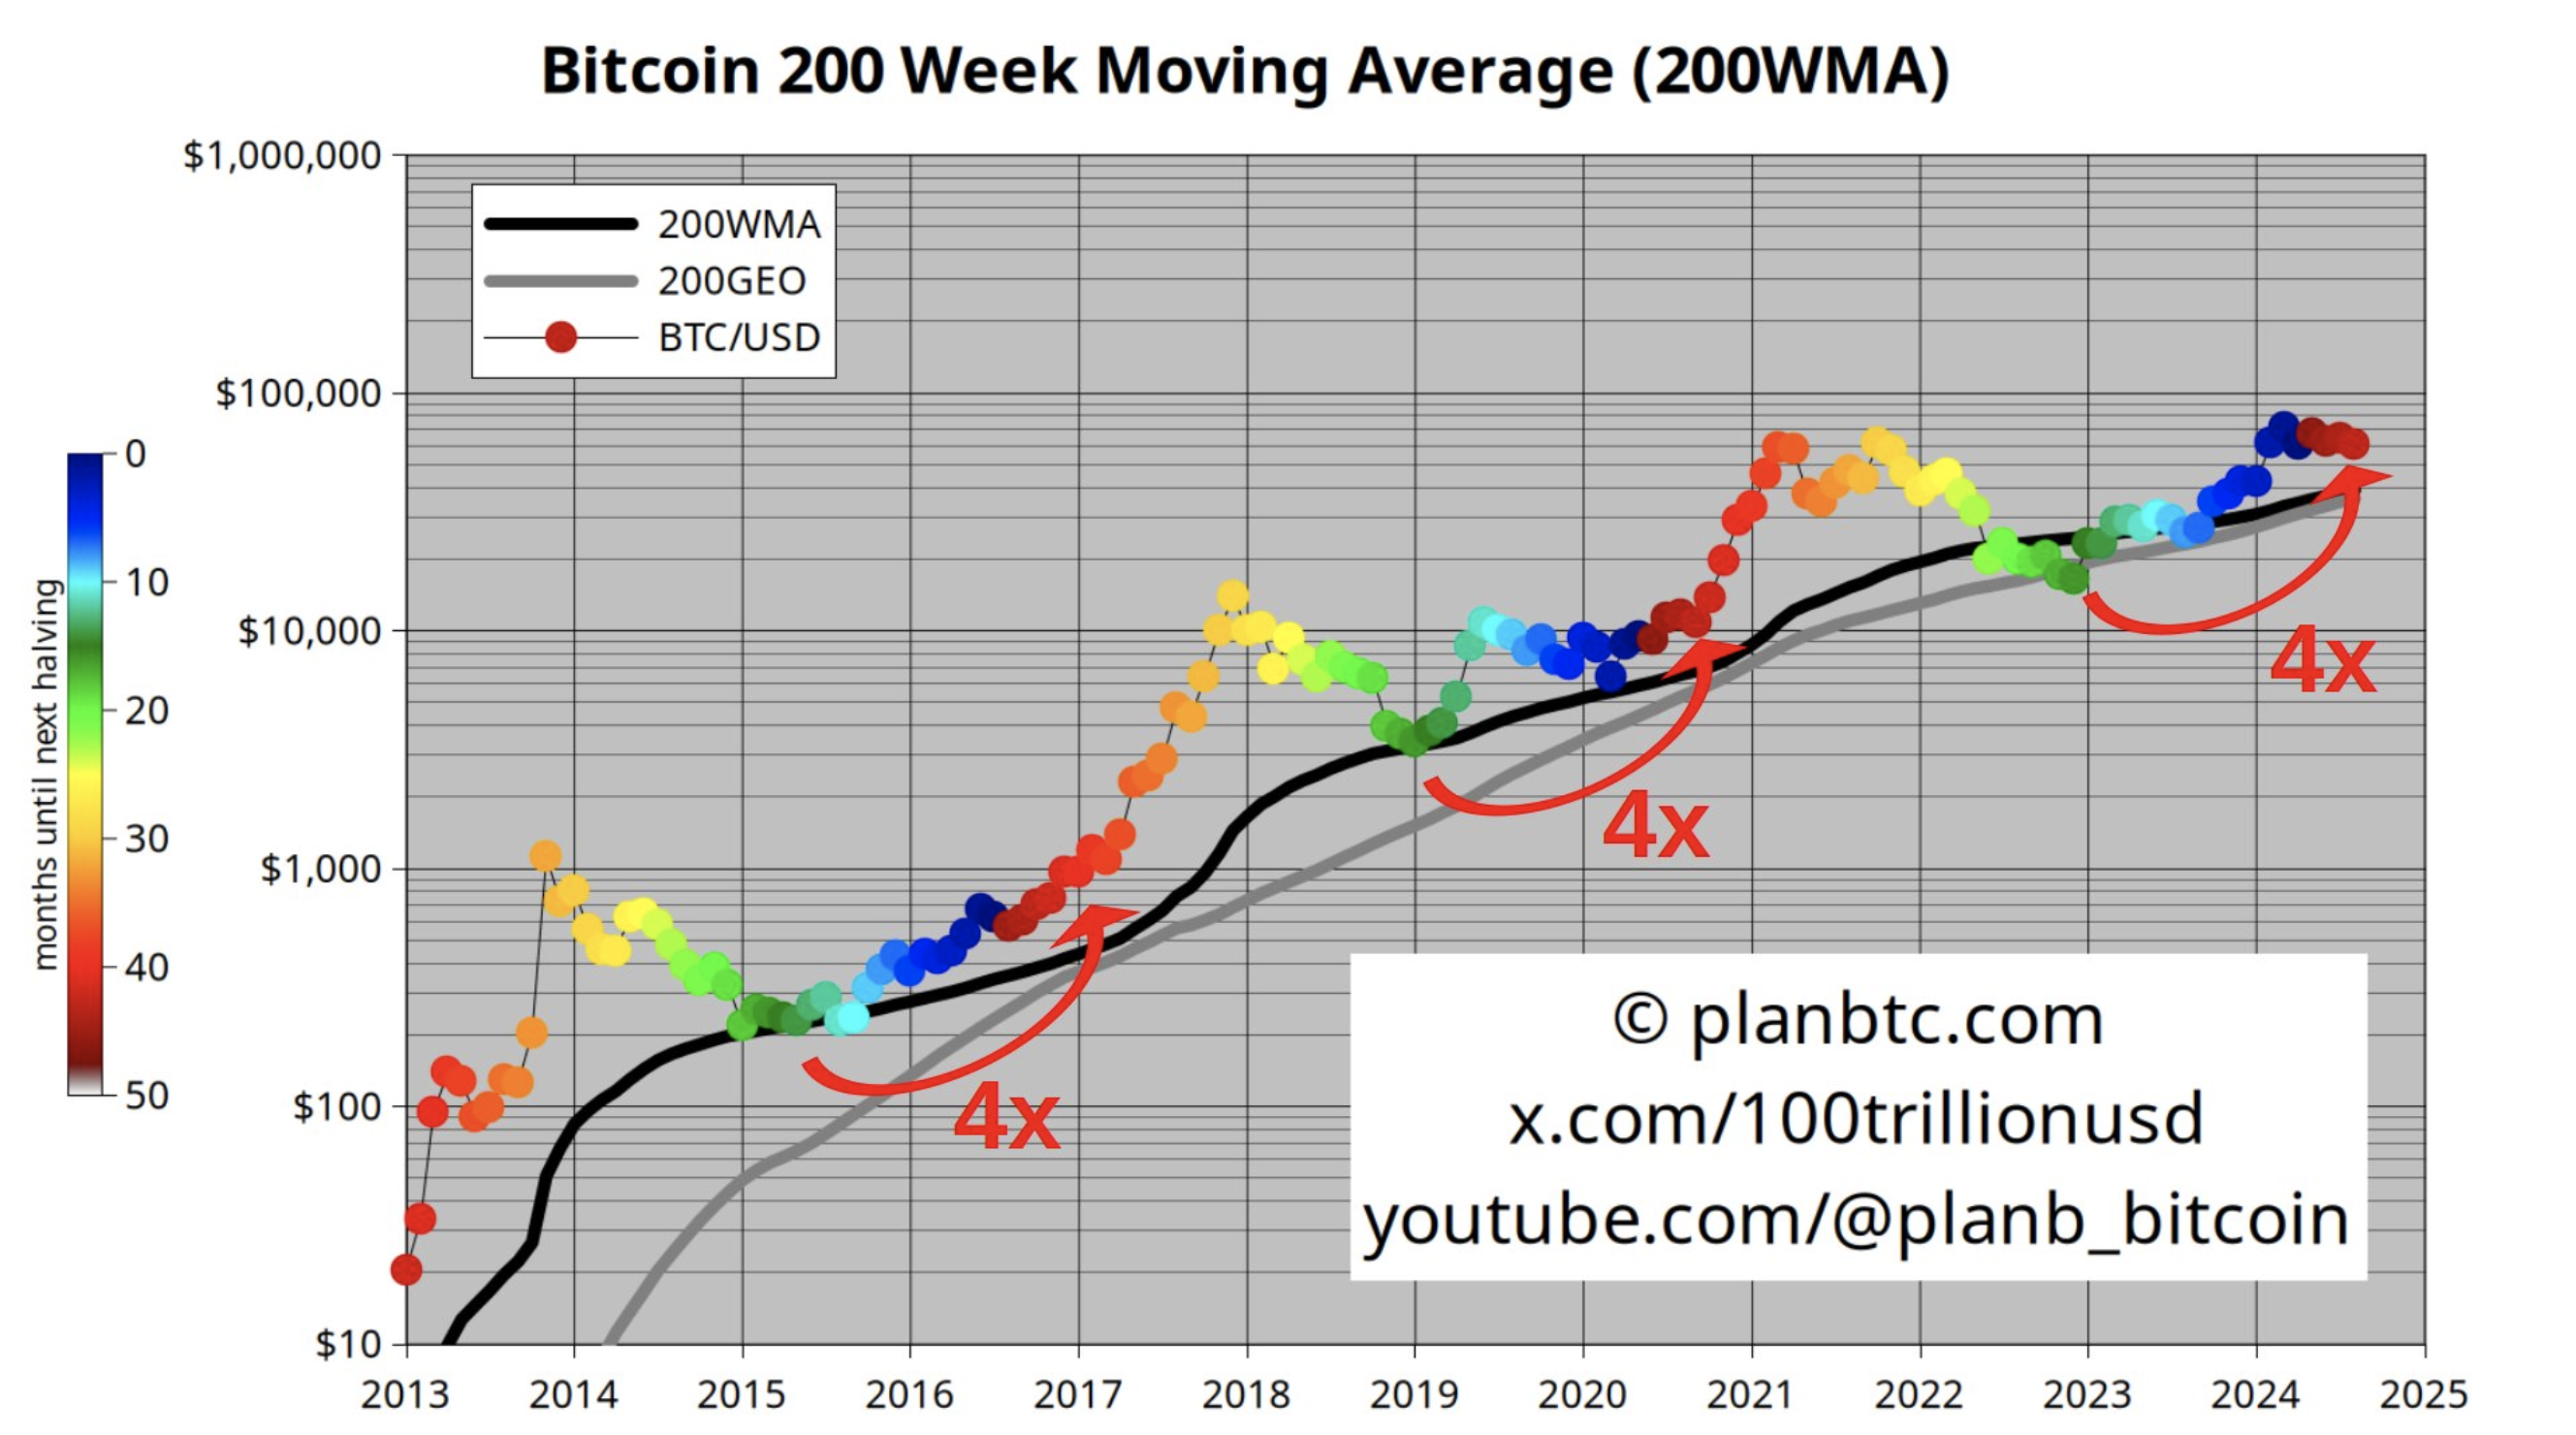
By the top of the cycle, the price increased to $17,760. Fast forward to the 2020-2021 bull run, the coin was trading around $15,560 in November 2020 before skyrocketing to $69,000 a year later.
Interestingly, at every point in each cycle, BTC experienced a boring period that saw the price undergo consolidation and correction. But in the end, a notable price pump appears.
While history rarely repeats itself, patterns often rhyme. If past trends are any indication, BTC’s recent surge to $73,750 may not mark the top of this cycle. The bull market could still have more room to run ahead.
No Bear Market Here
If validated, this position contradicts the signs that the cycle is heading to a bear market. Furthermore, Plan B is not the only one who believes the bear market is not here.
In a conversation with BeInCrypto, Griffin Ardern, Head of BloFin Research & Options, explains that the weak performance of BTC and other cryptocurrencies does not entirely infer that the bull market is over.
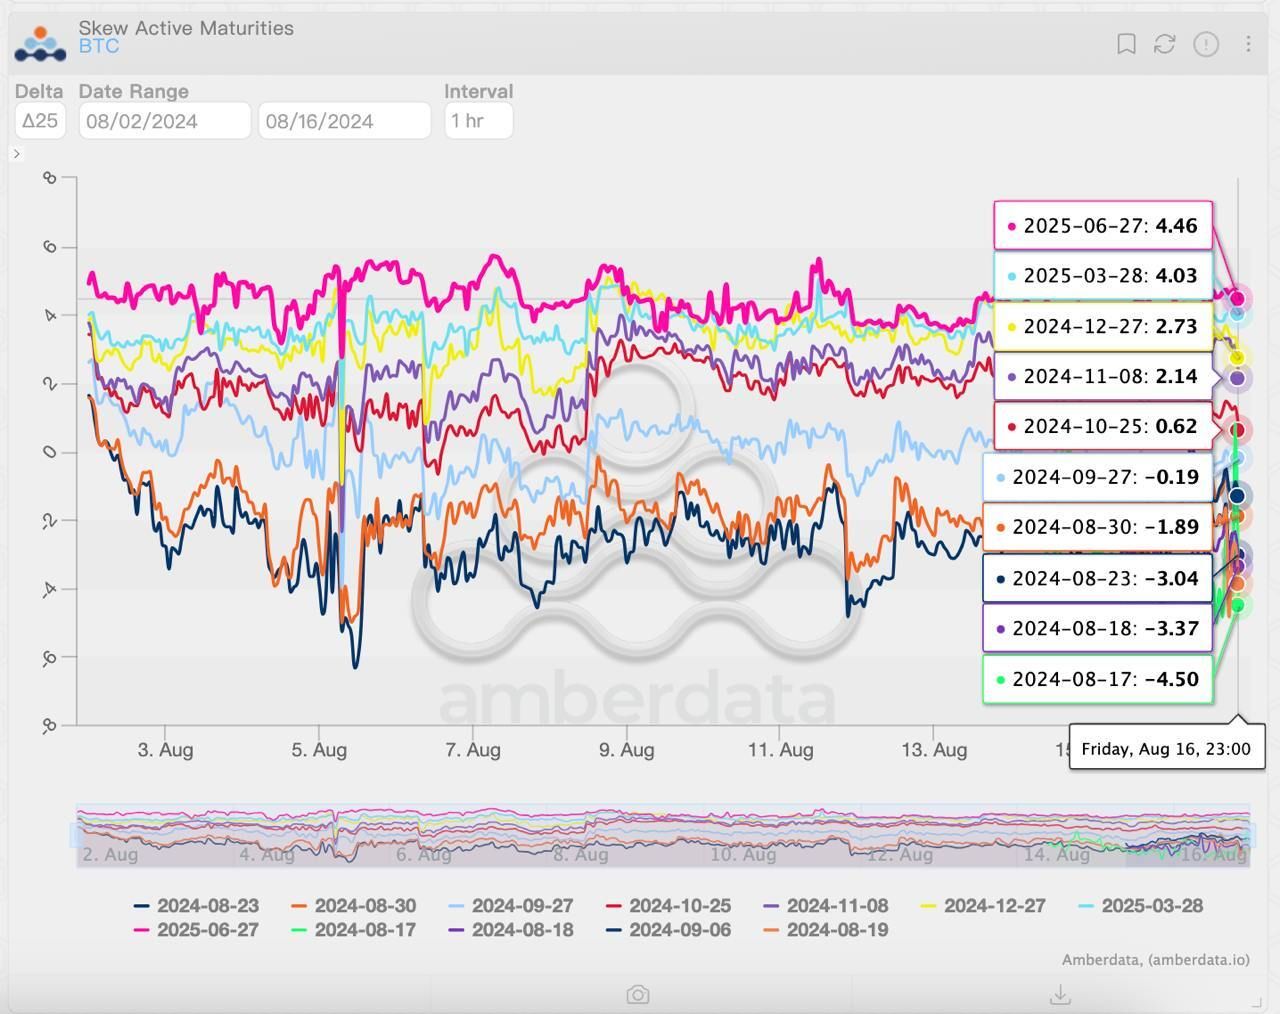
“Judging from the performance of the options market, traders expect that the carry trade unwind and liquidity substitution caused by the interest rate cut will affect the performance of the crypto market in the short term. Still, traders are generally bullish on cryptos’ medium- and long-term performance, which is entirely different from the expectations during the bear market,” Ardern told BeInCrypto
Ardern also added that BTC’s annualized implied forward rate is higher than the risk-free rate. In a bear market, the rate is usually lower. This metric often reflects bullish and bearish sentiment among options traders, with the image below aligning with a bullish perception.
BTC Price Prediction: The Race to the Top Has Just Begun
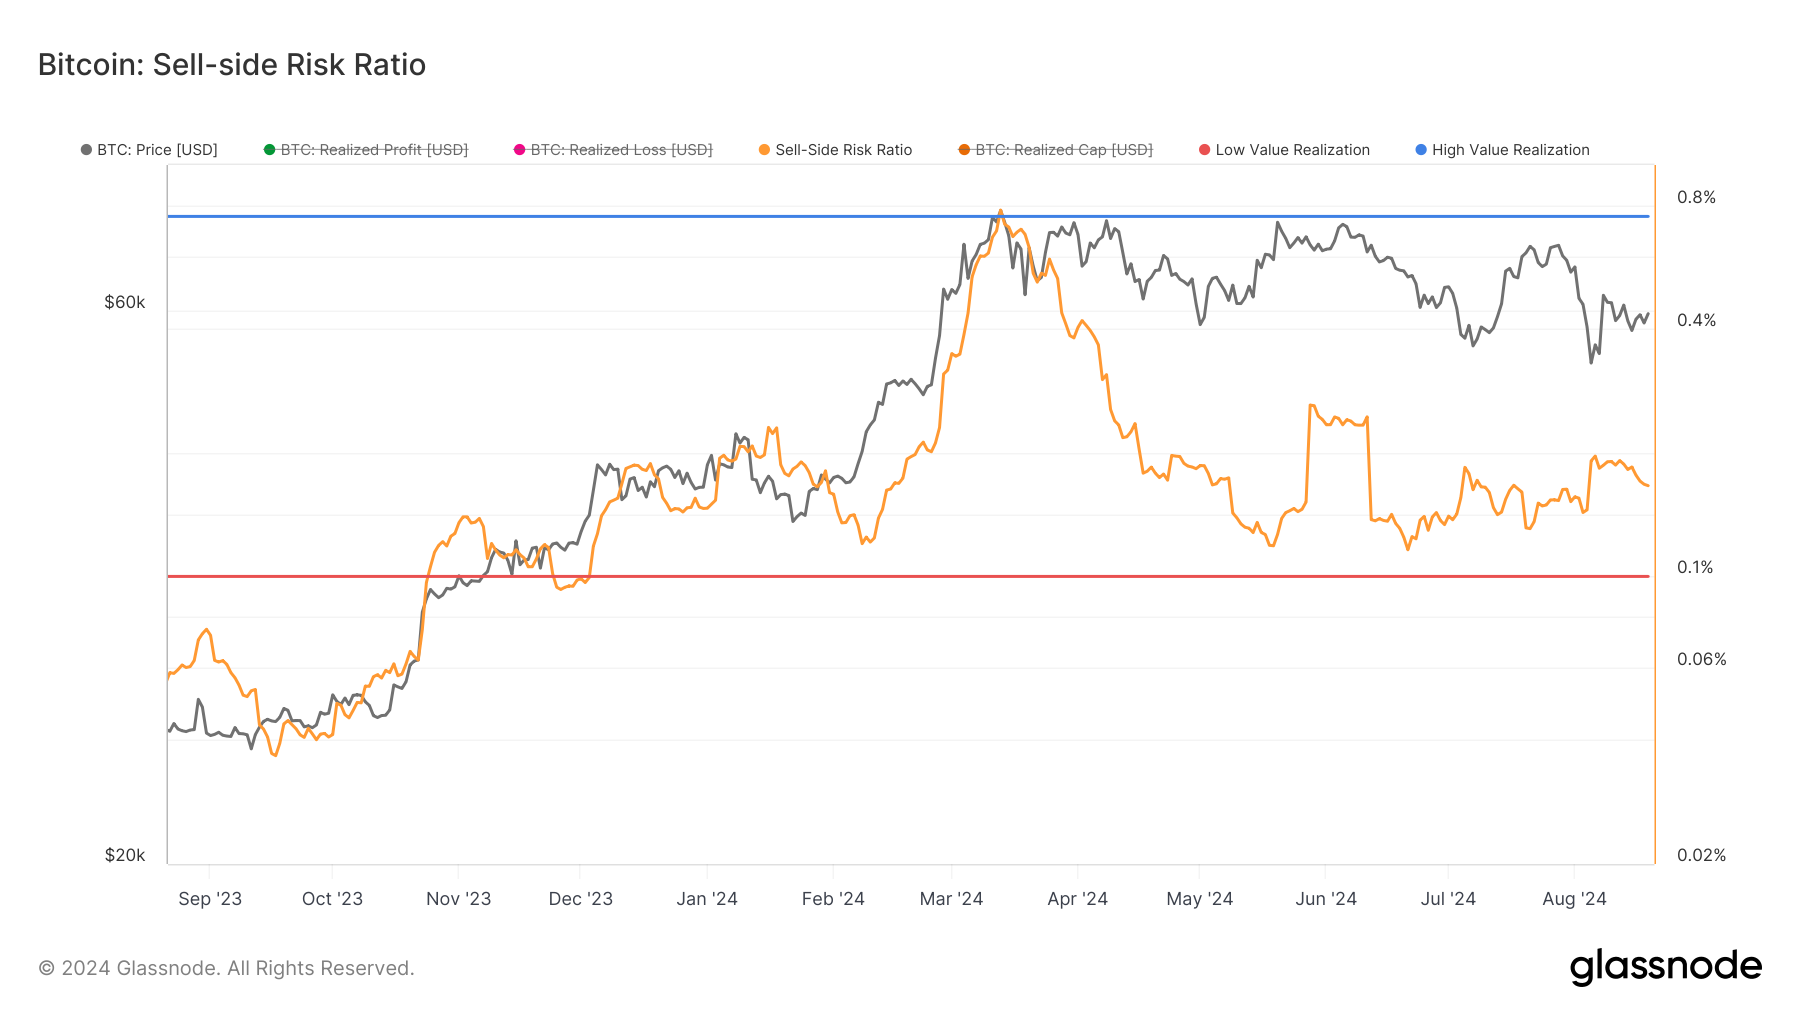
Additionally, the analysis above is supported by the Bitcoin Sell-Side Risk Ratio. This ratio compares the total value of coins spent to the realized market capitalization.
High Sell-Side Risk Ratios typically align with the later stages of a bull market, indicating low investor conviction and heightened volatility. On the other hand, a low ratio suggests reduced market volatility, often seen during consolidation phases and sideways price movements.
Such conditions usually precede the start of a new bull run. According to Glassnode, Bitcoin’s Sell-Side Risk Ratio has dropped to 0.16% from 0.71% in March, reinforcing the view that the current market may have more upside potential.
Read more: What Happened at the Last Bitcoin Halving? Predictions for 2024
Going by the laws above and the recent choppy nature of Bitcoin’s price, the coin is close to the bottom. Hence, while BTC may not reach $240,000 at the market top, it appears that the cycle is still in the early stages of the bull market.
However, if selling pressure increases, the coin might experience another downside. If this is the case, BTC may drop below $60,000 again.
Disclaimer
In line with the Trust Project guidelines, this price analysis article is for informational purposes only and should not be considered financial or investment advice. BeInCrypto is committed to accurate, unbiased reporting, but market conditions are subject to change without notice. Always conduct your own research and consult with a professional before making any financial decisions. Please note that our Terms and Conditions, Privacy Policy, and Disclaimers have been updated.
 Still in a Bull Run After Briefly Losing $60,000? Fresh Data Sheds Light")

