

- Aave reached a five month high above $143 with a 14% spike.
- Bitcoin broke to above $61,800, with price gaining 4% amid fresh crypto resilience.
Aave continued to outperform peers on August 21 with a sharp ascend to its highest level in five months. Meanwhile, Bitcoin price broke above $61,800 with a 4% surge in 24 hours.
AAVE spikes 14% to hit 5-month high
Decentralised finance (DeFi) protocol Aave (AAVE) was among the top gainers on Wednesday after surging more than 14% to hit highs of $143. Aave’s native utility and governance token reached the level amid huge whale activity in the past few days.
There was also positive news for Aave after the DeFi project’s Aave V3 deployed on ZKsync Era Mainnet.
Aave V3 is debuting on Era Mainnet, powered by @zksync, unlocking unprecedented scalability, privacy, and security while expanding the DeFi user base and new institutional use cases. pic.twitter.com/blNlUjsalX
— Aave Labs (@aave) August 21, 2024
AAVE price forecast
Rising to above $143, Aave’s price moved to its highest level since March 2024. This is the period when Bitcoin rode the halving mania and spot BTC exchange-traded funds to reach its all-time high.
AAVE’s push to current levels means the altcoin could eye fresh gains to the $177-$200 price area. However, the spike in AAVE price has also seen a sell signal flash on the daily chart.
Crypto analyst Ali Martinez shared this price outlook for AAVE earlier in the day.
The last four times the TD Sequential flashed a sell signal on the #AAVE daily chart, it was followed by an average correction of 27%. The same sell signal is now appearing, suggesting a potential drop for $AAVE. pic.twitter.com/12yZwLT5tp
— Ali (@ali_charts) August 21, 2024
Bitcoin bulls target breakout above $60k
While Bitcoin has struggled for momentum since the brutal sell-off in early August, bulls have remained largely undeterred. Buyers have shown great resolve in their quest to rally above the $60k.
In the past 24 hours, the benchmark crypto has climbed to above this crucial level and currently looks set to extend the slight advantage.
BTC has reached an intraday high above $61,838 on top crypto exchange Bitstamp.
BTC chart
The gains have the BTC/USD pair touch the 50-day simple moving average, accentuating the formation of an ascending triangle pattern. In technical analysts, the ascending triangle is seen as a bullish chart pattern where the resistance level follows a horizontal line.
Meanwhile, swing lows follow a rising trendline that forms a narrowing triangle as price looks to resolve on the upside.
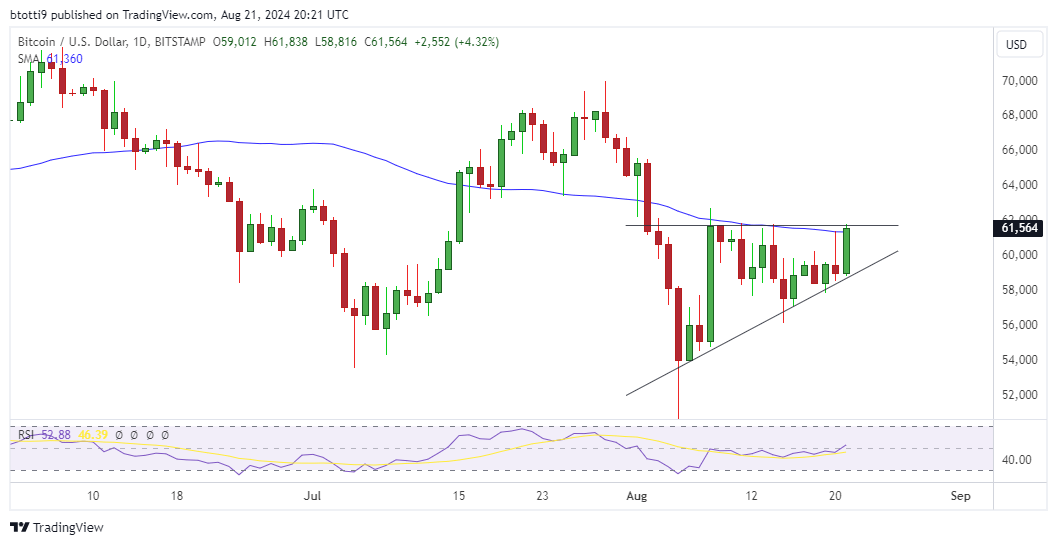
Bitcoin’s daily chart suggests this is the case for BTC since the dip to lows of $49,577 on August 5. Notably, the 50-day SMA currently acts as a robust hurdle. If bulls decisively break higher, price could target the key supply wall around $68,255.
However, should weakness resurface, the primary support area could be around $58,266 and then $55,800.


