

Polygon is on track for a major rally, with potential gains of 145% by year-end. Despite short-term challenges, key support levels and bullish indicators suggest that this could be a strong investment opportunity.
Support and resistance levels
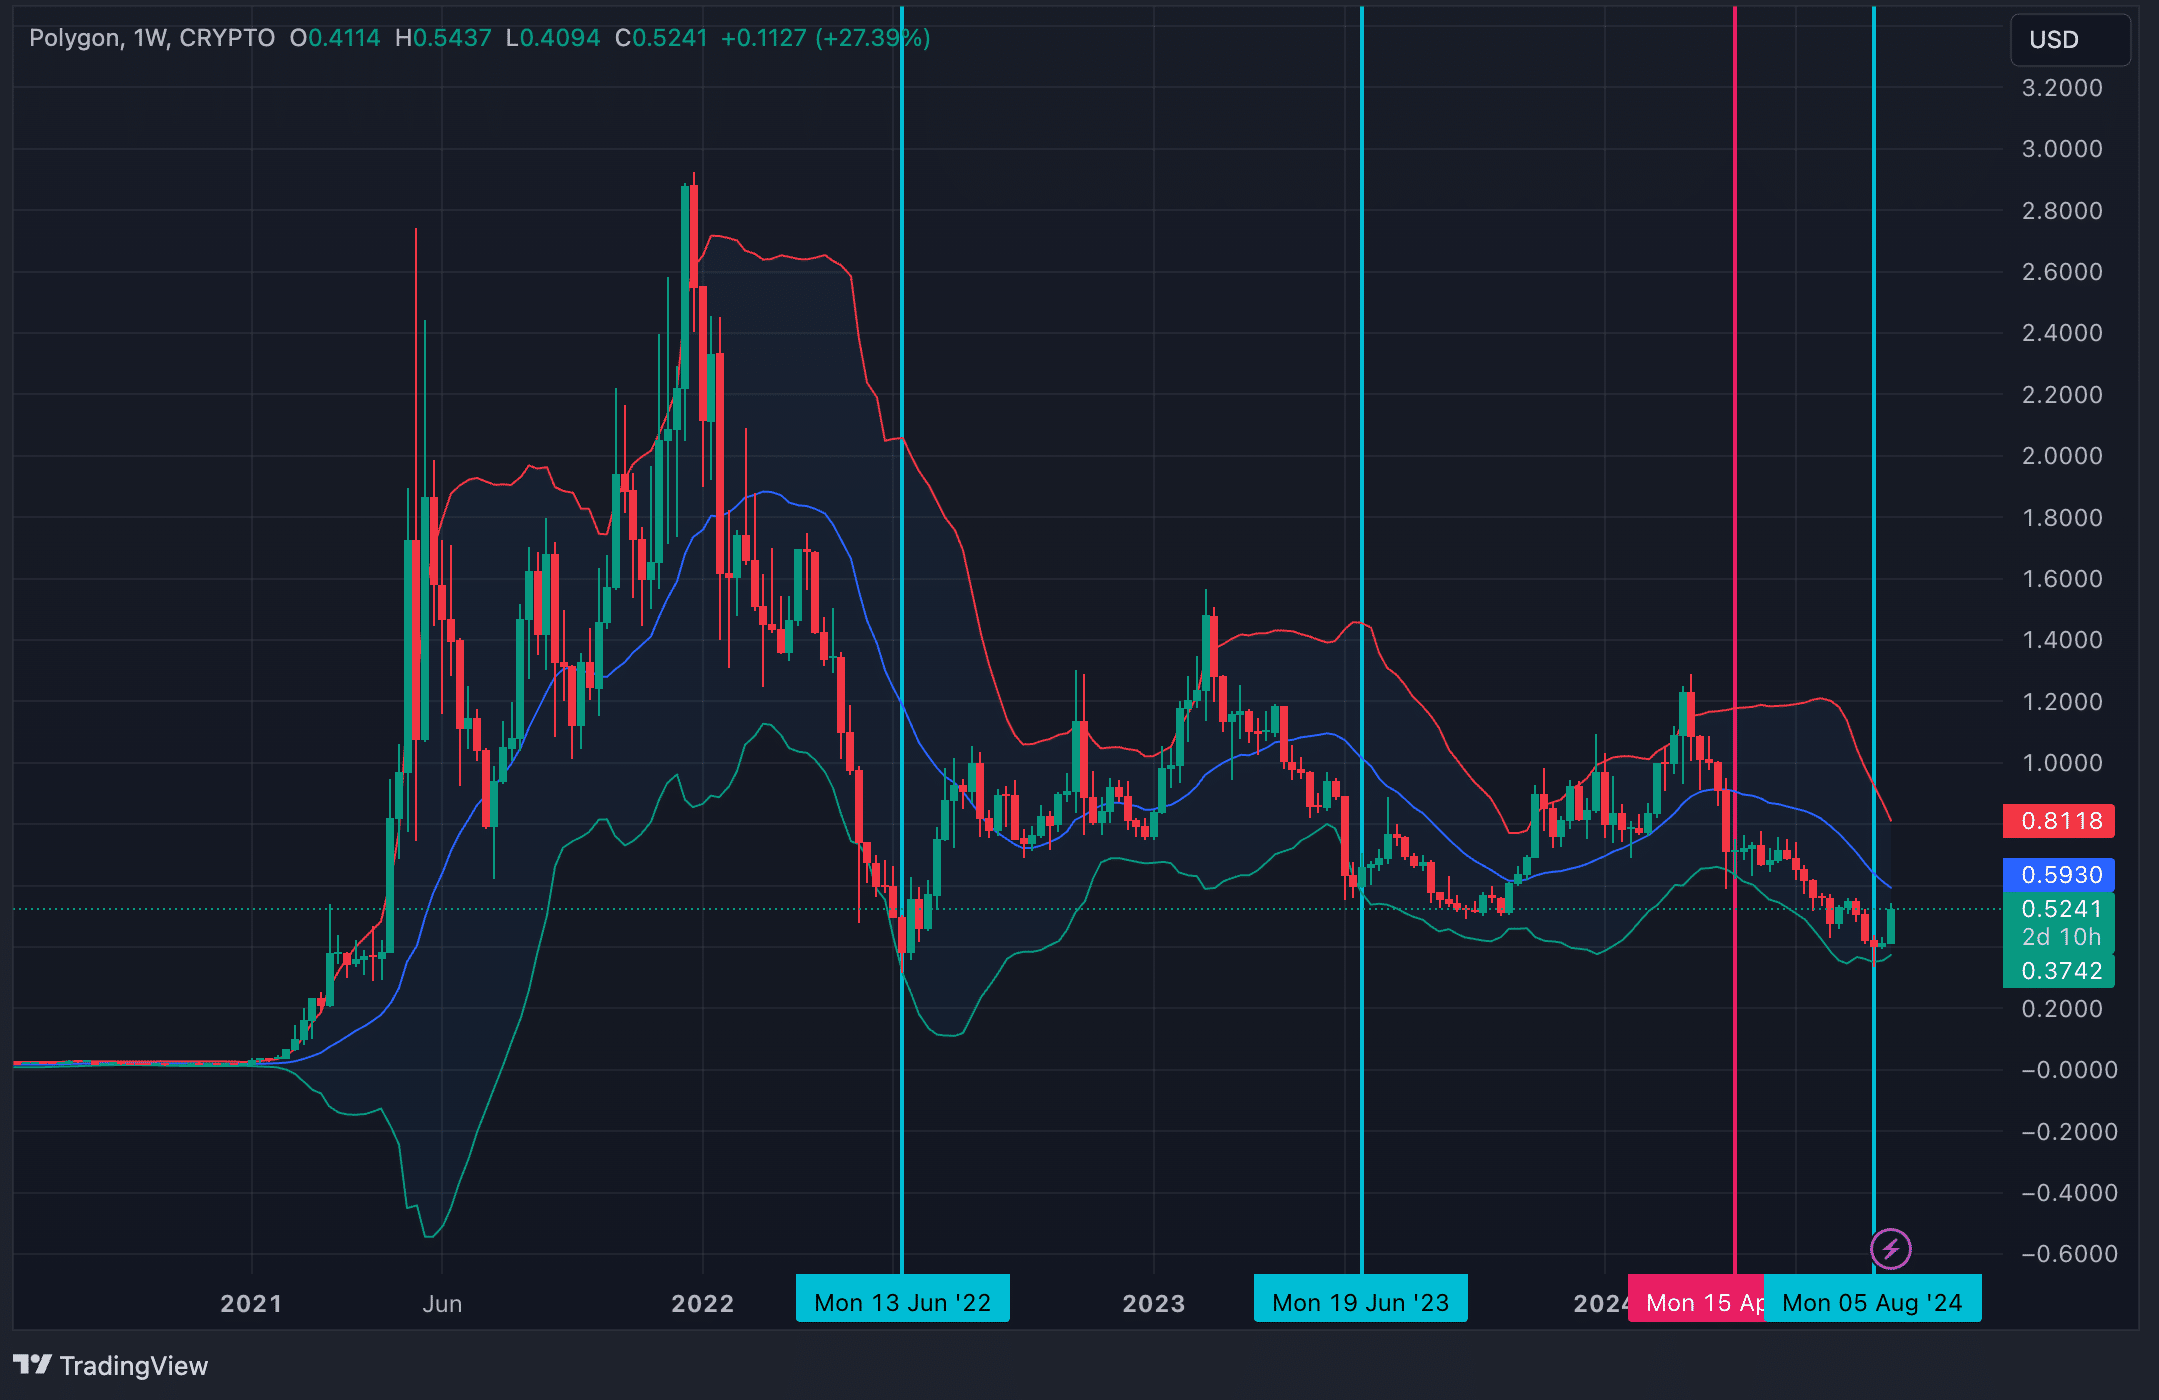
Polygon (MATIC) is currently trading above an important range, defined by two support levels: $0.33 and $0.50. The $0.33 level has demonstrated strong potential for upward moves in March-April 2021, June 2022, and August 2024. After hitting $0.33 in June 2022, MATIC rallied 311.44% in 140 days.
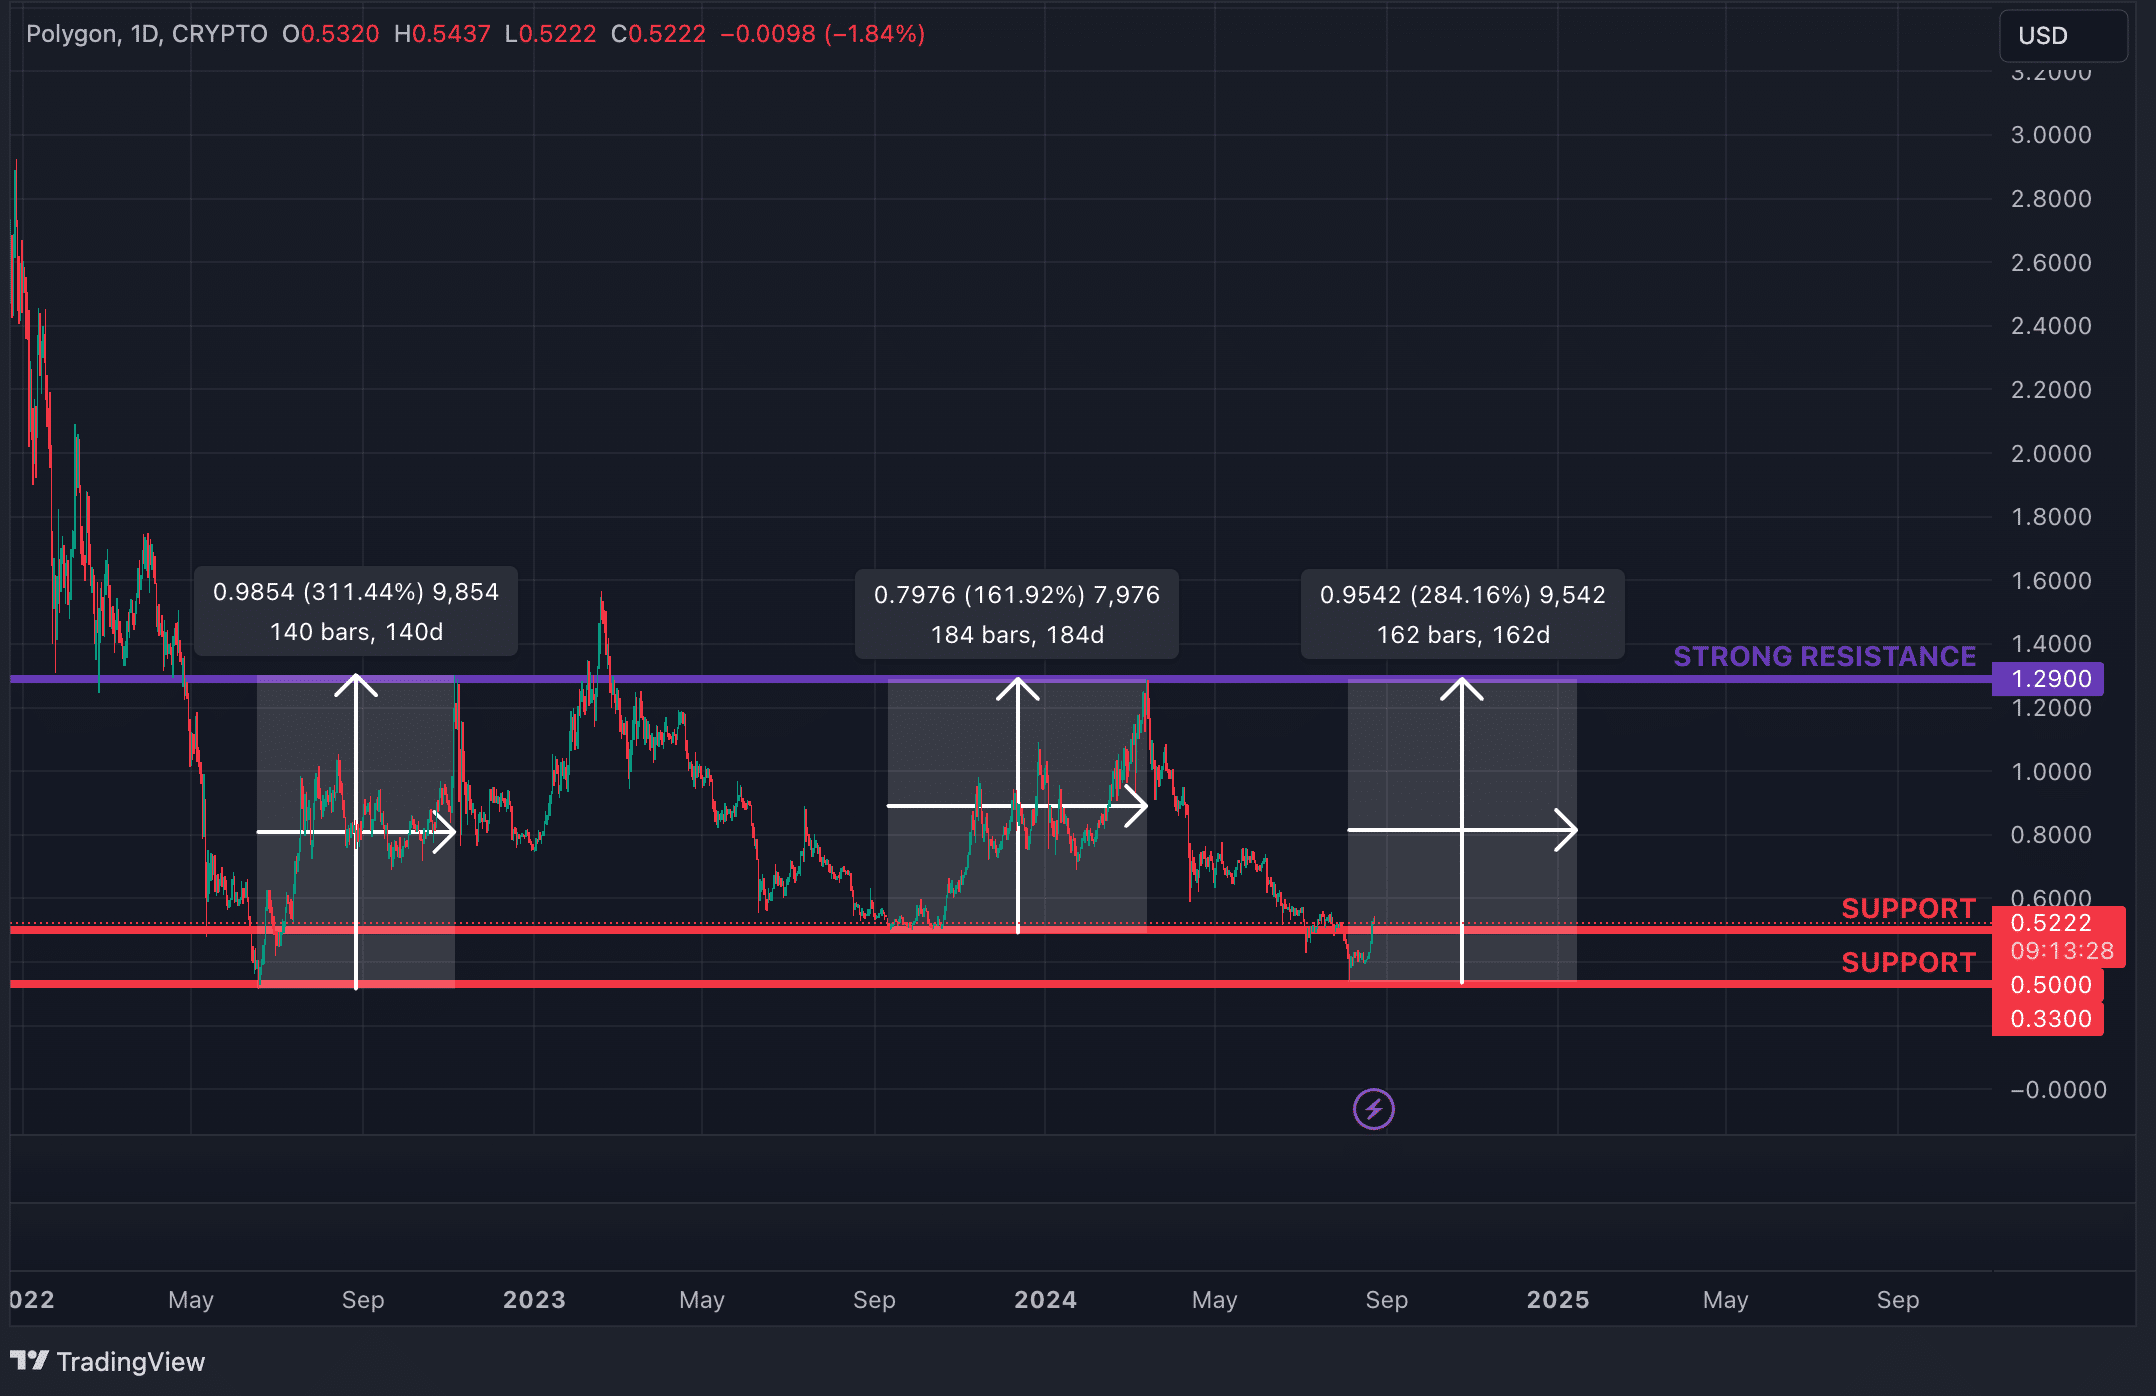
The second key support level at $0.50 has also influenced MATIC’s price trajectory. For the past two years, the asset has oscillated within a channel bounded by $0.50 on the lower end and $1.29 on the upper end. The $0.50 level served as a strong foundation for upward moves. During the August-October 2022 period, MATIC consolidated around $0.50 before initiating a 161.92% surge over 184 days. Historically, MATIC’s upward moves from these levels have met resistance near $1.29.
In the context of macroeconomic factors, particularly the anticipated September rate cuts and the seasonally weak performance of cryptocurrencies in September, MATIC may exhibit a period of consolidation around the $0.50 area before resuming its upward trajectory toward the $1.29 target by the end of the year. Although market conditions could potentially drive the price back to the $0.33 level, such a retracement would not undermine the fundamental bullish outlook. The zone between $0.33 and $0.50 represents a strategically advantageous entry point. Entering a long position within this range may yield superior returns compared to chasing the price at elevated levels during periods of heightened market activity in the future. Furthermore, other indicators also support the expectation of a continued upward trend.
Stochastic RSI
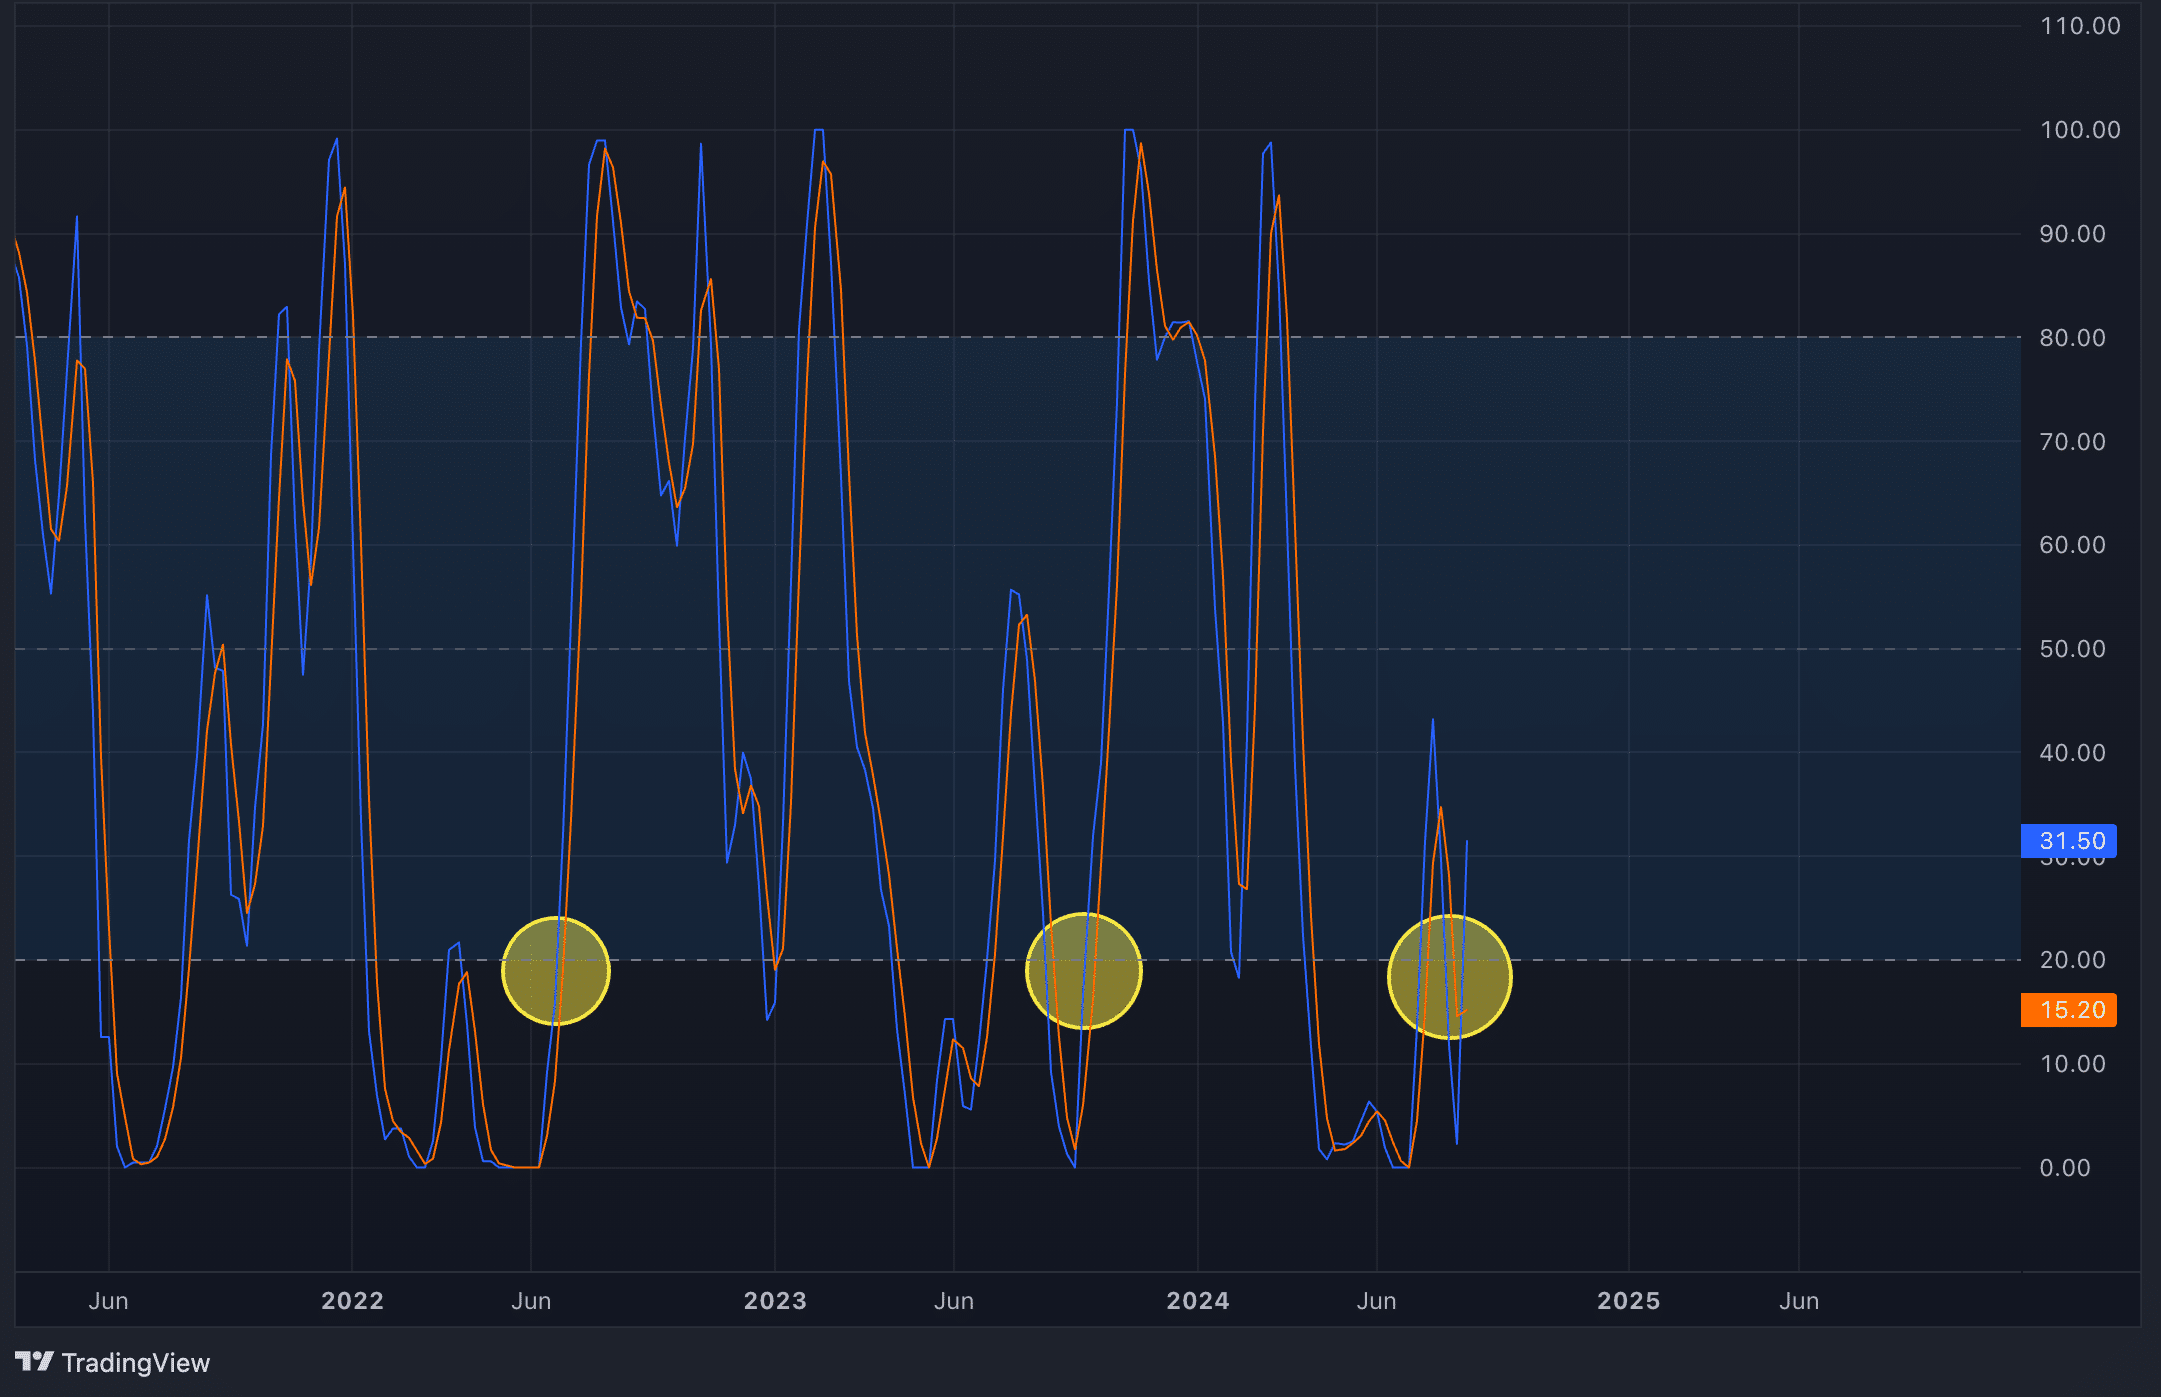
The Weekly Stochastic RSI signals a favorable entry point when it dips below 20. Although occasional false signals have occurred where the indicator dropped without triggering a substantial move, the area below 20 remains an attractive zone for initiating long positions. The momentum has shifted from bearish to bullish as the Stochastic RSI moved through the 20 level, consolidated, and has now crossed back above it, indicating renewed upward momentum.
50-day Moving Average
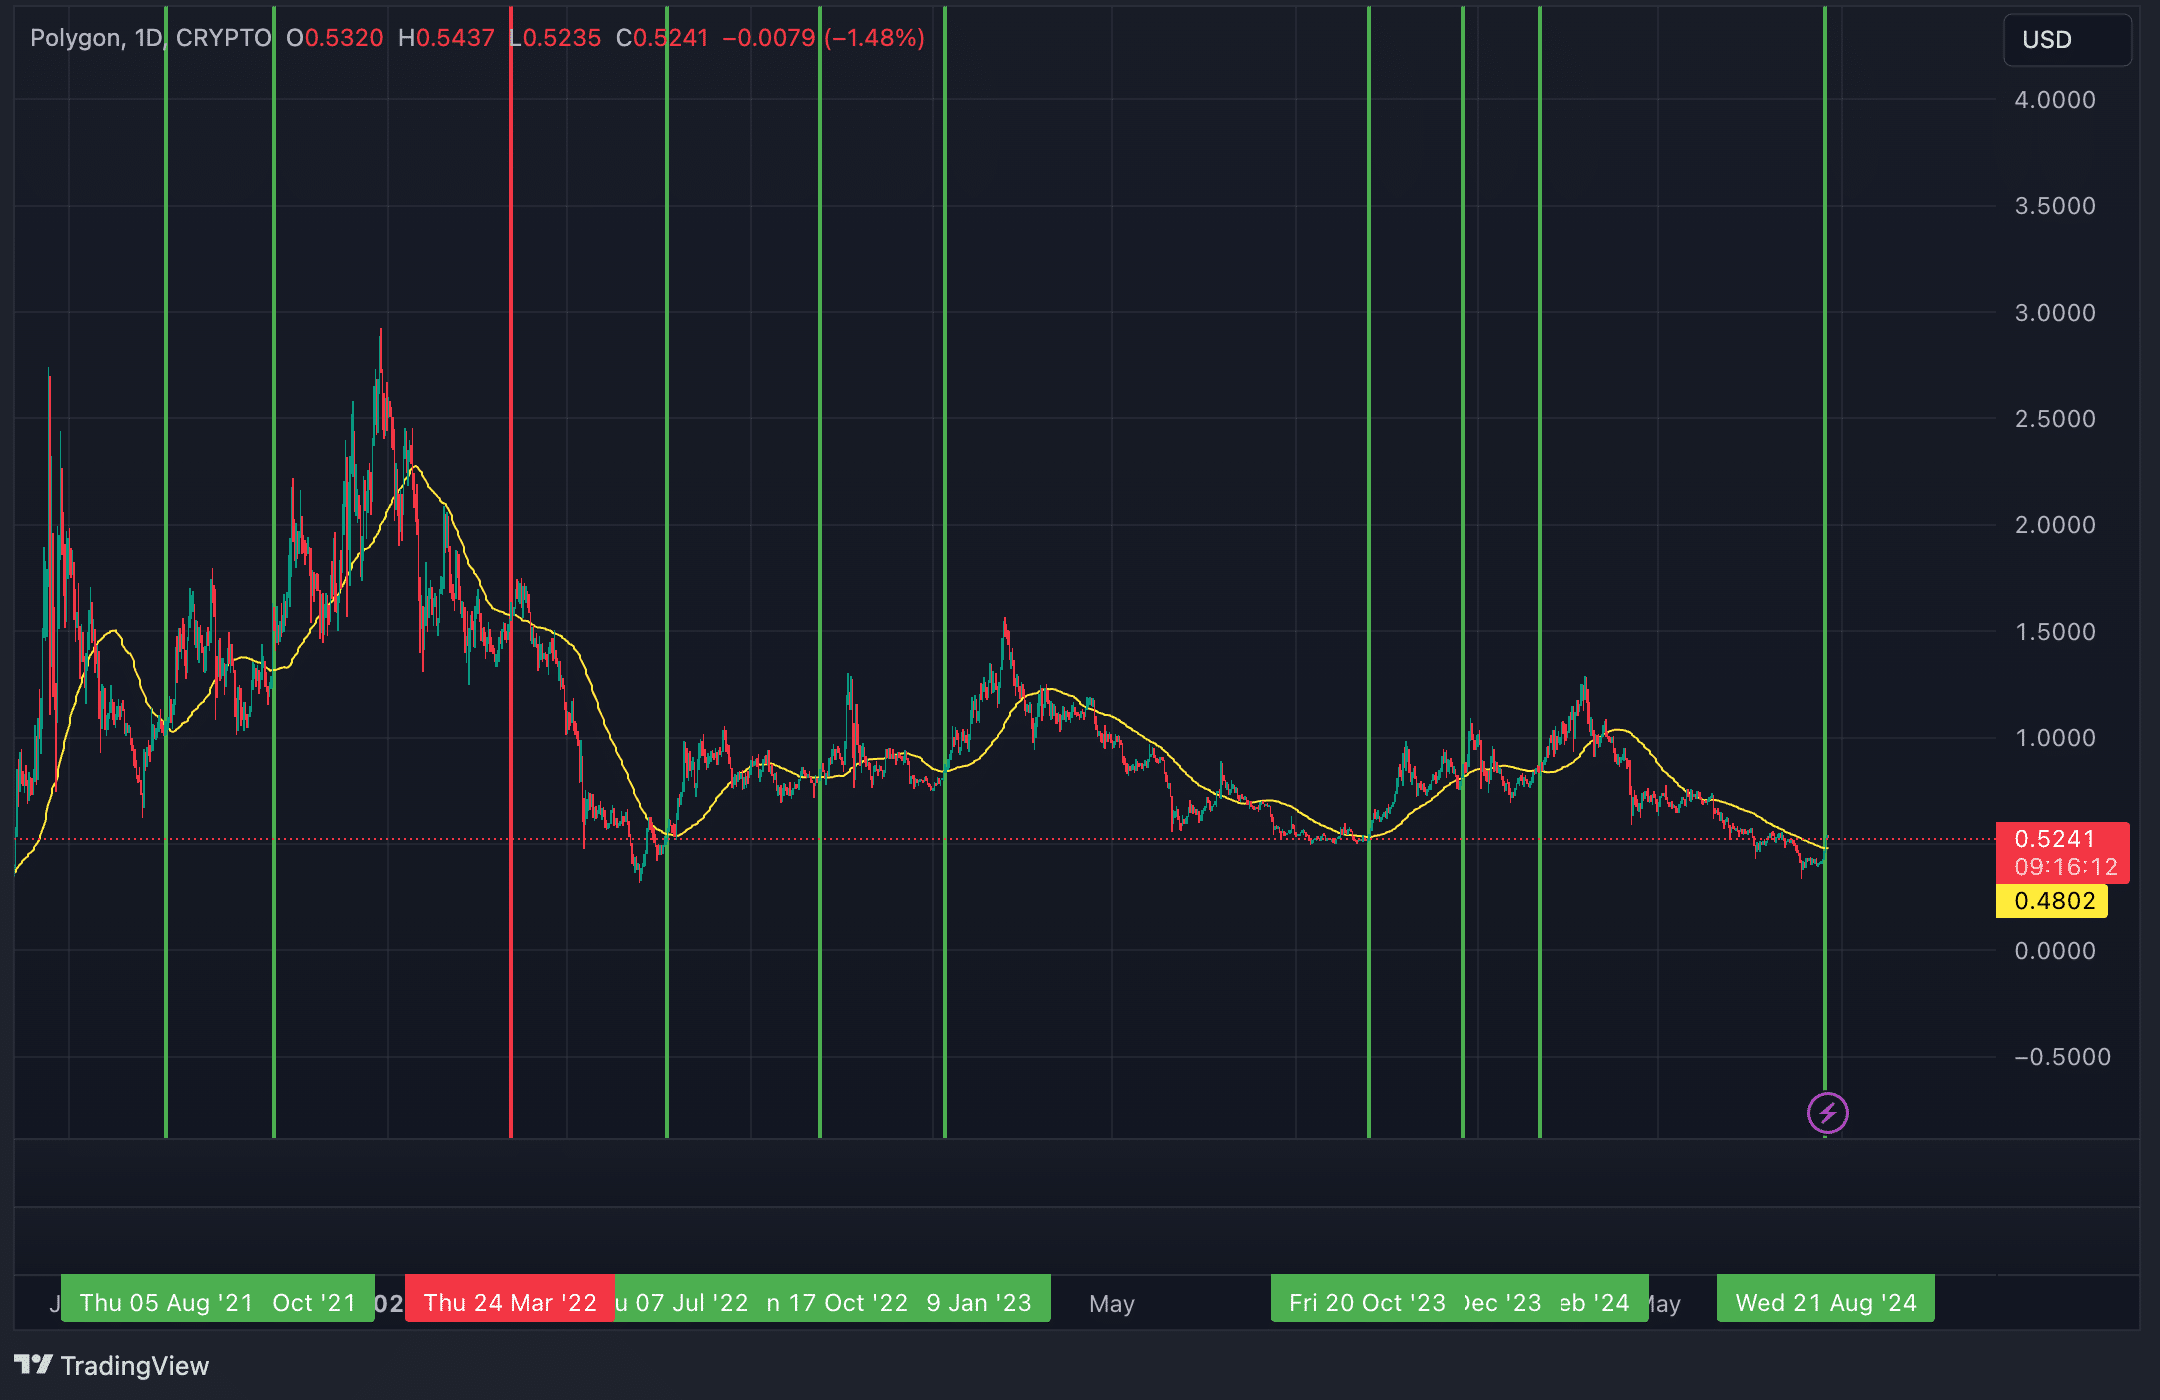
Since 2021, in 9 out of 10 instances where the price moved above the 50D MA on a daily timeframe and maintained a position at least 10% higher for three or more days, the market followed with a major upward movement. MATIC has recently mirrored this pattern and remained above the $0.50 level for several days.
Moving Average Convergence/Divergence
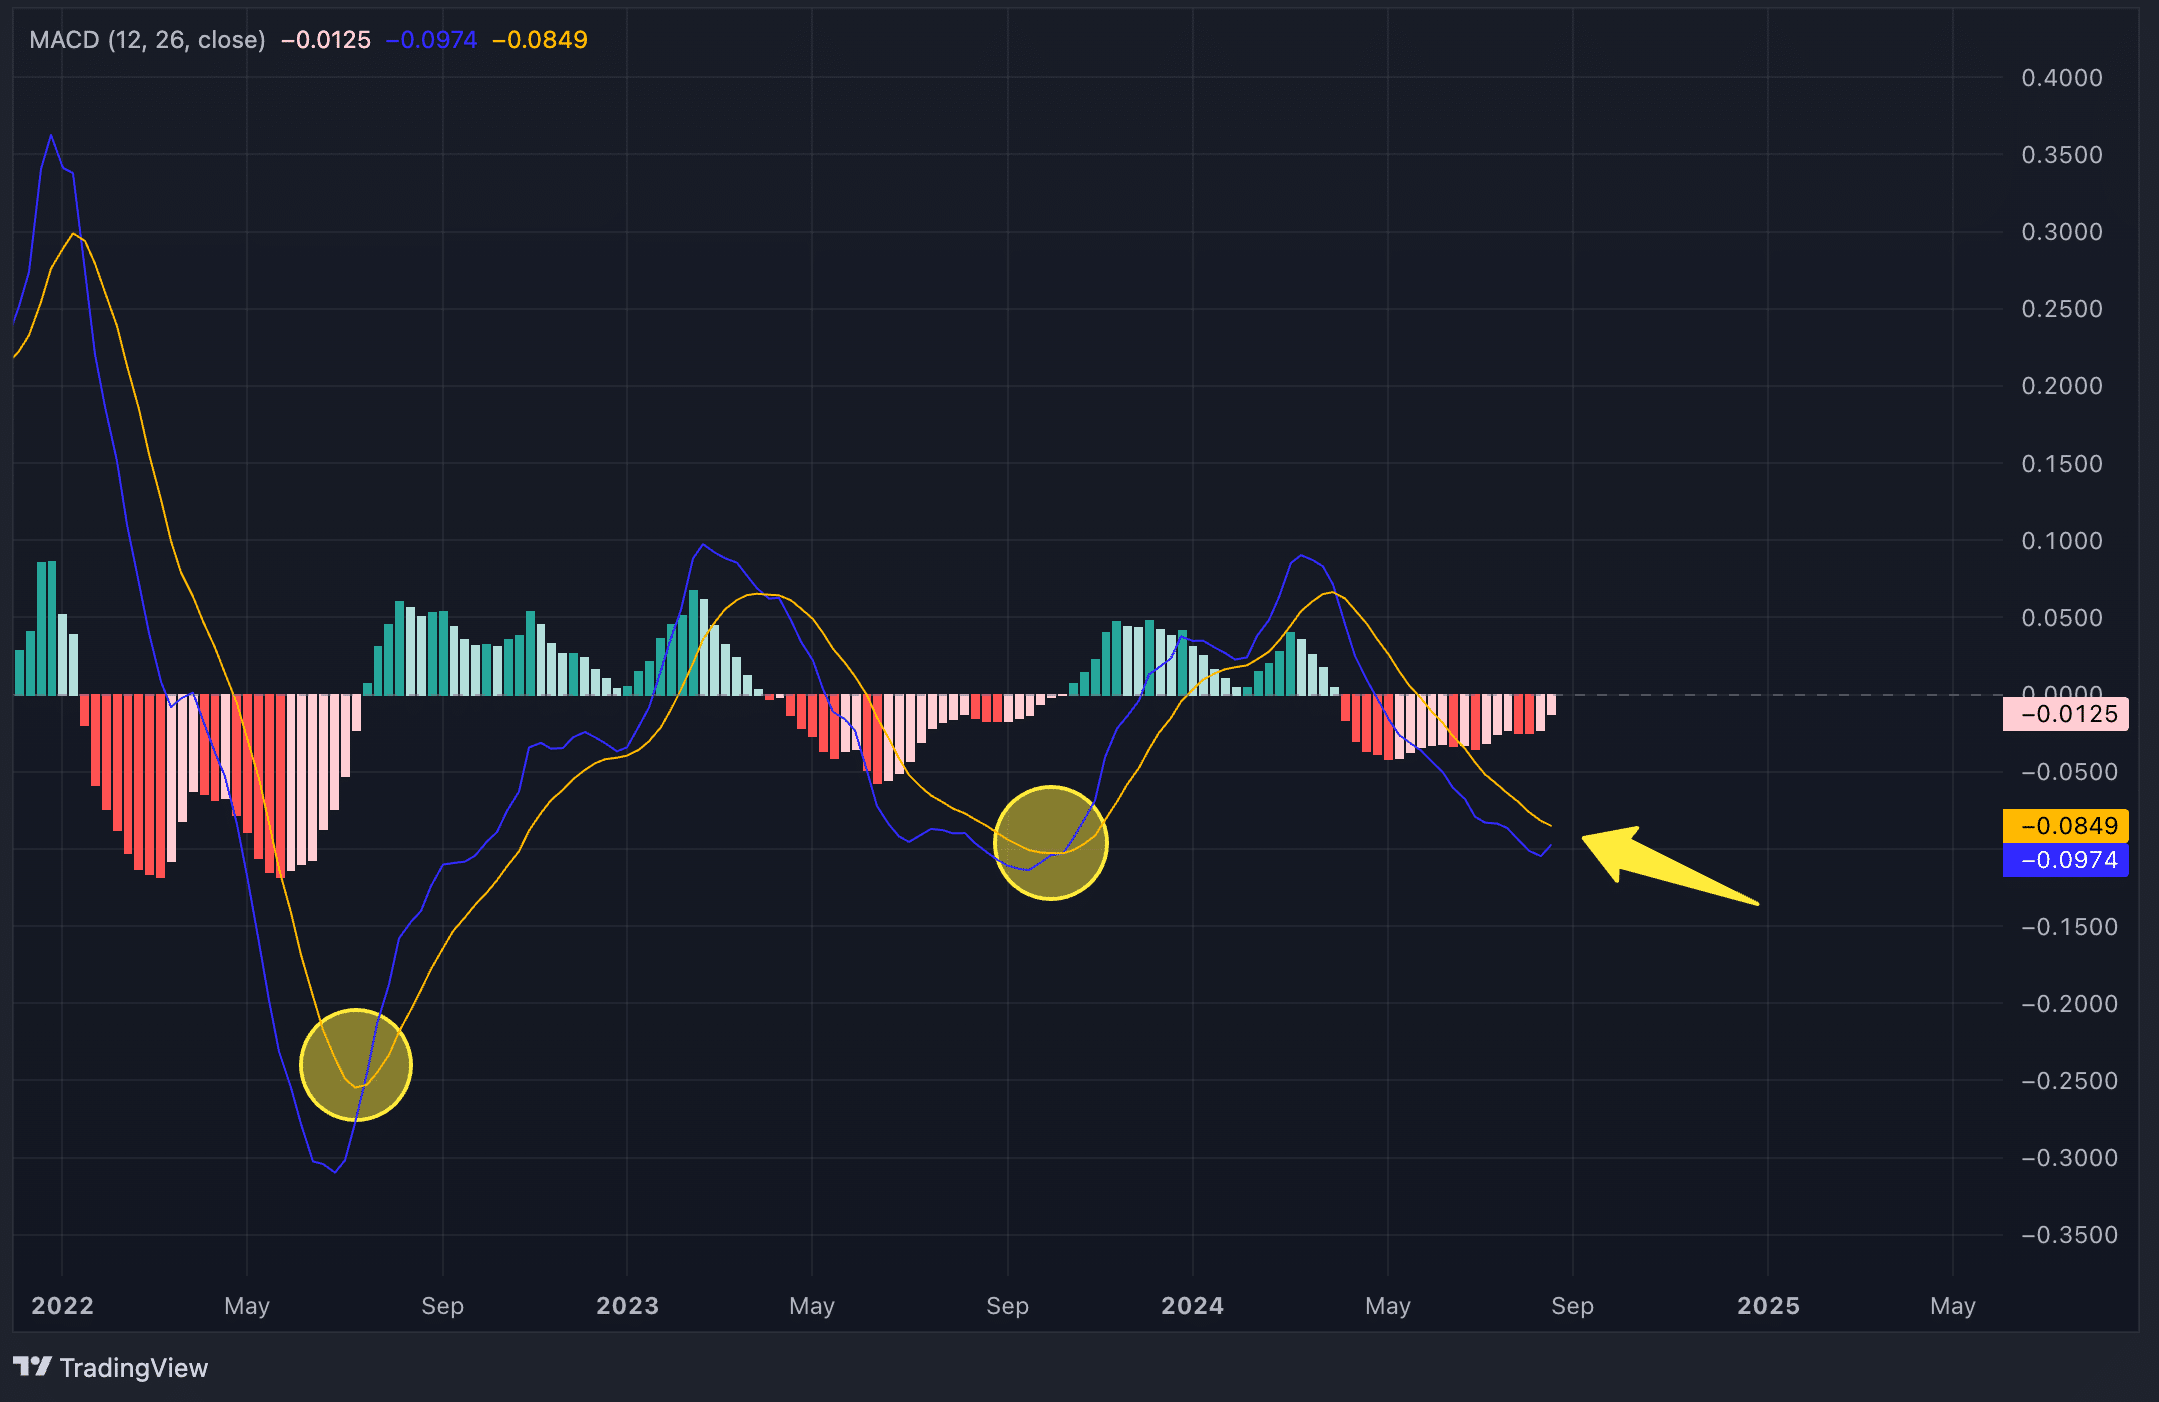
Another indicator that signals the potential for continued bullish momentum is the MACD. On the weekly timeframe, the histogram has started to shift positive, with the MACD line nearing a bullish crossover above the signal line. In the last two instances where this setup occurred, MATIC experienced substantial upward moves, which indicates a strong probability of a similar outcome this time.
Bollinger Bands
In three out of four instances where MATIC’s price touched the lower band, major upward moves followed. These occurred in June 2022, June 2023, and now in August 2024, which suggests a possible repeat of the pattern. The only exception was in April 2024, which turned out to be a false signal.
Strategic considerations
MATIC presents a long-term opportunity with strong upside potential, though short-term fluctuations may occur due to macroeconomic factors. A retracement to $0.33 or a consolidation around $0.50 is possible, but the year-end target of $1.29 remains likely.
Traders have three options:
- Enter long now: Entering a long position at the current level and holding until year-end could yield around 145%.
- Wait for a retracement: Those expecting the September rate cut to trigger a short-term market downturn may choose to wait for MATIC to drop to around $0.33 before entering. This approach could result in a return of about 290% by year-end.
- Short MATIC before going long: A more aggressive strategy would involve shorting MATIC down to $0.33 and then switching to a long position. However, successfully executing this strategy requires a high degree of accuracy in predicting a market decline, which is a challenging and speculative endeavor, even more so than the price analysis presented. While this scenario could be profitable, the risk is substantially higher.
Given the uncertainties involved, a safer approach would be to choose either the first or second option. In any case, the likelihood of major losses by year-end is low.
Disclosure: This article does not represent investment advice. The content and materials featured on this page are for educational purposes only.


