

Bitcoin is currently in a phase of consolidation and disbelief after weeks of aggressive volatility and uncertainty. This period follows a series of corrections and dull consolidations, which often precede significant market moves.
Historically, Bitcoin’s price action tends to build momentum during such phases, setting the stage for potentially explosive growth.
Prominent crypto analyst and investor TechDev has shared an intriguing analysis comparing Bitcoin’s current cycle to the Nasdaq’s historical performance. According to TechDev, the parallels between BTC and the Nasdaq suggest that the crypto market could be gearing up for an exciting upward trajectory.
As investors closely monitor these patterns, anticipation builds for the next big move in Bitcoin’s price. The coming weeks could be pivotal in determining whether this consolidation phase will lead to another strong rally.
Bitcoin Vs Nasdaq: Is a Macro Leg Imminent?
The Bitcoin market is currently grappling with significant uncertainty, despite the Federal Reserve (FED) Chairman Jerome Powell’s announcement last Friday, signaling a potential shift in policy with an anticipated interest rate cut in September.
While this news initially sparked optimism, the broader market remains apprehensive, reflecting the complex dynamics at play.
Amid this uncertainty, however, some investors and analysts maintain a positive long-term outlook for BTC. One such analyst is TechDev, who has recently provided an intriguing analysis comparing Bitcoin’s current monthly chart to the Nasdaq’s two-month chart from 2014. At that time, the Nasdaq was trading around $12 before embarking on a massive macro bull run that eventually reached its current levels near $70.

TechDev’s analysis suggests that Bitcoin may be on the cusp of a similar macro leg up, projecting a scenario where Bitcoin could experience a substantial rally, potentially mirroring the Nasdaq’s historic rise. This comparison is particularly compelling given the market structure and sentiment parallels between the two charts.
While the immediate market sentiment is cautious, with many traders still wary of potential downside risks, the long-term confluence indicated by TechDev’s analysis provides a more bullish perspective.
If Bitcoin follows a path similar to the Nasdaq, it could be poised for a significant upward trajectory in the coming months, defying the current market uncertainty and paving the way for new all-time highs.
BTC Price Action
Bitcoin is trading at $63,800 when writing, positioned above its daily 200 moving average (MA) at $63,420. This is a significant development, as three consecutive daily candles have closed above this level, signaling strength for the bulls.
The 1D 200 MA is a critical indicator for determining the continuation of a trend, and holding above it suggests that BTC could be poised to move toward higher levels.
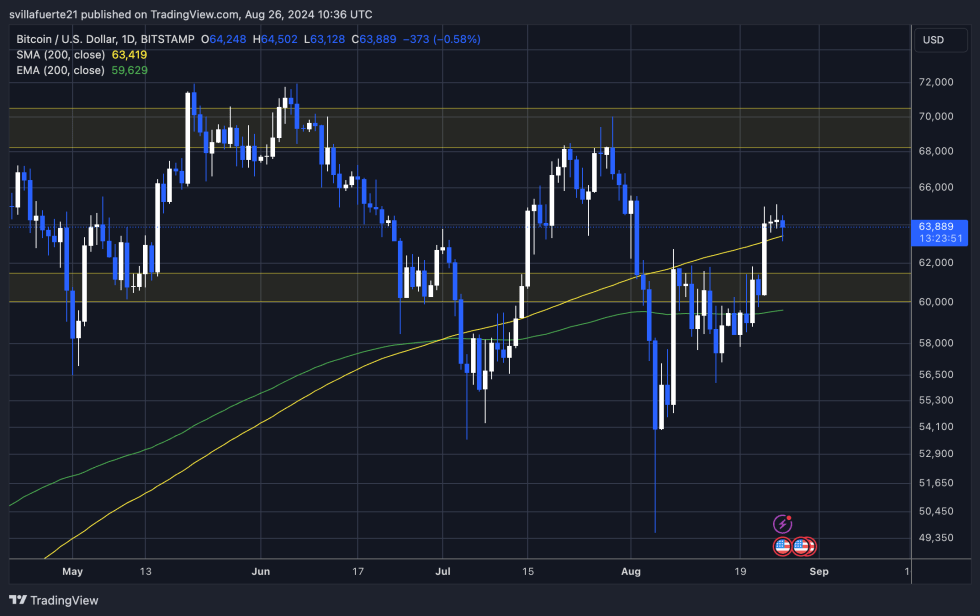
However, the market isn’t without its risks. There’s still the possibility that BTC could test lower demand around $61,300, which would still maintain the overall bullish structure. Testing this level might be necessary to gather momentum for the next leg up, but losing the 1D 200 MA would be concerning.
A drop below this crucial moving average could indicate weakening strength in the current uptrend and potentially signal a shift in market sentiment. Therefore, holding above the 1D 200 MA remains vital for sustaining Bitcoin’s bullish outlook.
Cover image from Dall-E, chart from Tradingview


