

Gert van Lagen, a prominent technical analyst, suggests that Bitcoin’s (BTC) price could reach unprecedented heights this cycle. In a recent post on X, van Lagen referred to Bitcoin’s weekly chart to back up his analysis.
Currently, Bitcoin is trading at $62,290. If van Lagen’s forecast holds true, BTC could break out and surge toward $200,000.
Bitcoin Could Be on the Brink of a Breakout
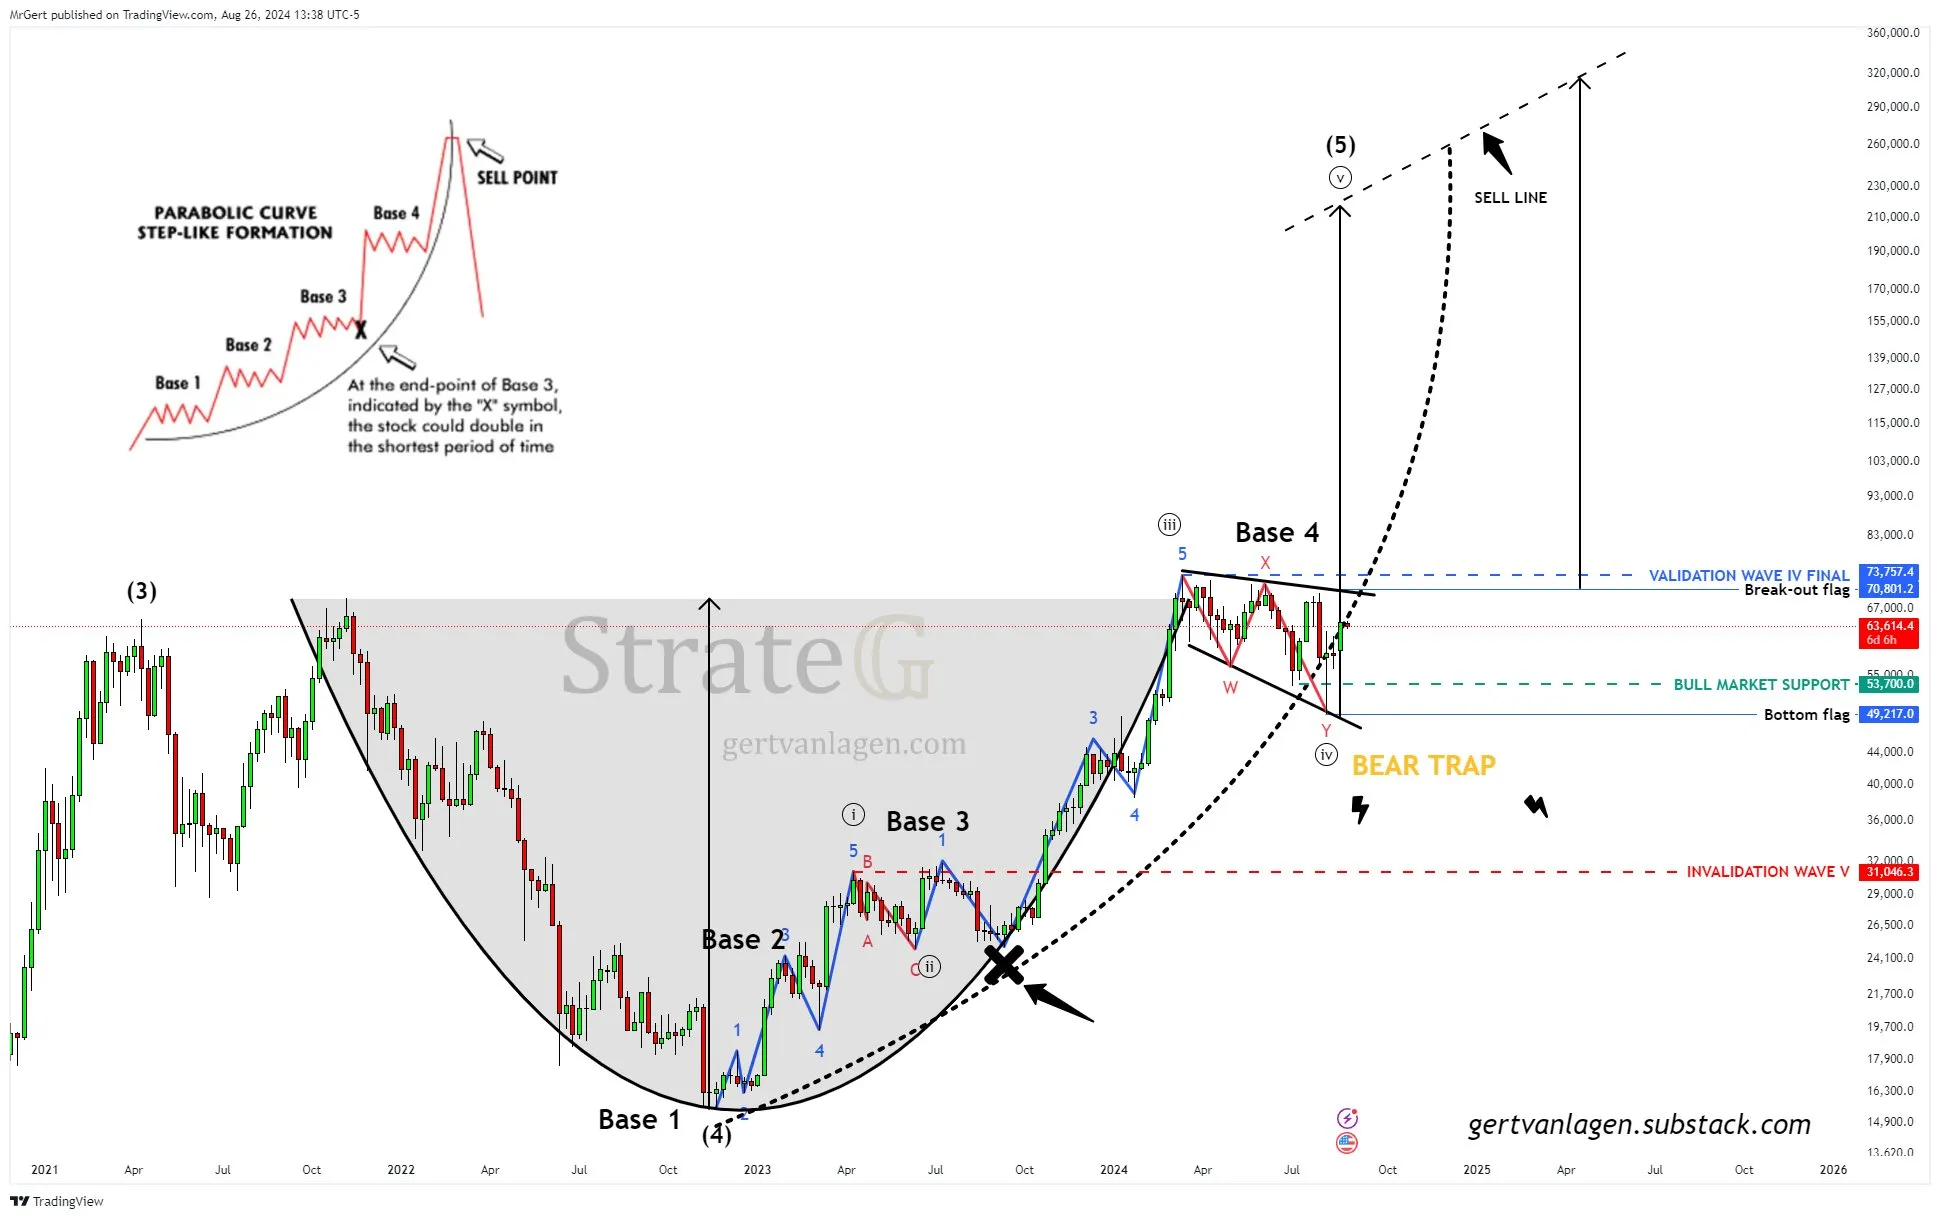
The analyst shared a step-like parabolic curve on the chart from the post. Given the illustration, it appears that BTC has been forming the pattern since 2021. The chart, as seen below, also shows a Cup and Handle pattern, which shows a bullish continuation.
The Cup and Handle pattern consists of a cup formation, which shows how a cryptocurrency moves from a downtrend to an uptrend. This is followed by a consolidation period (handle) before another breakout.
Per van Lagen, Bitcoin is currently moving around the handle, suggesting that the parabolic move to the “banana zone” is close. The banana zone, a term that Raoul Pal often uses, describes a period where BTC, alongside other cryptocurrencies, experienced explosive upward growth.
Read more: Bitcoin Dominance Chart: What Is It and Why Is It Important?
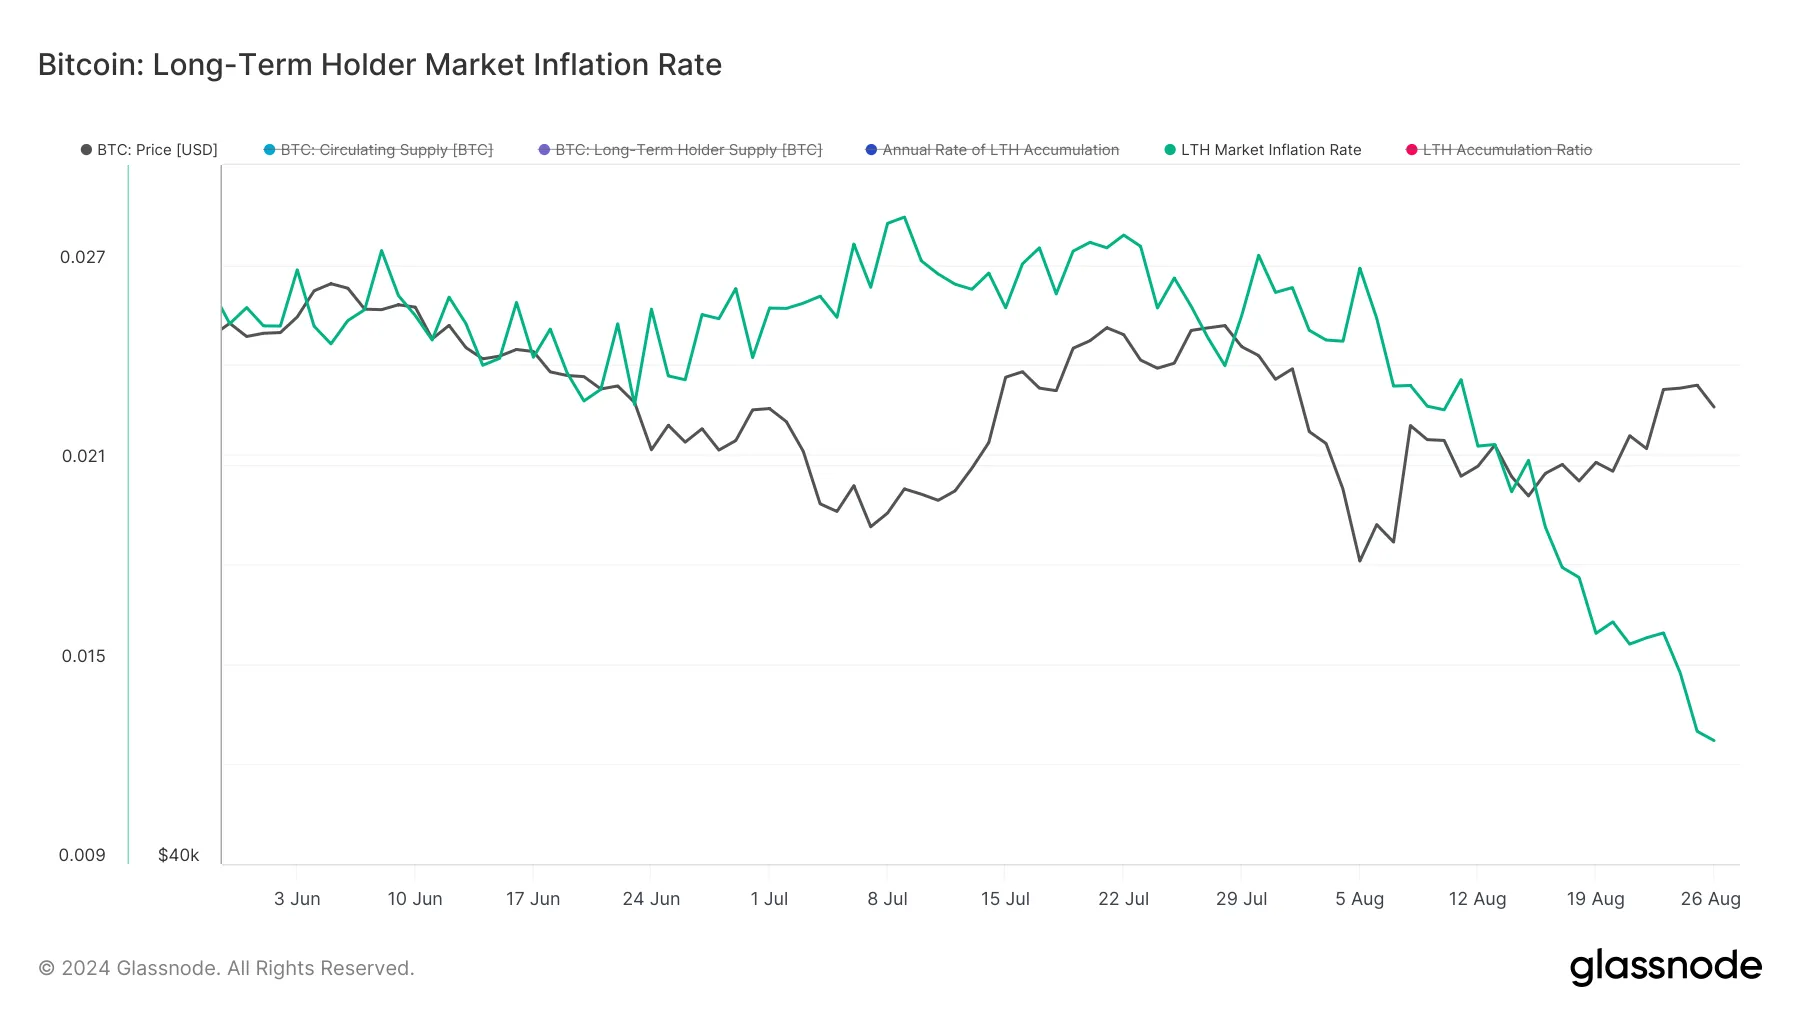
Furthermore, the Long-Term Holder Market Inflation, which measures the annual rate of accumulation or distribution, seems to align with the bias.
Higher market inflation values suggest that holders are shrinking their balance and adding pressure to the sell side. Lower values, on the other hand, indicate that long-term holders are accumulating at a faster rate.
Historically, Bitcoin price hits the cycle top at an extremely high reading. However, as shown below, the Long-Term Holder market inflation has been decreasing since the first week of August. If this decline continues, BTC could experience a notable rebound.
BTC Price Prediction: Short-Term Analysis Points to $64,000
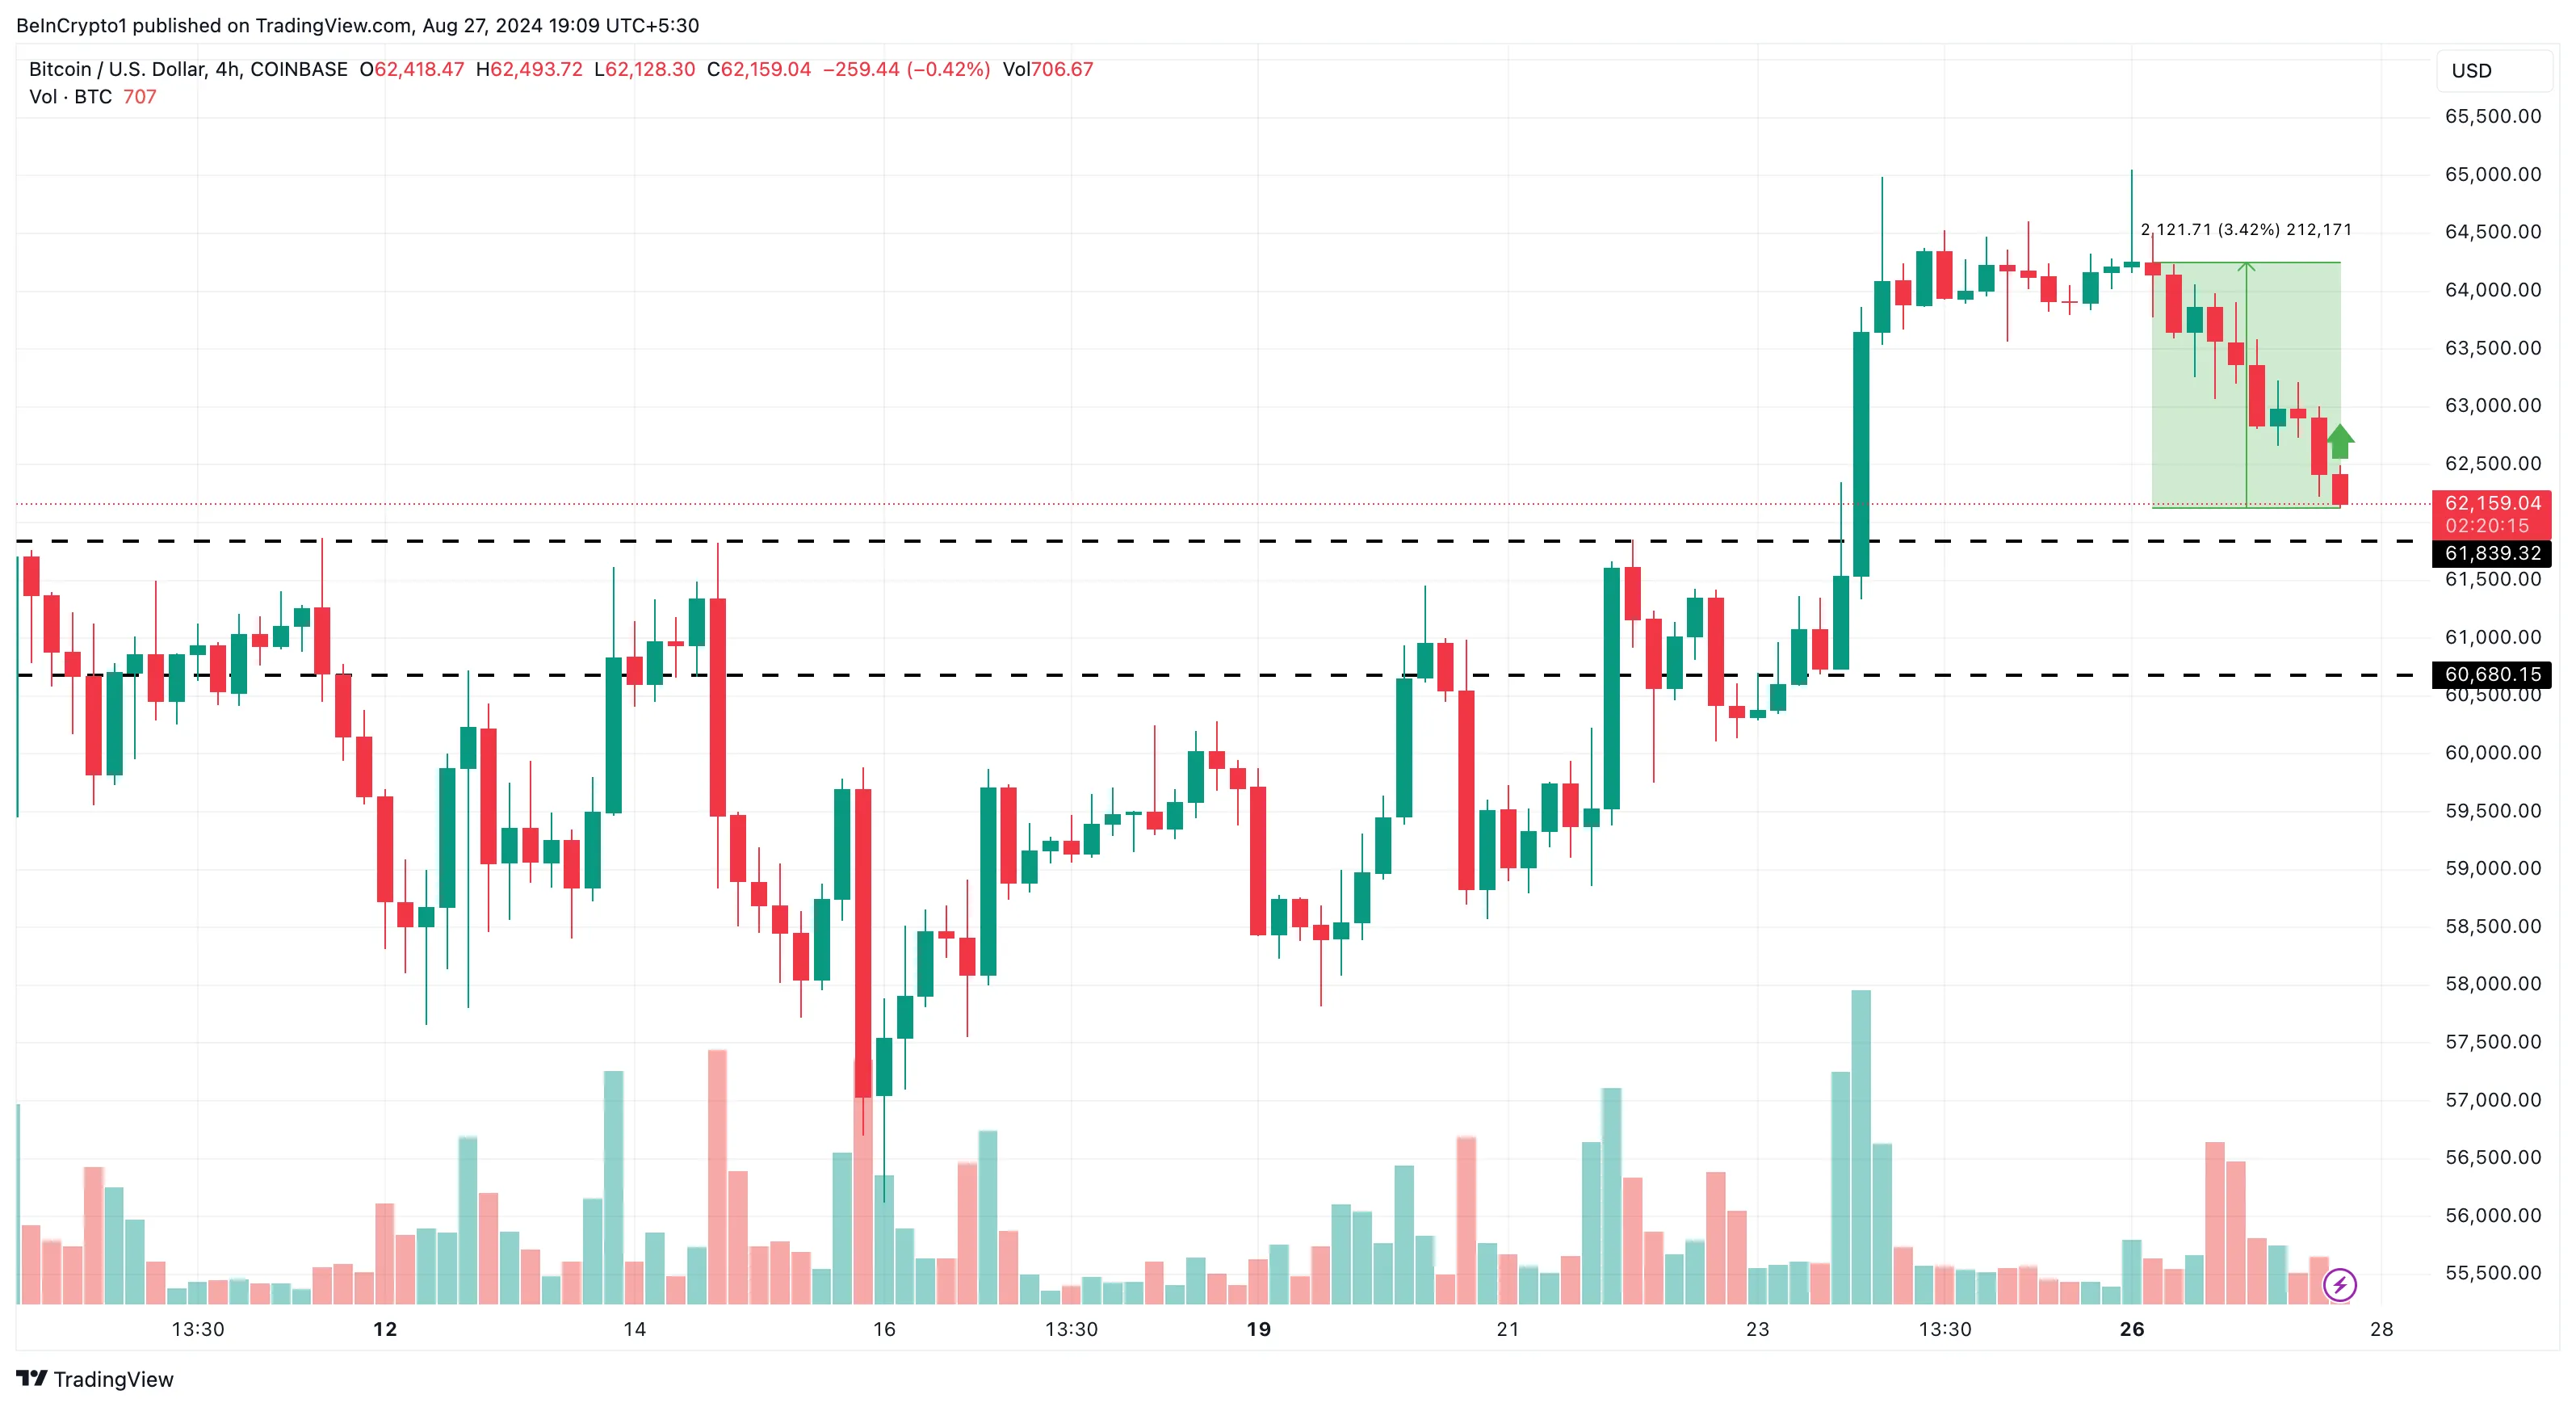
On the 4-hour chart, Bitcoin shows its readiness to exit the current drawdown. If validated, this buy signal could send the cryptocurrency’s price toward $64,240.
However, it’s important to note that the $61,839 and $60,680 levels are critical for BTC. If Bitcoin falls below $61,839, its value could decline further to $60,680. Conversely, if bulls defend this zone, the price is likely to rise above $64,000.
Beyond the technical analysis, Bitcoin ETFs have experienced significant inflows for nearly ten consecutive days. This trend mirrors the conditions that led to Bitcoin’s all-time high in March. If these inflows continue into the next month, Bitcoin’s price could rally toward $70,000.
Read more: What Is a Bitcoin ETF?
Similarly, analyst Michaël van de Poppe suggests that BTC could reach a new all-time high if it holds above $62,000.
“Bitcoin broke through $61.5-62K as the crucial resistance zone. I’d prefer to see that level as a retest and hold as support. Then, we’ll see a new run towards the all-time high,” van de Poppe explained.
However, if BTC fails to maintain its momentum above $61,839, this bullish outlook might be invalidated. In that scenario, the cryptocurrency could face a deeper correction, potentially dropping below $60,000.
Disclaimer
In line with the Trust Project guidelines, this price analysis article is for informational purposes only and should not be considered financial or investment advice. BeInCrypto is committed to accurate, unbiased reporting, but market conditions are subject to change without notice. Always conduct your own research and consult with a professional before making any financial decisions. Please note that our Terms and Conditions, Privacy Policy, and Disclaimers have been updated.


