

Binance Coin price continued its strong comeback, driven by rising volumes in its decentralized exchanges, higher non-fungible token sales, anticipation of Changpeng Zhao’s release, and positive technicals.
The Binance Coin (BNB) price surged to a high of $616 on Friday, Sept. 27, its highest point since June 27.
Data shows that the BNB Smart Chain ecosystem is thriving. According to CryptoSlam, sales of its NFTs jumped by nearly 40% to $4.1 million in the past seven days. Its weekly increase was the second-largest, after Bitcoin, which rose by 78% to $21.8 million.
The most popular NFTs on the chain were Luxewalker, Primary Energy Pool, AkitaNFT, and Paraluni Perpetual Bond.
Further data revealed that the volume on BNB’s decentralized exchange jumped by 52% in the last seven days to $5.2 billion. BNB has become the third-largest blockchain for DEXes, behind Ethereum and Solana, which processed transactions worth $8.45 billion and $6.53 billion, respectively.
The biggest BNB DEX networks were PancakeSwap, Dodo, and Uniswap, which handled tokens worth $4.4 billion, $364 million, and $247 million, respectively.
BNB’s DeFi total value locked has risen by over 13% in the last 30 days, a better performance than Ethereum, Solana, and Tron.
Another catalyst for Binance Coin’s rise is the growing anticipation of Changpeng Zhao’s release after serving his four-month sentence. Zhao is the largest holder of BNB, with the top ten wallets holding 75% of the tokens. Analysts expect that BNB, and other cryptocurrencies could stage a strong comeback when he is released.
BNB price has formed an inverse H&S pattern
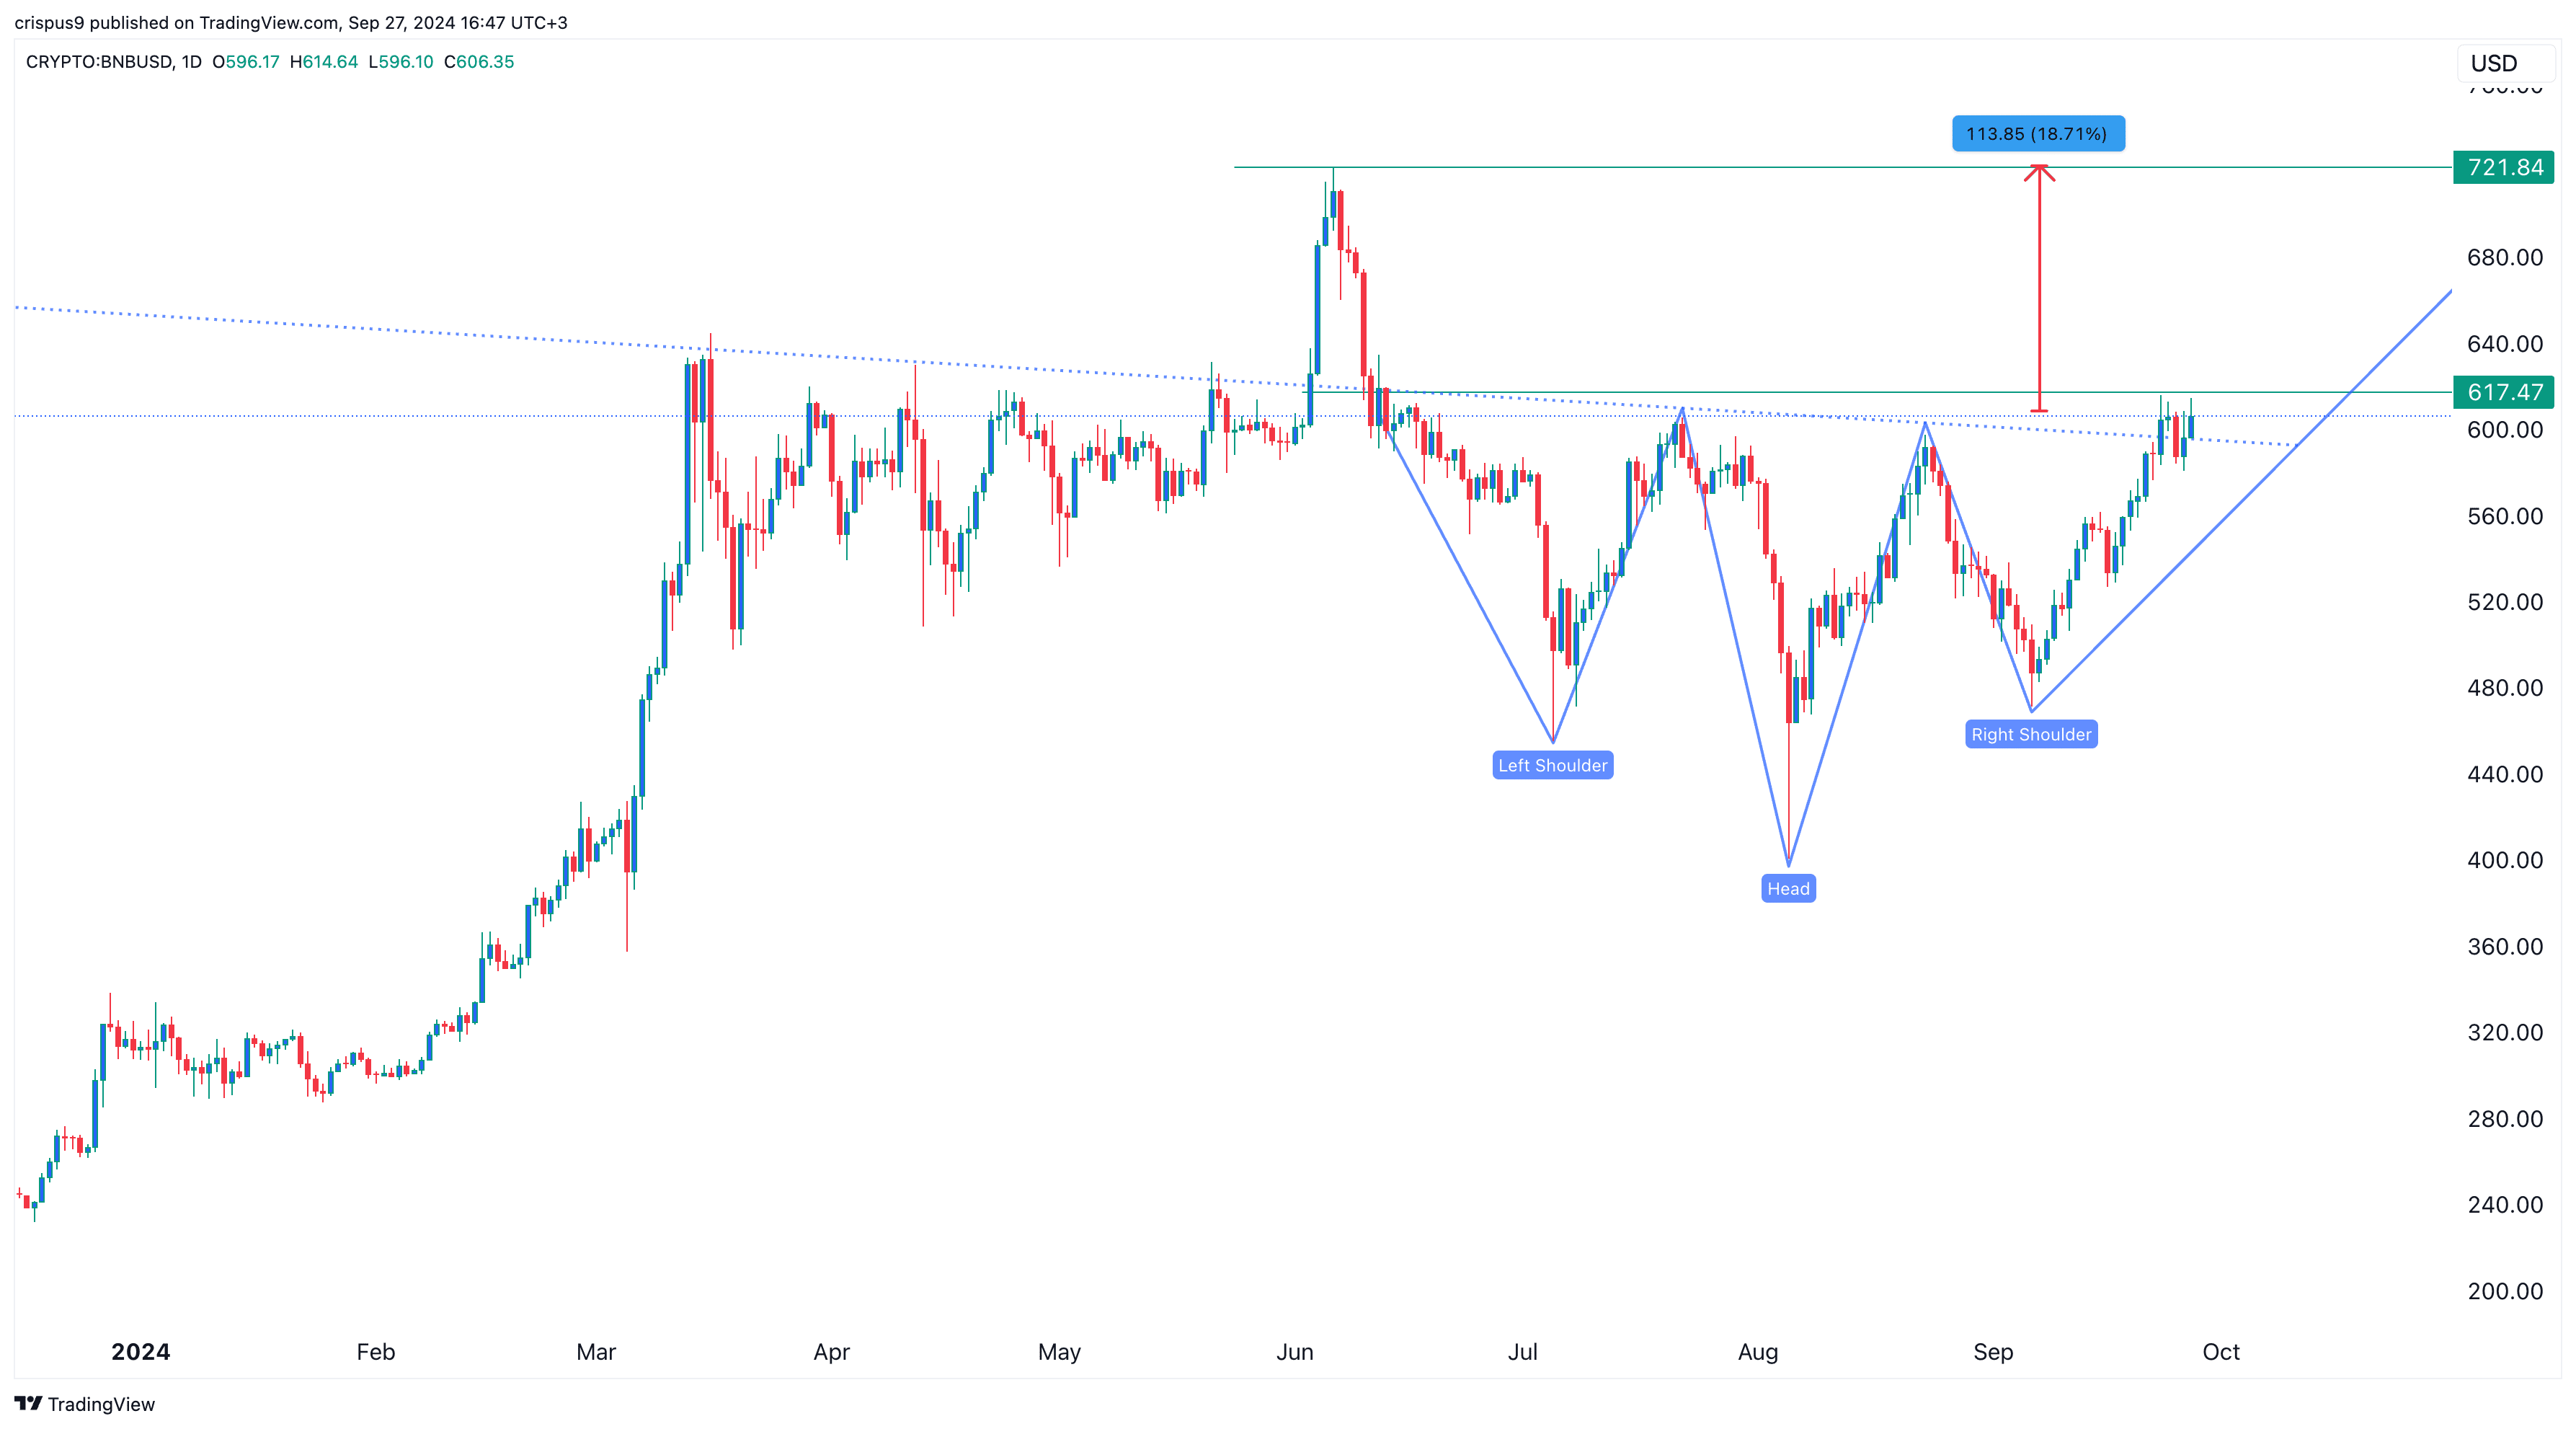
Meanwhile, Binance Coin has formed a rare bullish chart pattern that could push it higher. It has formed an inverse head and shoulders pattern, shown in blue in the chart below. On Friday, BNB’s price was near its neckline.
It has also formed a small bullish flag pattern, a popular continuation signal. Additionally, it remains above the 50-day and 100-day Exponential Moving Averages. Therefore, a break above the key resistance point at $617 could indicate further gains, potentially driving the price to the year-to-date high of $721, which is about 20% above the current level.


