

The Bitcoin price held steady at $87,500 on Friday, a level where it has remained for the past few days. This price is approximately 14.95% higher than this month’s low of $76,425, its lowest point since March 11th. This article explores whether the Bitcoin price has recovered and what investors can anticipate.
Bitcoin Price Technical Analysis
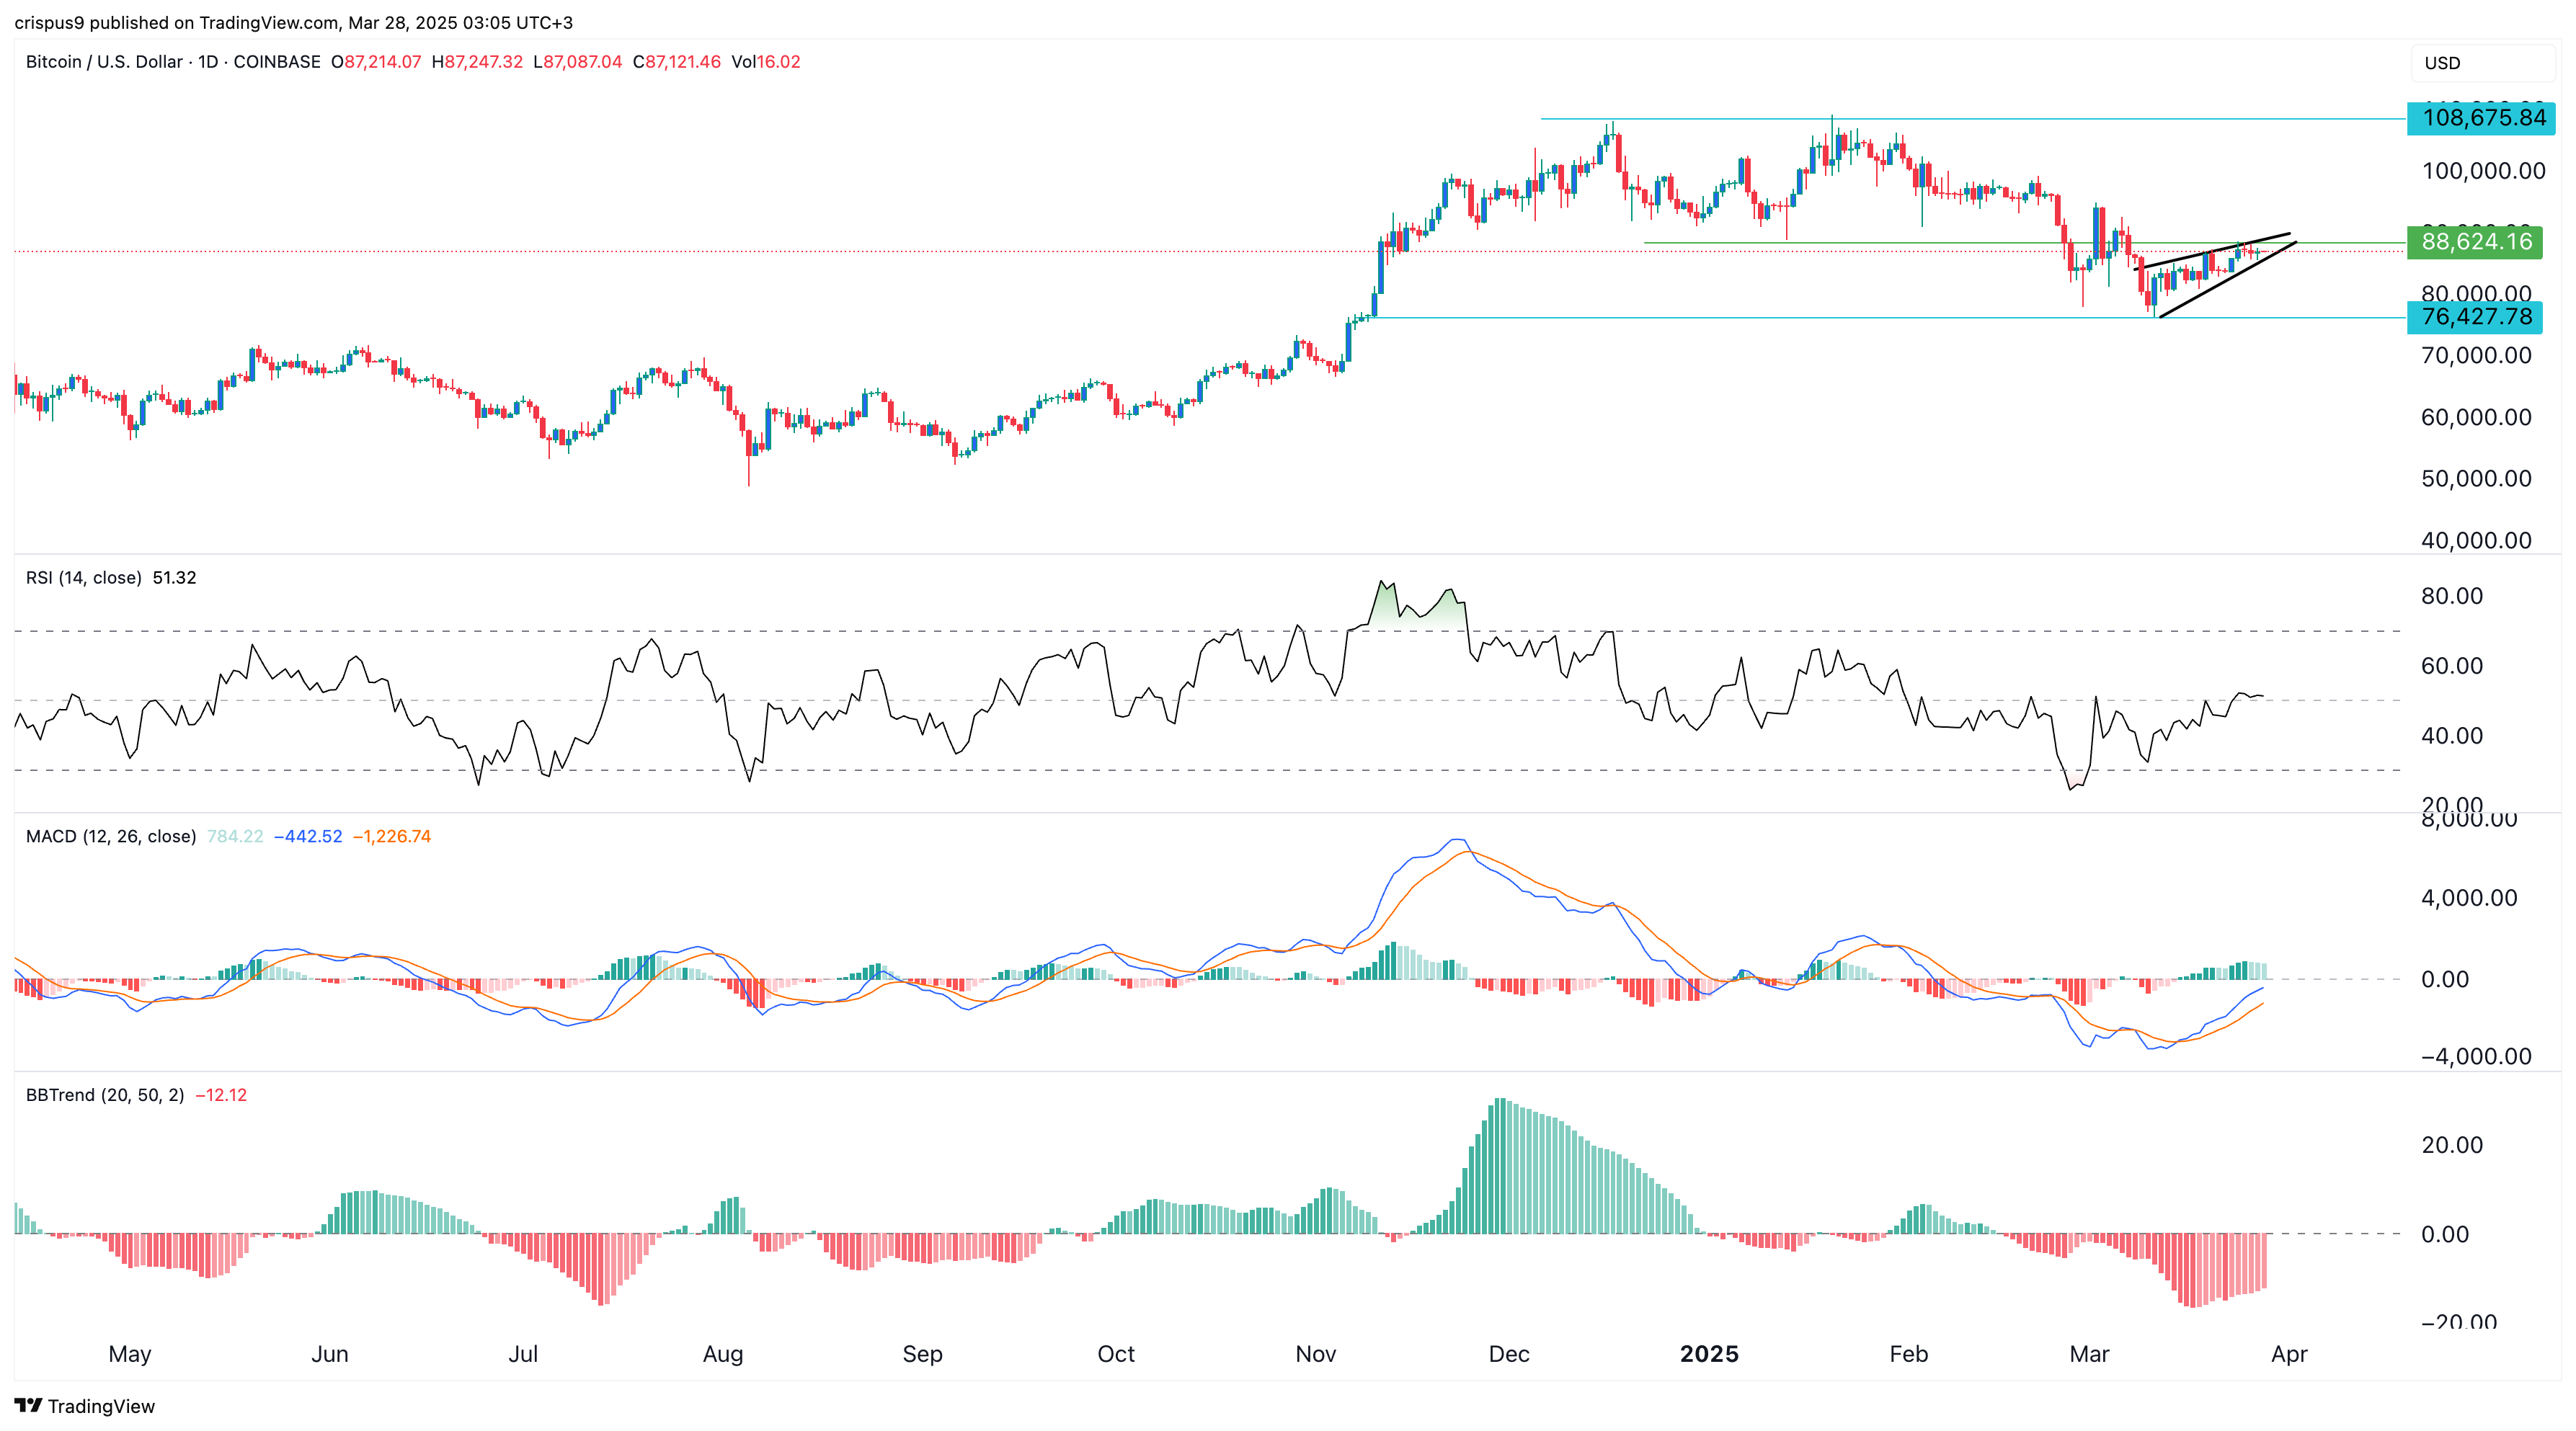
A closer look at the daily chart indicates that Bitcoin has been experiencing a slow uptrend over the past two weeks. It initially bottomed at $76,427, its lowest level on March 11th, and then rebounded to $87,500.
The coin has remained at a crucial resistance level, coinciding with its lowest point on January 13th, the neckline of the double-top pattern at $108,600. A double-top is a popular bearish chart pattern, while a break-and-retest points to more downside.
Further, the BTC price has formed a small rising wedge pattern, which features two rising and converging trendlines. This pattern leads to a strong bearish breakdown when the two trendlines converge at their meeting point.
The MACD and the Relative Strength Index (RSI) indicators have risen, serving as positive catalysts for an asset. However, the Bollinger Bands (BB) Trend indicator has remained below the zero line, indicating that this trend lacks strength. This BBTrend indicator calculates the difference between the lower bands, subtracting it from the absolute value of the upper band.
Therefore, these technicals mean that the Bitcoin price is at risk of a strong bearish breakdown. If this happens, the next point to watch will be at $76,427, its lowest level this month.
When a BTC Price Breakout Will Be Confirmed
More Bitcoin upside will be confirmed if the coin rises above the crucial resistance level at $100,000, which is about 15% above the current level. A move above that point will invalidate the break-and-retest pattern of the double-top pattern.
Also, $100k is an important resistance level that will likely attract more investors as the concept of the Fear of Missing Out (FOMO) resumes. FOMO is a situation where a coin’s price rises, prompting retail investors to pile in to take advantage of the gains.
A jump to $100k will likely lead to more gains, potentially reaching the all-time high of $109,300. Such a move could then drive prices higher to $110,000 and $120,000.
Potential catalysts for the Bitcoin price rally include the upcoming US PCE data on Friday, next week’s tariffs from the US, and the nonfarm payroll (NFP) data. Additionally, the reaction to Friday’s options expiry, worth over $15 billion, will be significant.


