

AAVE token price has remained in a narrow range since 2022, but some analysts believe that it could be ripe for a breakout as the accumulation continues.
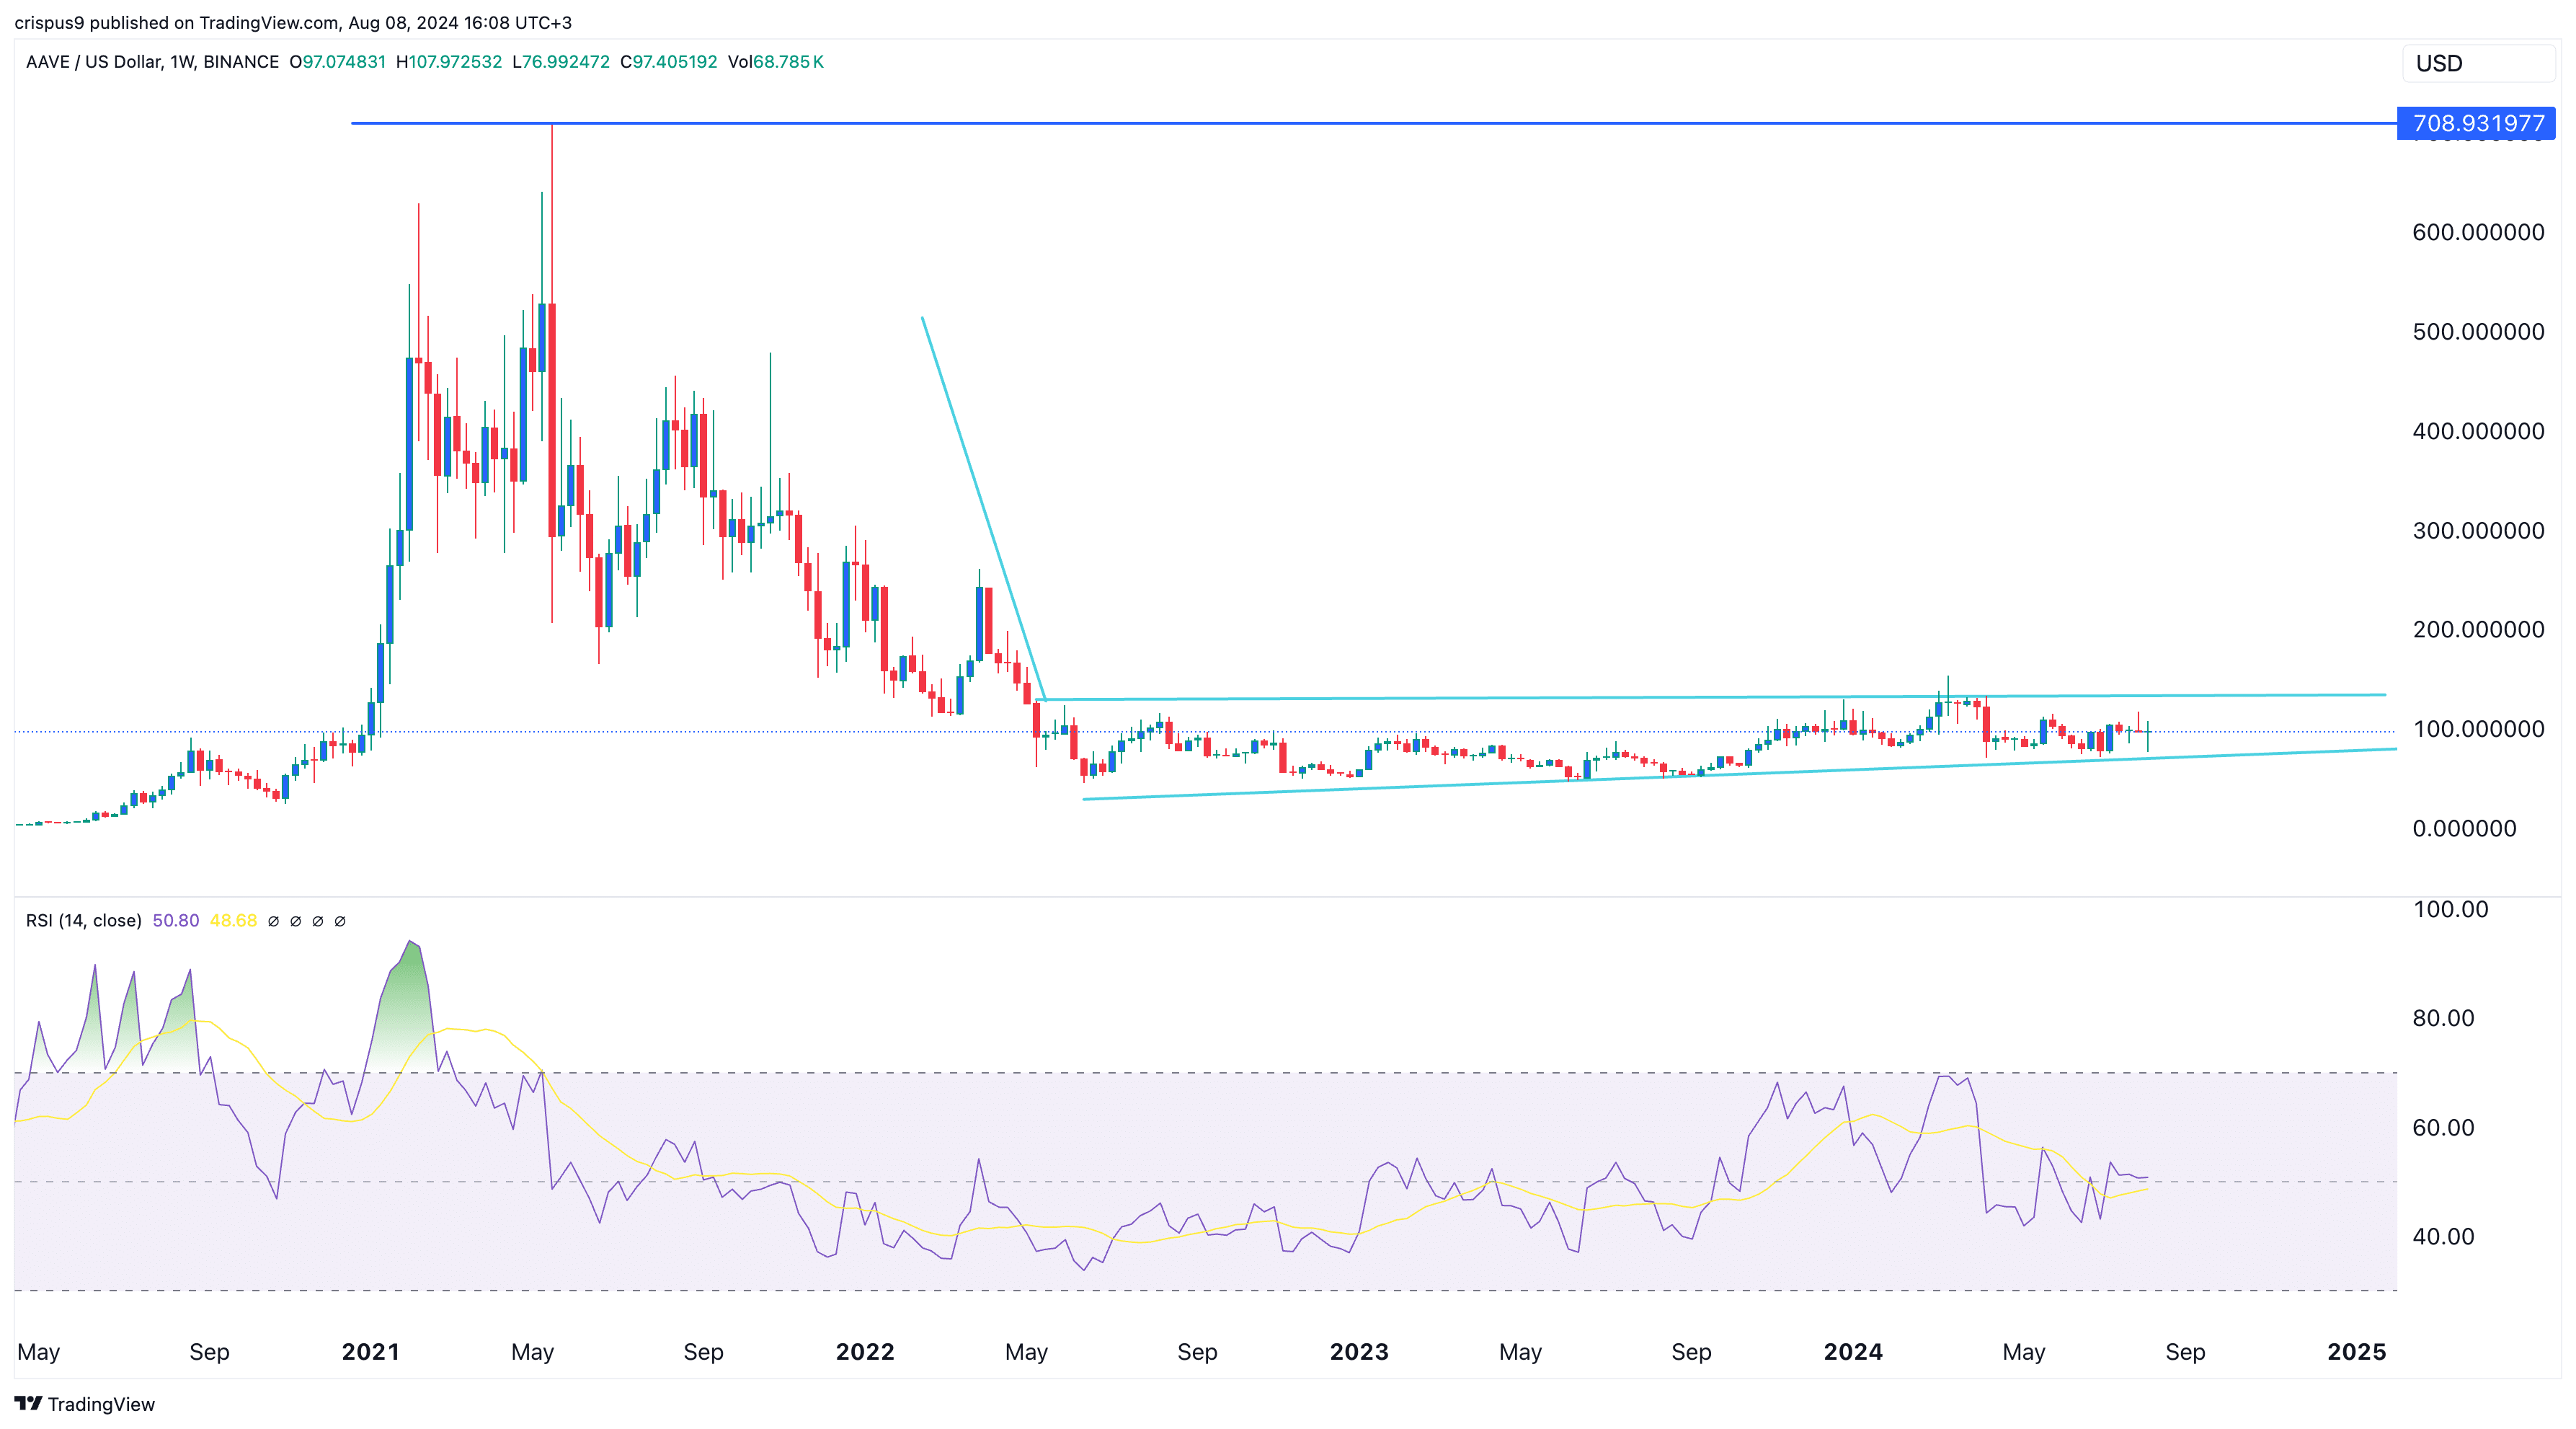
AAVE (AAVE) was trading at $97.75 on Thursday, Aug. 8, up by 100% from its lowest point in 2022 but much lower from its all-time high of $708.
AAVE token is in an accumulation phase
AAVE’s recent gains is likely due to the market better understanding the network’s popularity and profitability. Data by DeFi Llama shows that AAVE is the third-biggest player in the decentralized finance industry with over $10.7 billion in assets.
It also generates substantial fees as the third most-profitable DeFi platform and has generated over $222 million fees this year. AAVE makes most of its money from the interest rate spread between what it pays to lenders and what it charges its borrowers. It also makes money through flash loans and liquidation fees.
Some analysts believe that AAVE has more upside potential, citing the ongoing accumulation. In an X post, Michael van de Poppe, a popular X analyst, identified AAVE’s weekly chart as one of the most promising charts in the crypto industry.
This view was shared by several other analysts, including Otsukimi, who pointed to the ongoing accumulation and the fact that the Relative Strength Index (RSI) has risen above the neutral point of 50.
Other analysts cited additional reasons for their bullish outlook on AAVE. Dalin Anderson hypothesized that the token was in the process of forming an impulse wave of the Elliot Wave pattern. This pattern has five phases, with the third one being the most bullish.
A possible catalyst for AAVE is that there are signs that whales have been accumulating the token in the past few months. Last week, a whale accumulated AAVE tokens worth over $6.47 million in a two-day period.
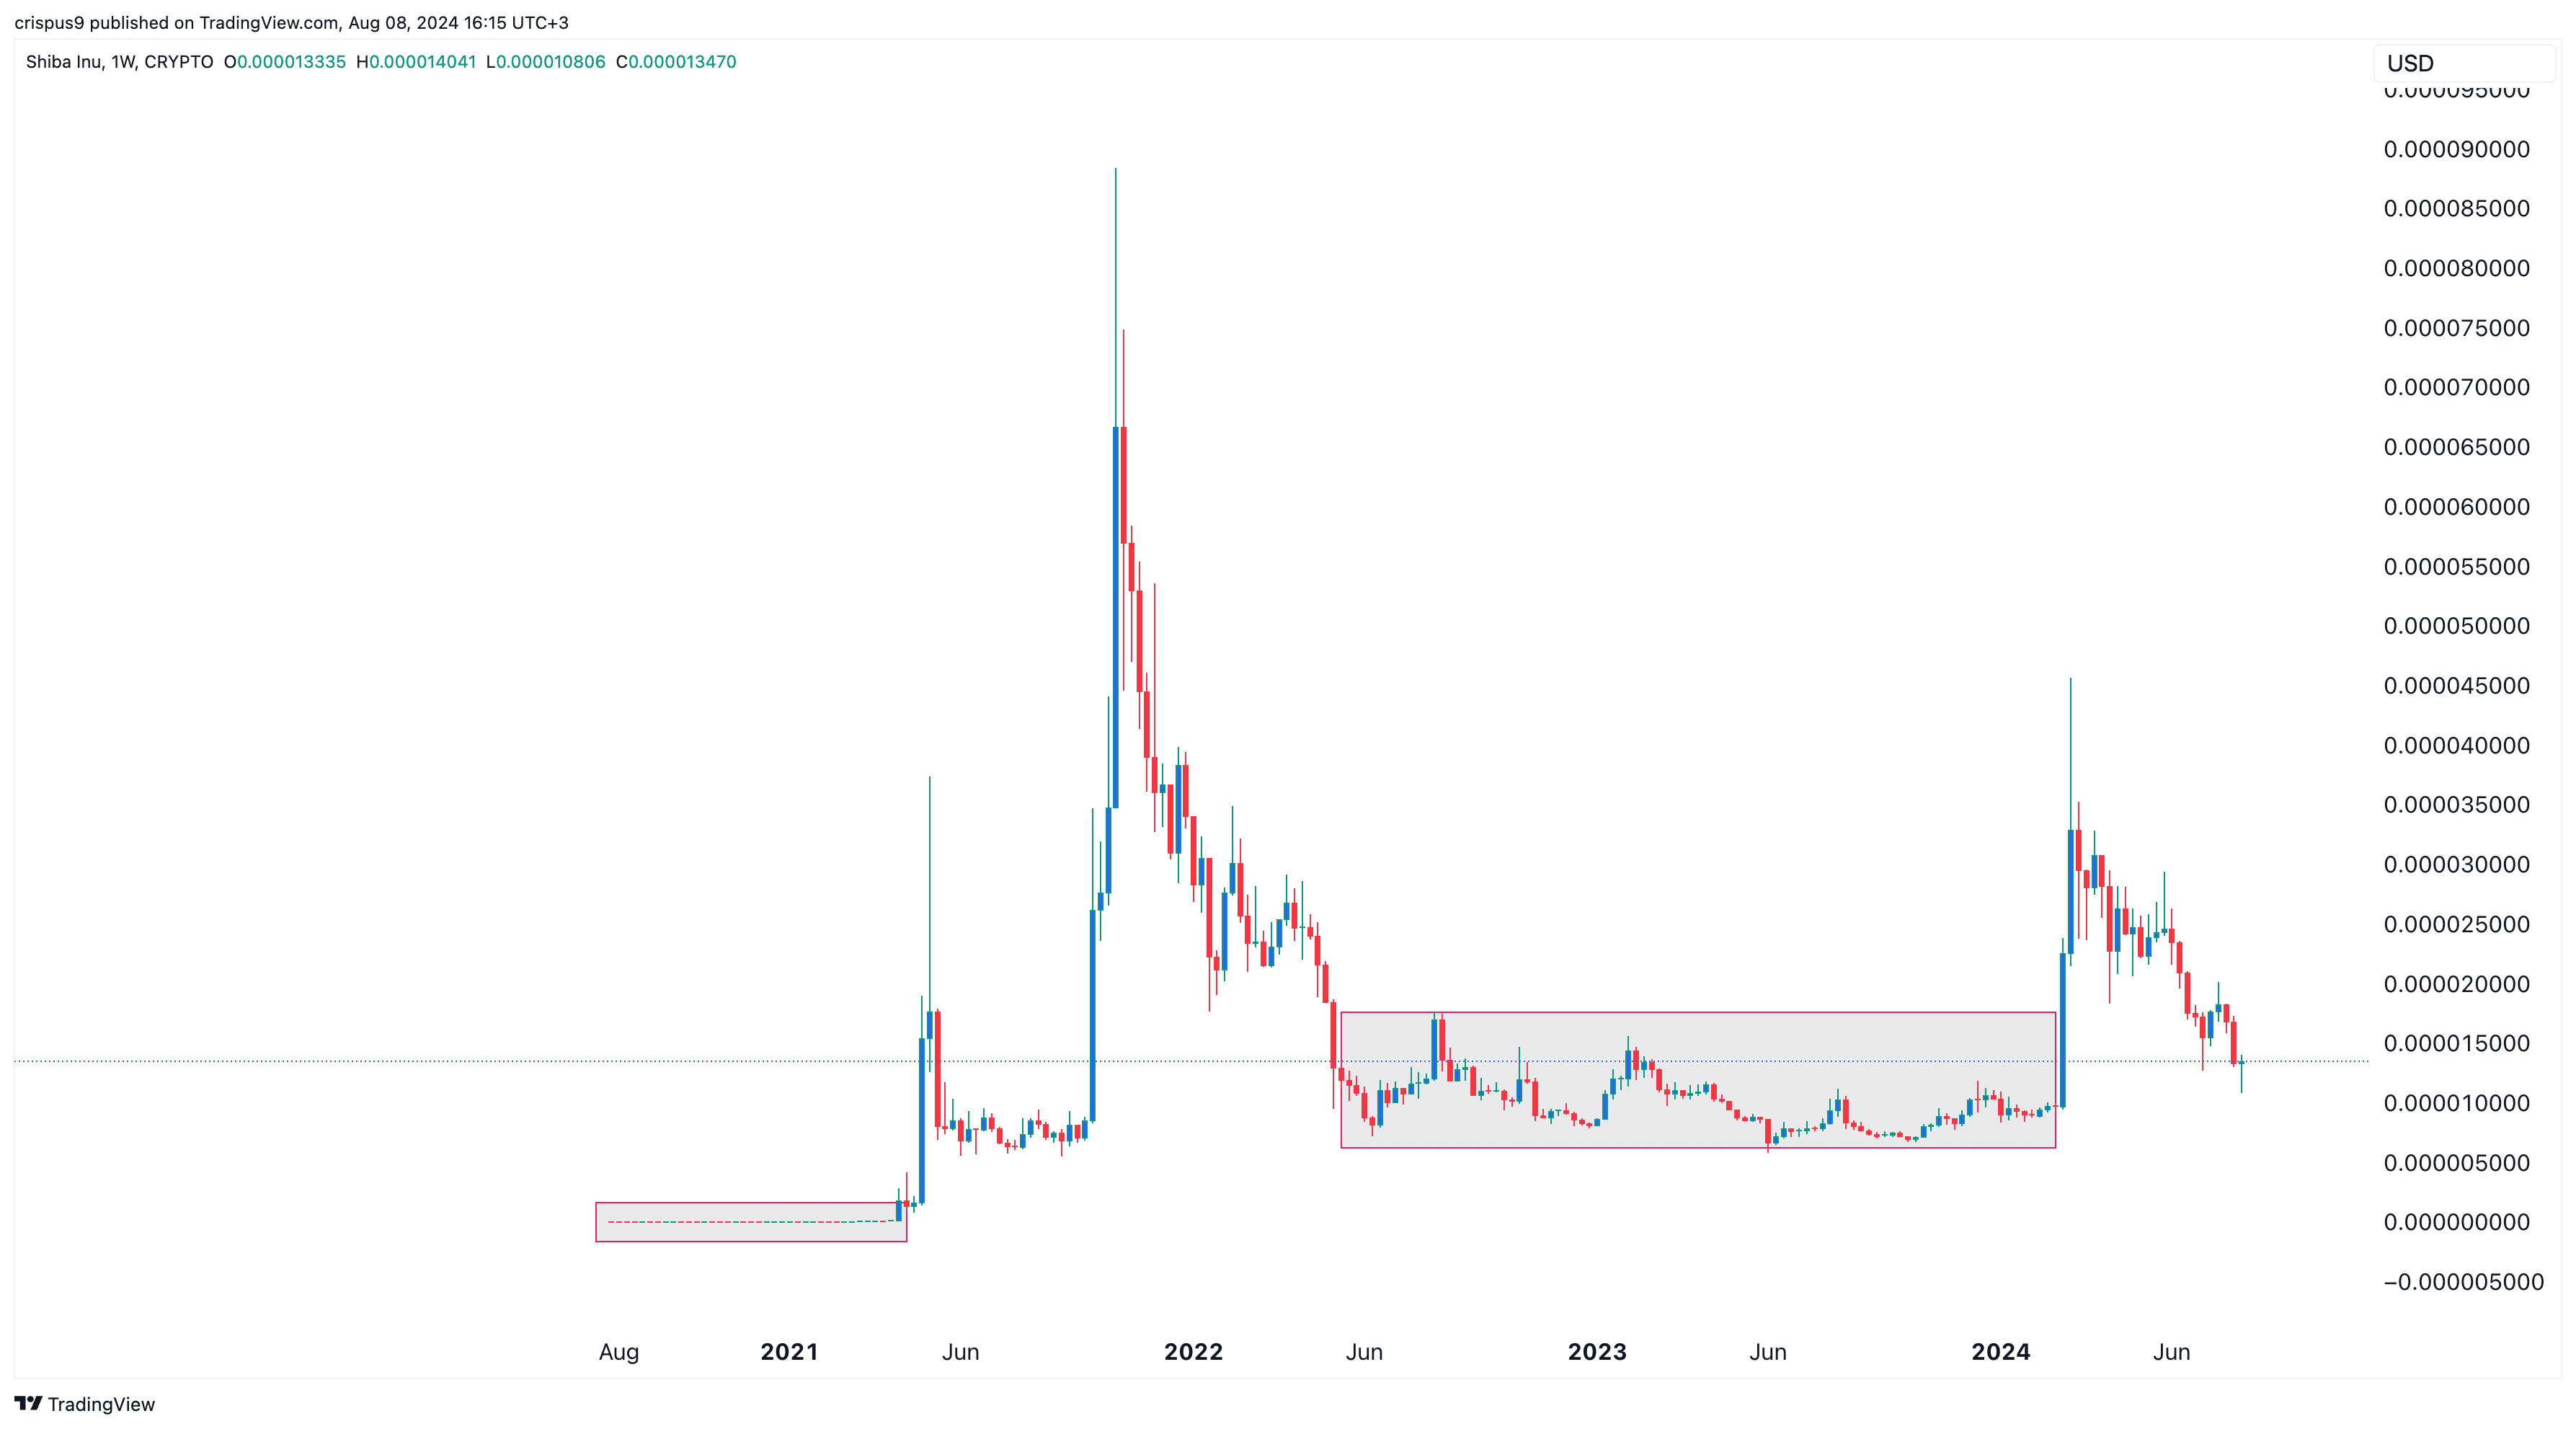
The accumulation concept has worked well among other cryptocurrencies in the past. Shiba Inu (SHIB) stayed in two prolonged consolidation phases in 2021 and in 2022 and 2023. Each of them resulted in a strong bullish breakout.
Risks to AAVE bullish thesis
The main risk to the bullish thesis is that the two-year consolidation phase could go on for a few more months or years.
Also, technically, there are signs that the token has formed a rising wedge and a bearish pennant chart pattern. In most cases, these patterns result in a bearish breakout, especially when the two trendlines near their convergence, as they are about to do.


