

Jamie McCarthy
The investment thesis
As a long-time Buffett cultist, I feel comfortable saying that I understand most of his investment choices. But occasionally, the grandmaster still manages to make a move that surprises me such as his recent position in Taiwan Semiconductor (NYSE:TSM). To wit, the recent 13F disclosure showed that Buffett opened a sizable position in TSM for the Berkshire Hathaway (BRK.A) (BRK.B) equity portfolio. As you can see from the following chart, his BRK portfolio now holds more than 60.06M shares of TSM with a total worth of over $4.11B. The TSM position is currently the 10th largest position in the BRK portfolio.
Source: Dataroma.com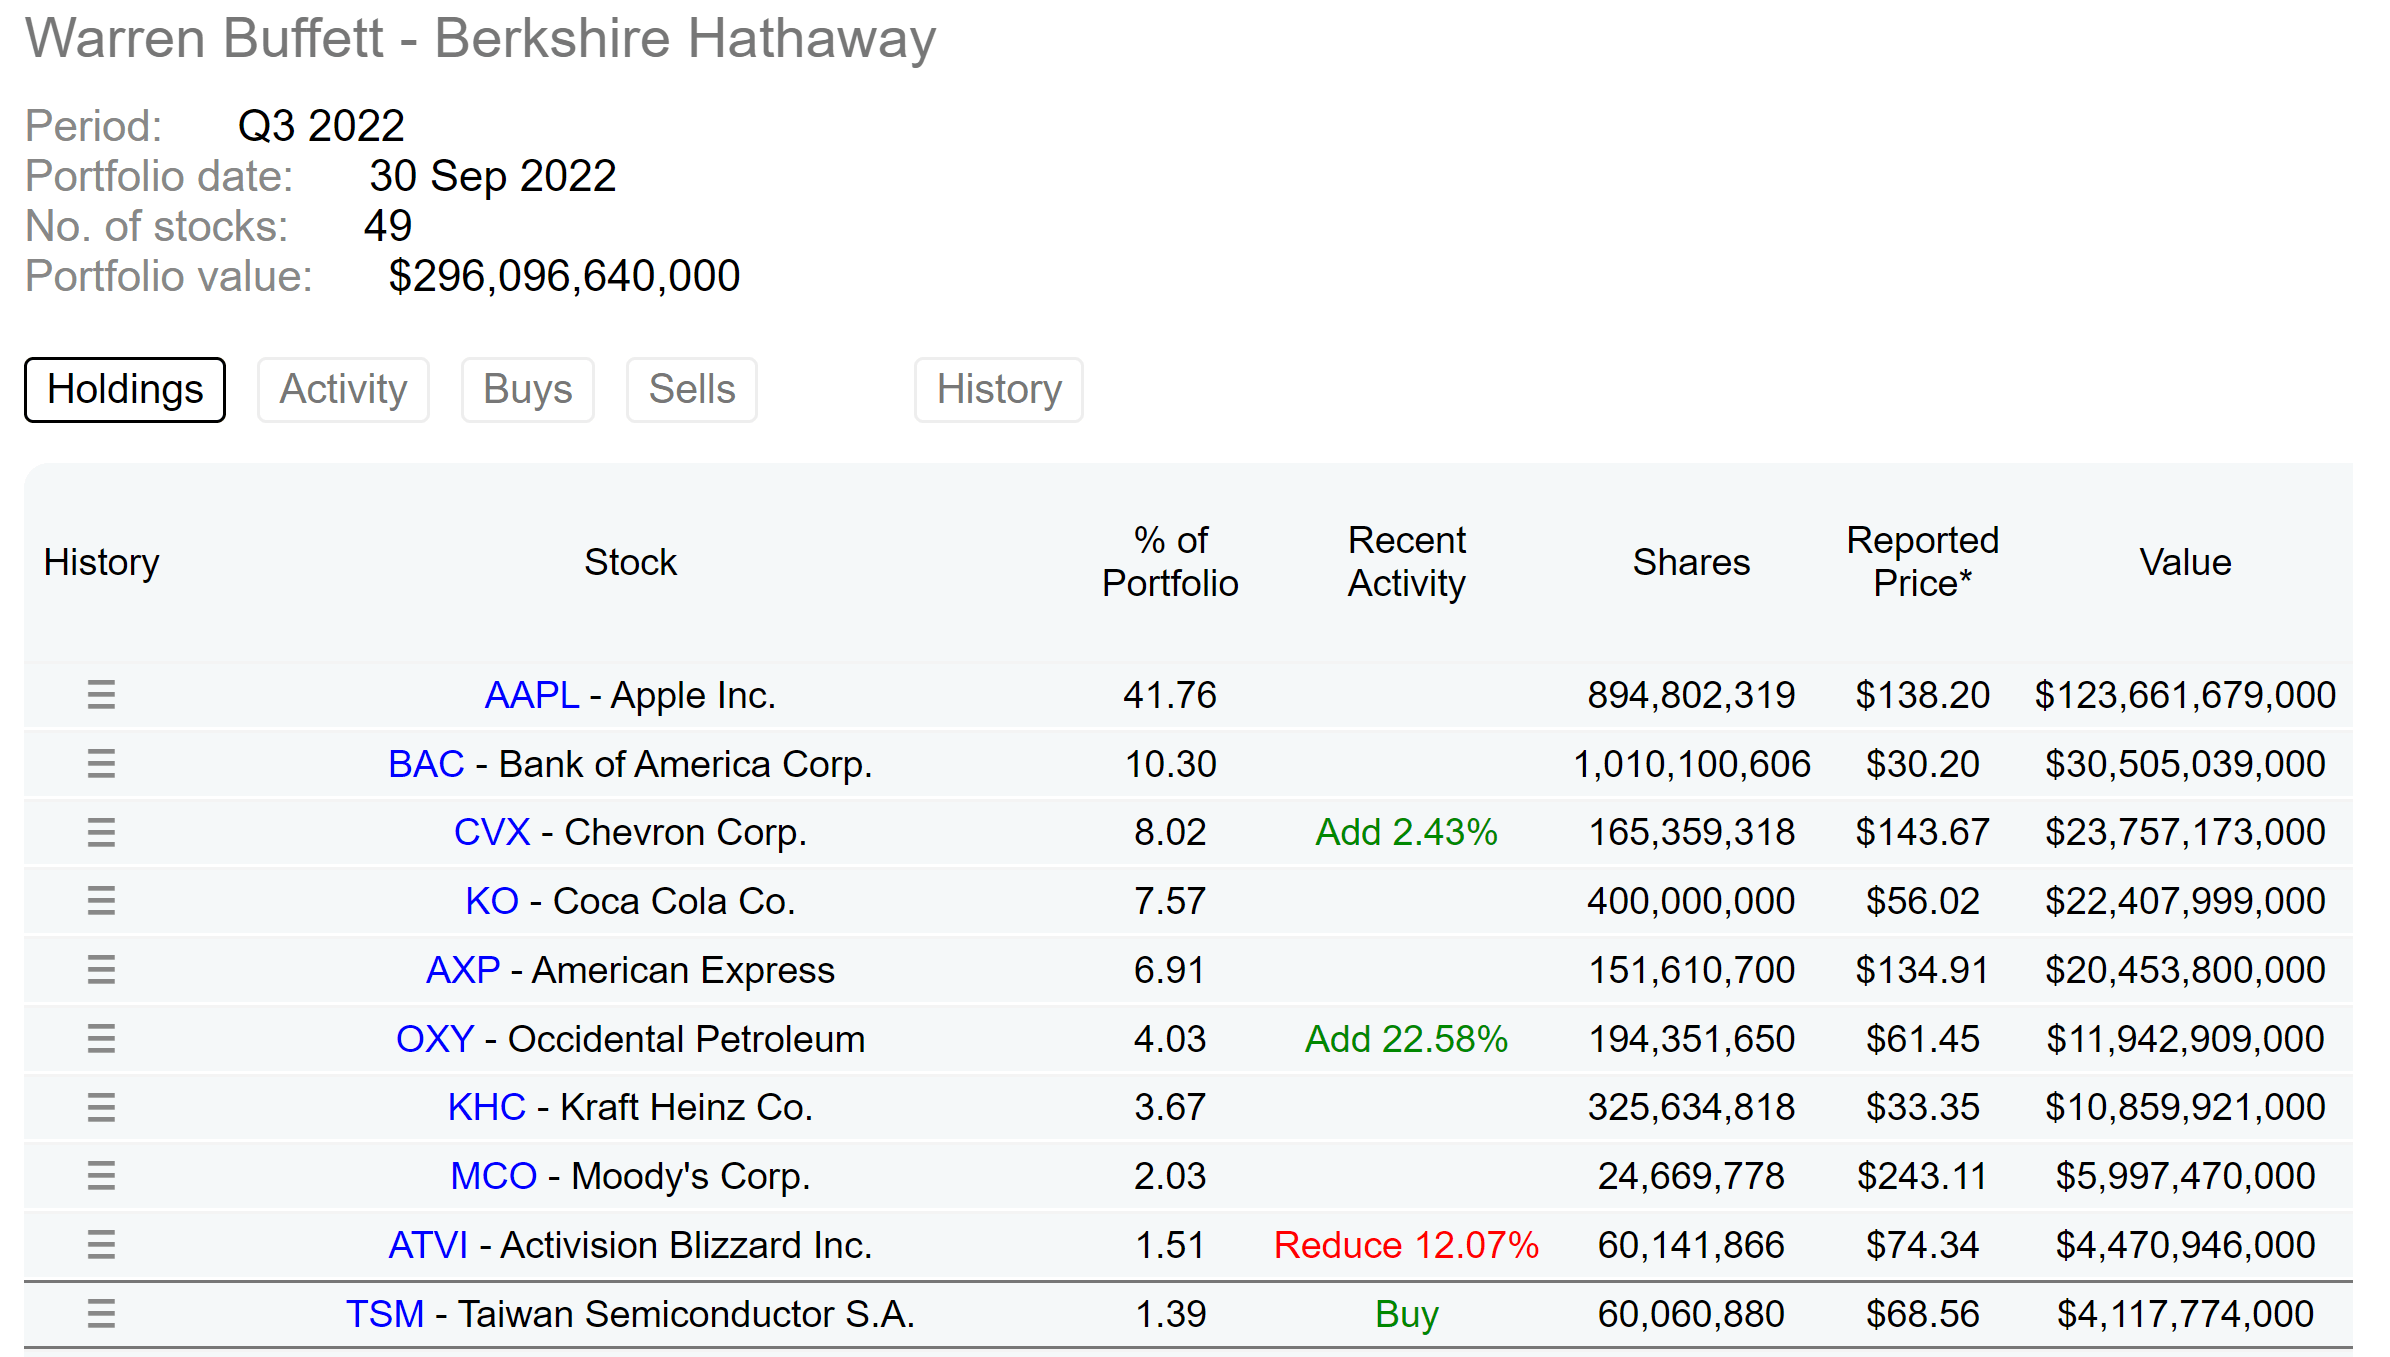
The surprise comes in several ways. And the more obvious ways (like Buffett’s allergy to tech businesses) have already been discussed by several other SA authors and I won’t further add to it anymore. Here, I want to explore an angle that is less discussed so far. I want to explain why it feels more puzzling to me, that is besides the fact that Buffett added another tech name to his BRK portfolio, when the TSM position is viewed under the context of his largest holding, Apple (NASDAQ:AAPL). There are certainly positives with TSM, that is, even when compared to AAPL. As we will detail in the next section, it is a high-quality stock in its own right. It boasts a large technological lead in its space and an R&D yield that is even better than AAPL.
However, I see these positives easily overshadowed by the developing tension between them and also the ongoing deglobalization mega-trend. According to a recent news report, TSM’s scheduled price raises in 2023 were rejected by AAPL, by far its largest customer. AAPL currently outsources almost all of its processor manufacturing to factories in Taiwan. However, with the U.S. strategic initiatives to push to develop domestic semiconductor foundry capabilities, AAPL (and other U.S. chip players such Advanced Micro Devices (AMD) and NVIDIA (NVDA) too) would be very likely to diversify its chip manufacturing away from TSM. And the damage will be mutual but asymmetric. It is easier for AAPL to find other foundry services to manufacture its chips, and a lot harder for TSM to find such large clients as AAPL.
The full impact of such tension and diversification will take time to fully manifest. And TSM’s role as the dominating high-end chipmaker in the world won’t change in the near term. But I see these recent events (such as AAPL’s rejection of the price raises and the recent passing of the CHIPS act) as the turning point. Taking a broader view, I see these events as a logical step, or even an inevitable step, in the deglobalization process – a mega force that has been unfolding for over 10 years as shown in the chart below. The chart illustrates how globalization, measured as the percentage of total exports out of global GDP, has been in decline since its peak in 2008. The percentage has declined from 61% in 2008 to the to 51.6% in 2020. And since 2020, the China-U.S. trade tension, the COVID, and the Russian/Ukraine war have further quickened its pace.
In the remainder of this article, I will further analyze the details of these above considerations in more detail.
Source: The World Bank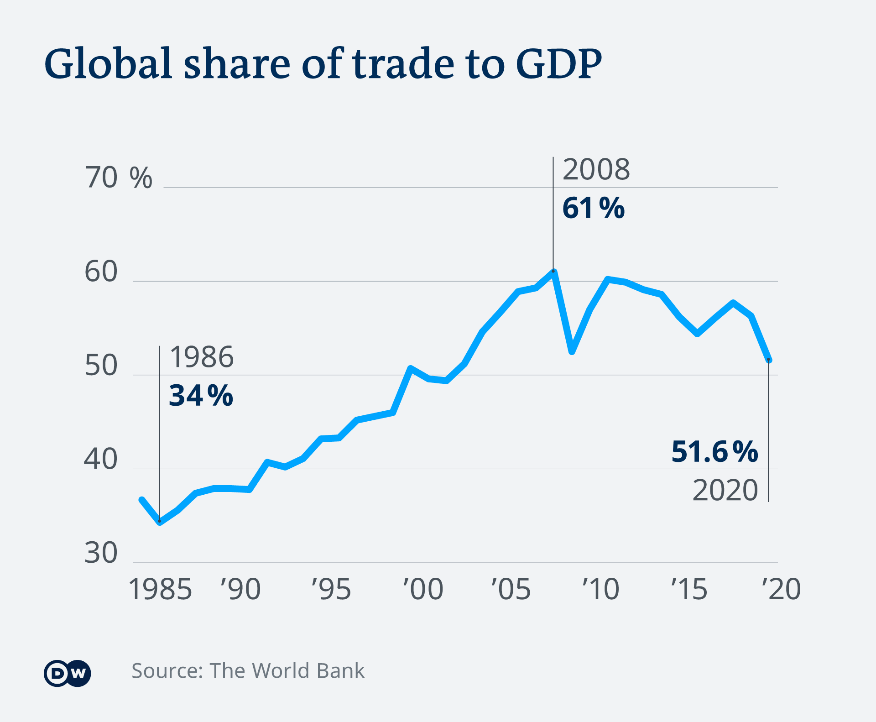
TSM’s valuation advantage
First, as mentioned above, there are definitely many positives with TSM even when compared to AAPL. And valuation is an obvious place to start with. As a global leader in the foundry space, it is for sale at a fraction of the overall market and AAPL’s valuation as seen in the chart below.
To cite a few examples, TSM’s FY1 PE of 12.8x is almost only 1/2 of AAPL’s 24.2x. Its TTM PE of 13.08x is also about only 1/2 of AAPL’s 24.2x. Considering that these stocks have different leverages and enterprise values (“EV”), let’s compare their multiples with leverages adjusted too. As you can see, TSM’s discount is even more dramatic in terms of EV/EBITDA multiples. TSM’s FW EV/EBITDA ratio sits at 7.64x only, less than ½ of AAPL’s 18.18x.
Yes, as you will see in the next section, TSM is a high-quality stock in its own right. It boasts a large technological lead in its space, further bolstered by its consistent R&D investments and also superb R&D yield that even surpasses AAPL.
Source: Seeking Alpha data
TSM’s more consistent and aggressive R&D
As detailed in our earlier articles:
We do not invest in a given tech stock because we have high confidence in a certain product that they are developing in the pipeline. Instead, we feel more comfortable betting on A) the recurring resources available to fund new R&D efforts sustainably, and B) the overall efficiency of the R&D PROCESS. So correspondingly, in the long run, I feel comfortable as long as a tech business can A) sustainably support new R&D expenditures, and B) has demonstrated a consistent R&D yield. I do not feel the need to particularly bet on any one of the new products to be a hit (or a complete failure).
And both TSM and AAPL can sustainably fund their new R&D efforts with no problem in the long term, as illustrated in the next chart. It shows their R&D expenses over the past 10 years as a percentage of their total sales. A few key observations:
- TSM has been investing very consistently in R&D efforts, on average about 8.0% of its total sales.
- AAPL’s R&D expenses have been climbing since Tim Cook took over the company from Jobs. Jobs believed that innovation is not about money and it “has nothing to do with how much R&D money” a business put in. Then Cook gradually increased the R&D investments to the current level of around 6.1% since 2018.
- So even at AAPL’s current R&D level, TSM is still outspending AAPL by about 200 basis points. And also note TSM’s consistency: the R&D expenses only fluctuated in a very narrow range over the past 10 years.
Source: Author
More impressively, TSM’s yield on the R&D investment is also superior to AAPL, which is already at a remarkable level by itself as shown in the next chart. The chart used Buffett’s $1 test on R&D expenses. More specifically, the chart quantifies the R&D yield by taking the ratio between profit and R&D expenditures. Thus, the results show how many dollars of profit are generated per $1 of R&D expenses. In particular, in this chart, my analysis used the operating cash flow (“OPC”) as the profit and also took a 3-year moving average on the OPC to approximate a 3-year R&D cycle. And the key observations are:
- The R&D yield is also consistent for TSM, with an average of $6.75 since 2014.
- AAPL’s picture is a bit more colorful. Its R&D yield has been astronomical ($10+ in 2013 and $8+ in 2014 and 2015) thanks to its almost monopoly status in key market segments in those days. Its R&D yield has gradually declined to around ~$4.0 in recent years. And its long-term average was about $5.3.
- To provide a broader view, the FAAMG group features an average R&D yield of ~$2.5 in recent years.
- Thus, both AAPL and TSM boast superb R&D yields even when compared to the overachievers in the FAAMG pack, and TSM’s yield is even higher than AAPL by a large gap.
Source: Author based on Seeking Alpha data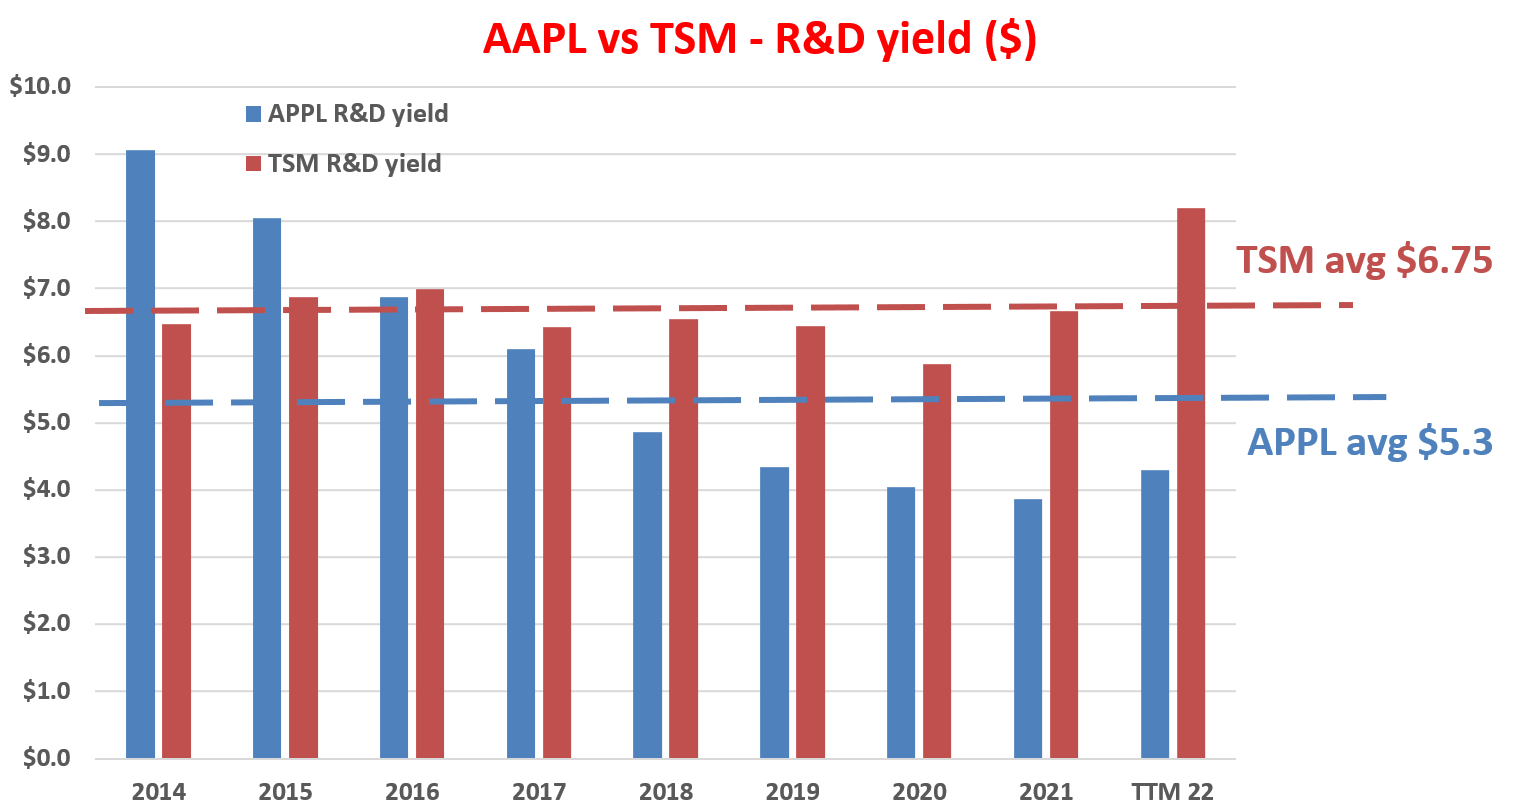
Both enjoy high ROCE too, but AAPL is in its own category
To me, ROCE (return on capital employed) is the most fundamental profitability metric as detailed in my blog article (with differences compared to ROE and Q&A on the most frequently received questions from our readers). One key reason for its fundamental importance is that the long-term growth rate is governed by ROCE and reinvestment rate (“RR”) in the following simple way:
Long-Term Growth Rate = ROCE * RR
The ROCE of TSM and AAPL are shown below for the past 10 years. As you can see, TSM has been maintaining a high ROCE with remarkable consistency here. Its average ROCE has been about 42%. And I cannot overemphasize the consistency – which is a strong indicator of its stable moat. However, AAPL certainly has the upper hand here. Its ROCE is simply a category of its own. It has been hovering around an average of 125% since 2018 after its “declines” from an astronomical (and also unsustainable level in my view) of 200%+ earlier in the decade.
In terms of RR, both companies have sustainable capital allocation flexibility thanks to their strong cash generation. All told, my analysis shows that TSM has been maintaining an RR in the range between 7.5% to 10% in recent years, and AAPL about 5% to 7.5%.
So even without the trade tensions and deglobalization process aforementioned, I would project AAPL to have a much better perpetual growth curve ahead than TSM. I projected AAPL’s LT growth rate to be up to 10% (7.5% RR * 125% ROCE ~ 10% annual growth rate). And TSM’s growth rate, on the hand, would be limited to be in the mid-single digit range (say 4% = 10% RR * 42% ROCE).
Source: Author based on Seeking Alpha data
Risks and final thought
But to reiterate, I do see the developing tension between TSM and AAPL and the deglobalization process as the overarching forces here. And I only see the differences in terms of valuation, R&D yields, and profitability to be secondary forces in the years to come. The deglobalization mega-trend has been unfolding since 2008. And I see a series of recent events (such as AAPL’s rejection of TSM’s price raises, the CHIPS act, the ongoing U.S.-China trade frictions, and also the Russian/Ukraine war) to further exacerbate and accelerate the trend. Under such a mega-trend, I see it as inevitable that key chip clients (such as AAPL, AMD, and NVDA) diversify their manufacturing needs away from TSM.
And the bottom line is that damage will be mutual but asymmetric the way I see things. It is easier for AAPL to find replacement foundry services but a lot harder for TSM to find replacement clients at the scale of AAPL.


