

Shares of Apple topped around $175 in the middle of August and turned lower – we hope traders took appropriate action. Let’s check on the charts and indicators again.
In this updated daily bar chart of AAPL, below, we can see that prices pulled back to test the rising 200-day moving average line. Prices are off their lows of the day but still down on the session. The trading volume does not appear to have increased on the late August decline but the On-Balance-Volume (OBV) line is pointing lower. The Moving Average Convergence Divergence (MACD) oscillator has crossed to the downside for a take profit sell signal.
In this weekly Japanese candlestick chart of AAPL, below, we can see a top reversal pattern in August looking at the candles. A top reversal can mean a decline or it can mean a period of sideways price action. The slope of the 40-week moving average line is slightly positive and prices look like they will test that line.
The weekly OBV line looks like it is rolling over in August. The MACD oscillator has improved from June and is trying to clear the zero line.
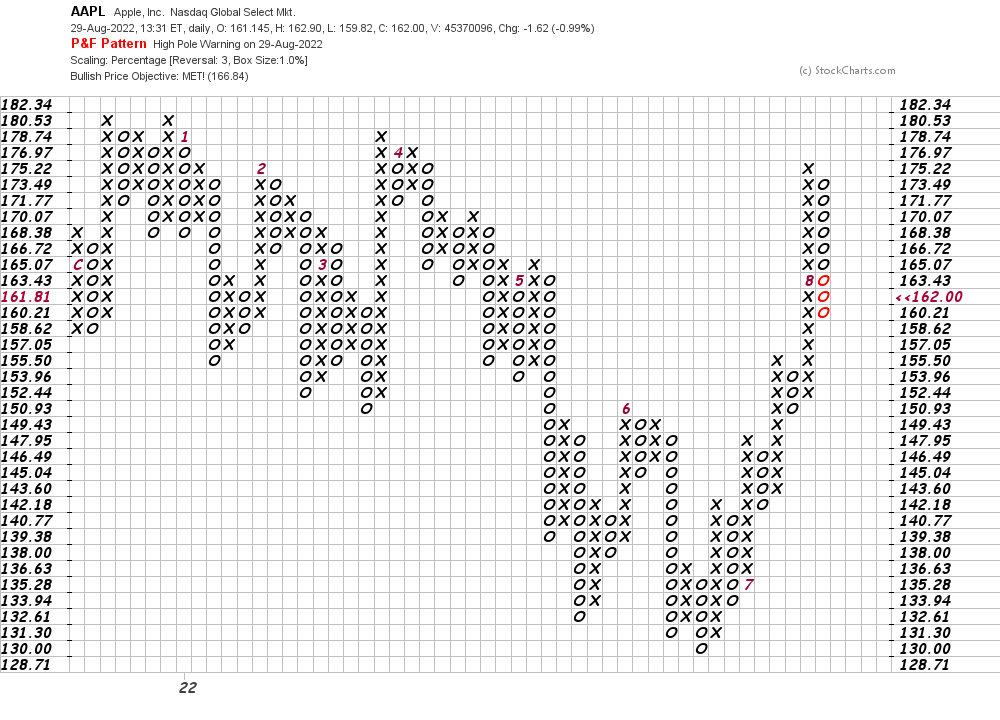
In this daily Point and Figure chart of AAPL, below, we can see that prices reached and exceeded an upside price target in the $167 area.
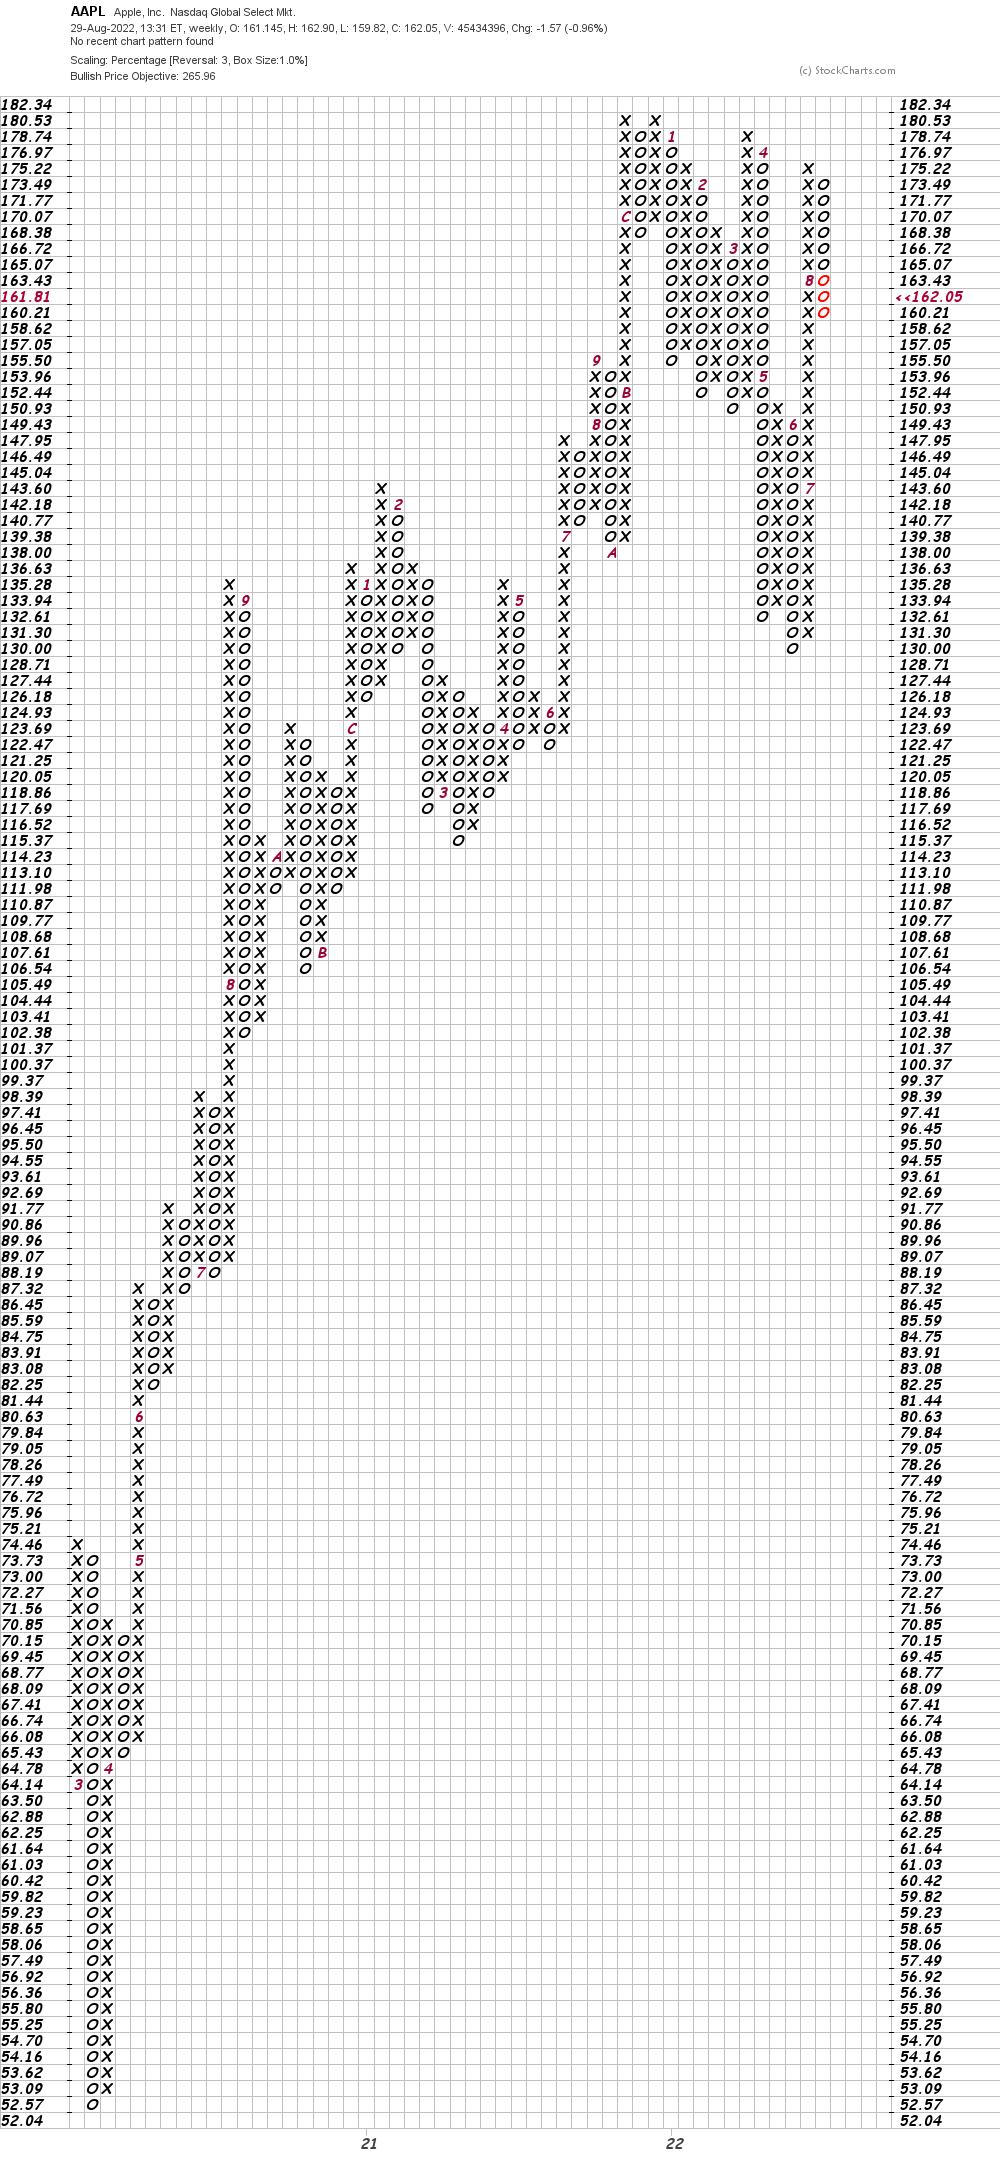
In this weekly Point and Figure chart of AAPL, below, we can see a $266 price target. It is hard to decide what price could turn this chart bearish.
Bottom line strategy: Bullish traders can suggest that AAPL’s price action holding the 200-day moving average line is positive but I think it will take more than that. The rally from May on declining volume is more important technically than holding or breaking a moving average – at least in my book. I am in no rush to become a buyer.
Get an email alert each time I write an article for Real Money. Click the “+Follow” next to my byline to this article.


