

CatLane/iStock Unreleased via Getty Images
By Valuentum Analysts
Do you believe that stock prices actually mean something? We do.
As part of our stock-selection process, we build a discounted cash-flow (“DCF”) valuation model where we estimate the intrinsic value per share of companies. This may be slightly different than you might be used to with respect to valuation multiple analysis, where one might buy a stock because its multiple looks low relative to peers or relative to history, or something else.
But there’s a lot of problems with just looking at the valuation multiple of a company. For example, a stock that has a price-observed P/E ratio of 15x (i.e. its share price divided by earnings per share is 15) could be cheap or it could be expensive. For example, if the company has a huge net cash position and tremendous future free cash flow potential, the company might be fairly valued at 30x-40x this year’s earnings and cheap at 15x.
On the other hand, if a company has a huge net debt position, pays hefty outlays in terms of dividends relative to free cash flow, and is experiencing organic growth headwinds, a P/E multiple of 10x might actually be expensive for that stock (even as it is trading below the average market multiple). What matters is what the value-derived P/E ratio (the DCF-derived value per share divided by earnings per share) should be in relation to the price-observed P/E ratio on the market, not whether the price-observed P/E ratio, itself, is high or low.
The CFA Institute blog published a recent article on this topic here. The takeaway is to be very cautious making any decision based solely on the level of P/E ratios or other valuation multiples. The cash-based sources of intrinsic value within the discounted cash flow process are the key determinants behind a company’s P/E ratio, and some companies should have a high P/E ratio while other companies should have a low P/E ratio. Let’s see how this concept comes into play with Apple Inc. (AAPL).
Apple’s Robust Cash-Based Sources of Intrinsic Value
There’s a tangible reason, for example, why a company like Apple has a market cap in the trillions of dollars while other stocks may be penny stocks. The market buys and sells (and sets the price) based on an estimate of the company’s value, and a company’s intrinsic value is derived primarily by its cash-based sources, which are net cash on the balance sheet and future expected traditional free cash flow, as defined by net cash from operations less all capital spending.
In most cases, almost every qualitative measure converges into these two cash-based sources-meaning that you could have an opinion about the company’s strategy, its management team, a new product launch, and the list goes on and on, but everything must (eventually) find its way into the discounted cash-flow model through these cash-based sources. By adding the net cash on a company’s balance sheet to the present value of its future expected enterprise free cash flows and then dividing that sum by shares outstanding, one arrives at the DCF-derived value of a company on a per-share basis.
Comparing this DCF-derived per-share intrinsic value estimate with the share price then provides an indication of whether a company’s shares are overpriced or underpriced. The DCF might say that a company should trade at 30x-40x earnings on the basis of its unique cash-based characteristics, while the stock may only be trading at 15x. In this case, the stock would be considered cheap. Or, the DCF might say that a company should trade at 10x earnings on the basis of its unique cash-based characteristics, while it is trading at 15x. In this other case, the stock would be considered expensive, even with a price-observed P/E ratio of 10 (which is below the market average)!
Same multiple of 15x, but a completely different meaning behind it. One stock with a 15x P/E is cheap, while the other stock with a 15x P/E is expensive. What does this mean? Well, the P/E ratio itself isn’t going to help you much in making a good decision based on valuation. So, what to do? Well, we like companies whose DCF-derived per-share intrinsic value estimate is higher than their share price. Where some small penny stocks may be burning through free cash flow and their intrinsic values almost impossible to estimate due to uncertain cash-based considerations, Apple on the other hand has a huge and tangible net cash position and generates a tremendous amount of free cash flow.
In the image immediately below, we can see that Apple’s cash and cash equivalents as well as marketable securities on the balance sheet are far greater than the sum of its term debt and commercial paper. We call this difference the company’s net cash position. For the three months ended December 25, 2021, Apple’s total cash balance stood at $202.6 billion, while its total debt stood at $122.8 billion, good for a net cash position of $79.8 billion. In other words, one of the key cash-based sources of intrinsic value for Apple, its net cash position, stood at a hefty $79.8 billion at the end of its latest quarter.
Apple’s net balance sheet position is calculated by subtracting its term debt and commercial paper from all of its cash and cash-like securities. (Apple’s Consolidated Financial Statements)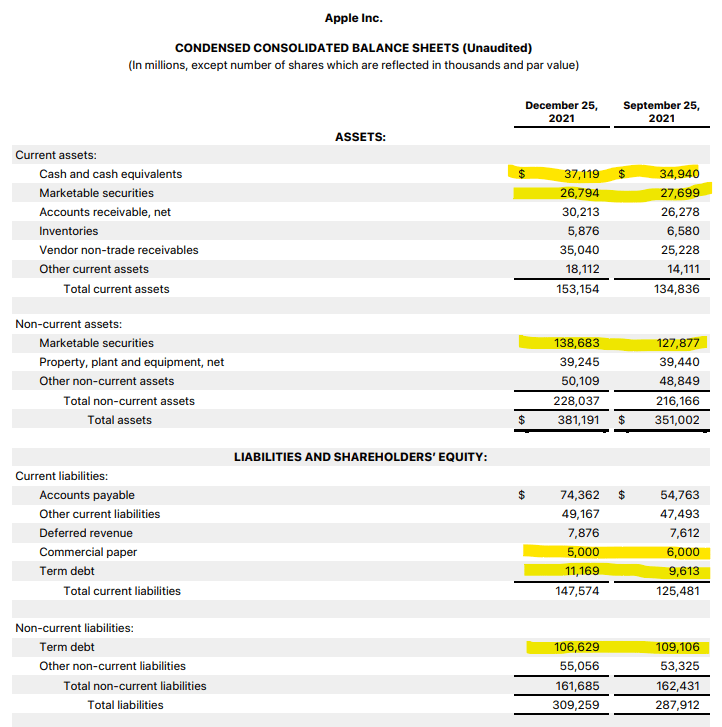
The other key component of Apple’s DCF-derived cash-based intrinsic value is its future expected free cash flow generation, and this is where the company stands out like no other firm. During the three months ended December 25, 2021, Apple generated $47 billion in cash flow from operations and spent just $2.8 billion in capital spending, labeled as ‘payments for acquisition of property, plant and equipment’ in the image below.
Apple has one considerable capital-light operation, as capital spending is but a fraction of operating cash flow and its overall sales. Subtracting capital spending from cash flow from operations in Apple’s most recent quarterly results, released January 27, translates into traditional free cash flow generation of $44.2 billion. This number is absolutely incredible – and Apple hauled in all this money in just three months!
Apple’s free cash flow generation is phenomenal. Traditional free cash flow is calculated by subtracting ‘payments for acquisition of property, plant and equipment’ from ‘Cash generated by operating activities.’ (Apple’s Consolidated Financial Statements)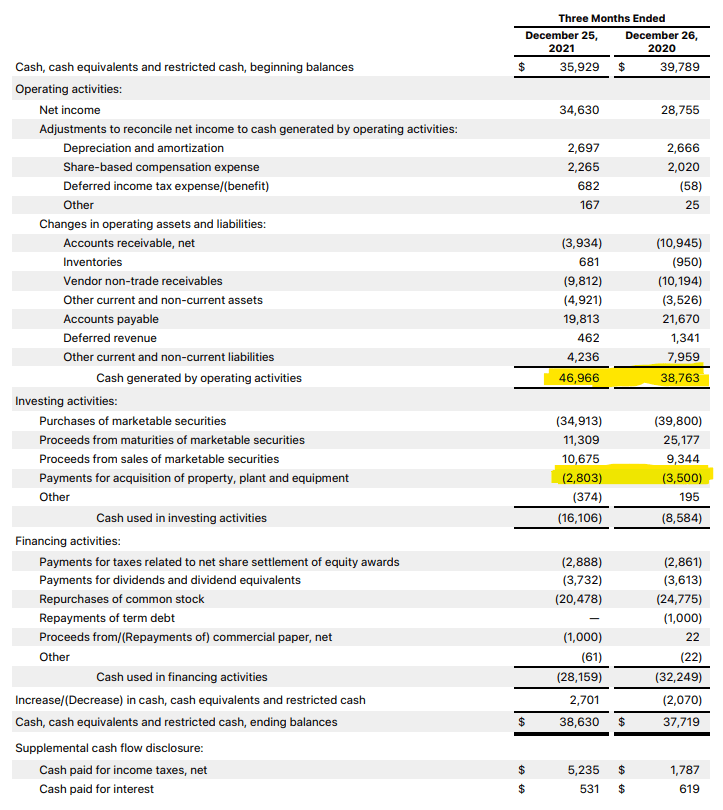
Let’s continue to put Apple’s latest quarterly free cash flow generation number into context. As shown in the image below, during the last fiscal year ending September 2021, Apple generated $93 billion in traditional free cash flow.
That, itself, is a huge number, but the iPhone maker has already hauled in roughly half of what it generated in free cash flow for all of last fiscal year in just the first quarter of this fiscal year! Amazing.
What really stands out, too, is just how fast Apple’s cash flow is growing. Cash flow from operations in the first quarter of the company’s current fiscal year came in at $47 billion, as shown in the image above. This number is almost two thirds of its entire operating cash flow generation during all of fiscal 2019 (shown below), again in just one quarter!
Apple’s traditional free cash flow generation continues to grow aggressively. (Valuentum)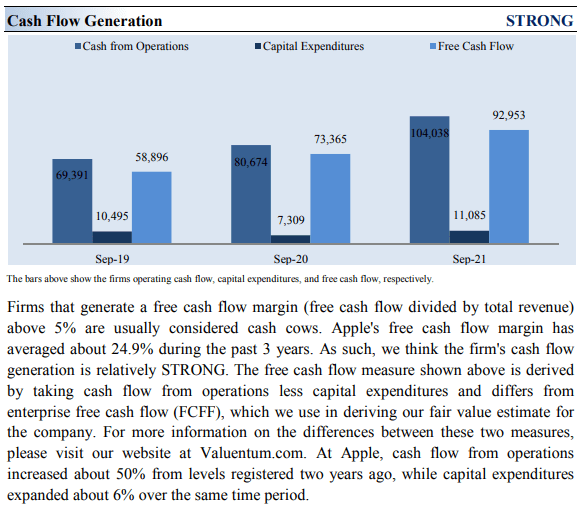
Apple may be a big company with a huge market capitalization, but its cash-based sources of intrinsic value are growing fast, and based on its current trajectory, they could get a whole heck of a lot bigger! That means that its market capitalization can get a whole lot bigger, too.
Let’s have a look at some of the key assumptions behind our discounted cash-flow model for Apple. You’ll notice that, while we are excited about Apple’s prospects, our summary valuation projections are quite reasonable, and we think a discount rate of 7.4% may even be high for this excellent credit-quality firm when the 10-year Treasury rate stands at ~1.7%.
Our valuation assumptions for Apple. (Valuentum)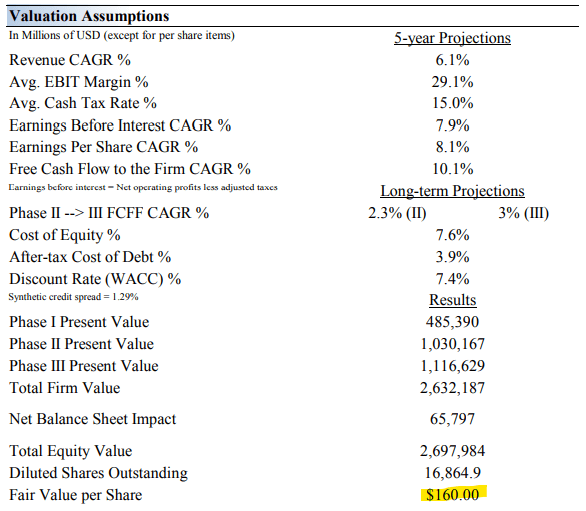
After calculating the DCF-derived value per-share of Apple-which includes an analysis of net cash on the balance sheet and future expected free cash flows-and then comparing this value per-share to its price per share, we can make an informed judgment about whether the stock is a good deal or not. The higher the estimated value relative to the price, the better the deal! Think of it as getting a discount at the grocery store.
As Warren Buffett once said, “Whether socks or stocks, I like buying quality merchandise when it is marked down.” In our discounted cash-flow process, we think Apple is worth $160 per share, just a little shy of where they are trading at the time of this writing (after the huge run following its fiscal first quarter report). However, let’s not jump to conclusions about its valuation opportunity just yet, as we have to consider our margin of safety analysis and potential upside.
Our fair value estimate range for Apple. (Valuentum)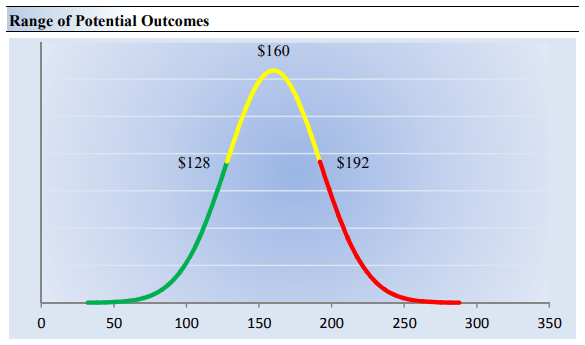
Though our discounted cash flow progress is rigorous, we are not dogmatic when it comes to the point fair value estimate. But why? Well, it’s because every company has a range of probable fair value outcomes that’s created by the uncertainty of key valuation drivers such as future revenue or earnings expectations that cannot be predicted with certainty, for example. After all, if the future were known with certainty, we wouldn’t see much volatility in the markets as stocks would trade precisely at their known fair values.
This is a good way to think about the markets and what causes market volatility, in general. For example, if future expectations change, the value of the company will change, and therefore so will the buying and selling decisions that drive the price. This is, in part, why we think stocks will eventually converge to a reasonable estimate of their intrinsic value.
Our risk rating sets the margin of safety or the fair value estimate range we assign to each stock. In the image immediately above, we show this probable range of fair values for Apple. We think the firm is very attractive below $128 per share (the green line), but quite expensive above $192 per share (the red line). The prices that fall along the yellow line, which includes our fair value estimate, represent a reasonable valuation for the firm, in our opinion.
With Apple’s shares trading at ~$170 each at the time of this writing, there is still plenty of upside potential based on our fair value estimate range (to north of $190 per share). But more importantly, the point fair value estimate and fair value range show that Apple has a very firm cash-based valuation foundation, even as it trades for 30x this year’s consensus earnings expectations (based on a price-observed P/E basis; $170 per share divided by $5.75 per share).
Apple’s Key Investment Considerations
Let’s talk fundamentals. From our perspective, Apple is as much a brand as it is one of the world’s most innovative companies. The company is no longer known for its iPods and personal computers thanks to the proliferation of the iPhone over the past decade, which comprises the majority of sales.
In September 2021, Apple unveiled the iPhone 13 lineup. Major telecom companies in the US and elsewhere have been heavily subsidizing the offering to win over customers that are willing to sign up for long-term wireless contracts. That dynamic in turn has supported Apple’s hardware sales and should continue to do so going forward. Apple’s hardware offerings remain incredibly appealing to consumers.
The company’s execution remains top notch, too (as evidenced by its most recently reported quarter), and we expect it to continue to roll out innovative products in smartphones and wearable technology. Here’s a breakdown of its major revenue segments for the three months ended December 25 (2021 versus 2020).
Apple’s product revenue breakdown. (Apple)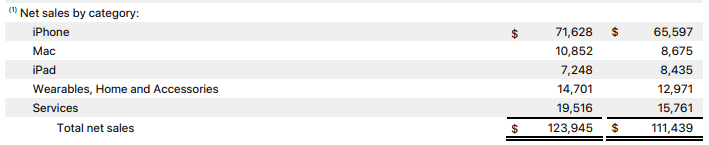
Though there are always risks to any long-term story, Apple’s rollout of future iterations of the iPhone should propel fundamentals for years and decades to come, in our view. Though we’re not embedding another blockbuster hit in our valuation model, we wouldn’t be surprised if Apple delivers another in the coming years. The sky is the limit when it comes to innovation at Apple, in our view.
Apple’s growing ‘Services’ segment also bodes well for its long-term profitability, and the segment is growing like a weed. Apple Pay is now accepted by a large percentage of US retailers, and paid subscriptions are surging. The company’s customer loyalty (the Apple ‘halo’ effect) and installed base of devices are key competitive advantages, given it moaty characteristics.
Wearables has been an area of strength, too, and Apple holds a large share of global smartwatch market. In the recent past, Apple has improved the capabilities of its Apple Watch to include more health and fitness related offerings (such as adding heartbeat monitoring and electrocardiogram monitoring systems, and sleep tracking capabilities, among other things). Apple recently launched Apple Watch Series 7.
Though we’re not too worried given Apple’s bargaining power over suppliers, investors should pay close attention to the firm’s gross margin. Pricing and cost pressures may be unavoidable at times, and currency exchange rates should not be ignored as Apple generates ~60% of its revenue outside the US. Here’s how things broke down geographically for the three months ended December 25 (2021 versus 2020).
Apple’s geographic sales breakdown. (Apple)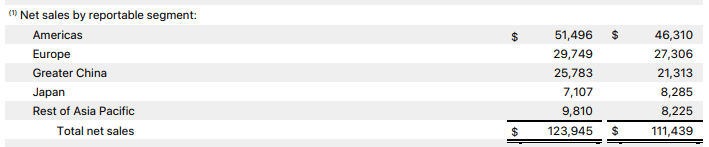
As we noted at the beginning of this article, Apple’s balance sheet net cash hoard is more than the market caps of some the largest firms in the S&P 500. Apple spent ~$86.0 billion repurchasing its stock in fiscal 2021, and it still retains tremendous financial flexibility. The company’s dividend growth potential may be unmatched, too. The Dividend Cushion Cash Flow Bridge, shown in the image below, illustrates the components of the Dividend Cushion ratio for Apple and highlights why we think Apple’s dividend growth potential is simply fantastic.
How we think about the health of Apple’s dividend. (Valuentum)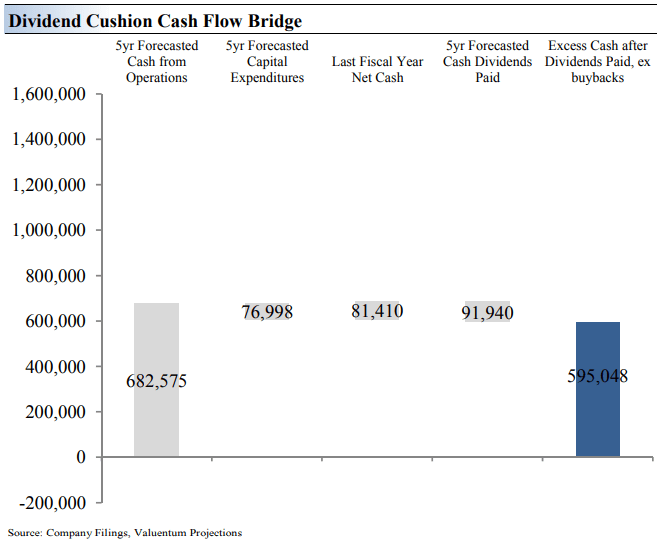
As shown above, Apple’s Dividend Cushion Cash Flow Bridge reveals that the sum of the company’s 5-year forecasted cumulative free cash flow generation, as measured by cash flow from operations less all capital spending, plus its net cash/debt position on the balance sheet, as of the last fiscal year, is greater than the sum of the next 5 years of expected cash dividends paid. Because the Dividend Cushion ratio is forward-looking and captures the trajectory of the company’s free cash flow generation and dividend growth, it reveals whether there will be a cash surplus or a cash shortfall at the end of the 5-year period, taking into consideration the leverage on the balance sheet, a key source of risk.
On a fundamental basis, we believe companies that have a strong net cash position on the balance sheet and are generating a significant amount of free cash flow (stocks such as Apple) are better able to pay and grow their dividend over time. Firms that are buried under a mountain of debt and do not sufficiently cover their dividend with free cash flow are more at risk of a dividend cut or a suspension of growth, all else equal, in our opinion. Generally speaking, the greater the ‘blue bar’ to the right is in the positive, the more durable a company’s dividend, and the greater the ‘blue bar’ to the right is in the negative, the less durable a company’s dividend.
Apple’s ‘blue bar’ in the image above is hugely positive, revealing a tremendous amount of capacity for future dividend increases. Shares yield ~0.55% at the time of this writing.
Apple’s Fiscal First-Quarter Earnings Update
On January 27, 2022, Apple put up one of the best quarters by any company in history and a record for the Cupertino-based iPhone-making giant. Revenue for the quarter ending December 25, 2021, of $123.9 billion advanced 11% on a year-over-year basis, while quarterly earnings per share came in at $2.10. The top line beat expectations by more than $5 billion, even with supply chain hurdles, and the bottom-line beat of $0.20 per share was more than 10%, a huge delta considering the size of the company.
We’re viewing the report very positively, and we think the strong performance may ease some broader market concerns (as shown by trading activity January 28). Apple’s gross and operating margins looked healthy, and only performance in its iPad division came in a bit light, but this was almost entirely driven by supply chain issues. Apple generated a solid $19.5 billion in revenue from its ‘Services’ division during the period, up from $15.8 billion in the year-ago quarter, showcasing its ever-growing and “sticky” installed base.
For the three months ended December 25, 2021, cash flow from operations leapt to $47 billion from $38.8 billion in the year-ago period, while capital spending fell to $2.8 billion from $3.5 billion in last year’s quarter. Apple’s traditional free cash flow generation is simply incredible (one of the key themes of this article)! The company ended the quarter with $202.6 billion in total cash and marketable securities versus $122.8 billion in term debt and commercial paper, good for a solid net cash position. As we have been pounding the table in this note, Apple’s tremendous free cash flow generation and huge net cash position support our cash-based intrinsic value estimate.
Looking ahead, the market will likely look past any commentary on the conference call given difficult year-over-year comparisons, and we continue to point to the area of large cap growth and big cap tech as the place to be in this volatile market environment. Warren Buffett is a big owner of Apple’s stock, and we continue to be in favor of buybacks at Apple, even at these price levels. Though Apple’s market capitalization is sizable, we value shares close to $190 each at the high end of our fair value estimate range. Apple remains one of our favorite ideas, and it’s hard not to like the fundamental momentum.
Apple’s Economic Profit Analysis
Let’s now talk about the holy grail of financial statement analysis, ROIC!
The best measure of a firm’s ability to create value for shareholders is expressed by comparing its return on invested capital with its weighted average cost of capital. The gap or difference between ROIC and WACC is called the firm’s economic profit spread. Apple’s 3-year historical return on invested capital (without goodwill) is 34.8%, which is above the estimate of its cost of capital of 7.4%.
As such, we assign Apple a strong value-creation rating. In the chart below, we show the probable path of ROIC in the years ahead based on the estimated volatility of key drivers behind the measure. The solid grey line reflects the most likely outcome, in our opinion, and represents the scenario that results in our fair value estimate. We like to think in terms of ranges of probable fair value outcomes, and ROIC in no different.
Apple is a fantastic economic-profit generator. (Valuentum)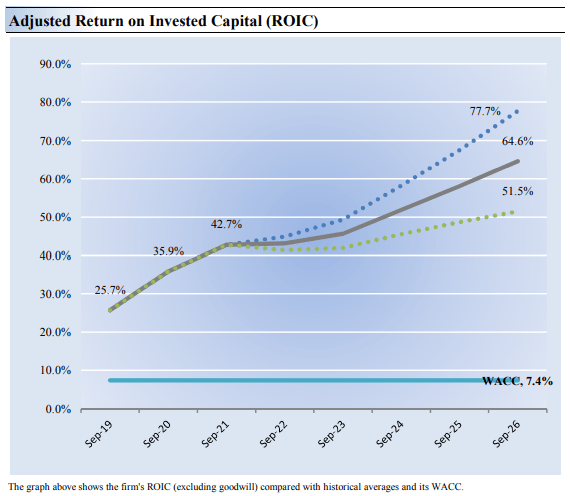
Future Path of Estimated Fair Value
We estimate Apple’s fair value at this point in time to be about $160 per share. As time passes, however, companies generate cash flow and pay out cash to shareholders in the form of dividends. The chart below compares the firm’s current share price with the path of Apple’s expected equity value per share over the next three years, assuming our long-term projections prove accurate. The range between the resulting downside fair value and upside fair value in Year 3 represents our best estimate of the value of the firm’s shares three years hence.
This range of potential outcomes is also subject to change over time, should our views on Apple’s future cash flow potential change. The expected fair value of $196 per share in Year 3 represents our existing fair value per share of $160 increased at an annual rate of the firm’s cost of equity less its dividend yield. The upside and downside ranges are derived in the same way, but from the upper and lower bounds of our fair value estimate range. Note that when this particular graph was created, shares of Apple were trading a bit lower than its current share price.
Our forecasts for the future expected path of Apple’s estimated fair value. (Valuentum)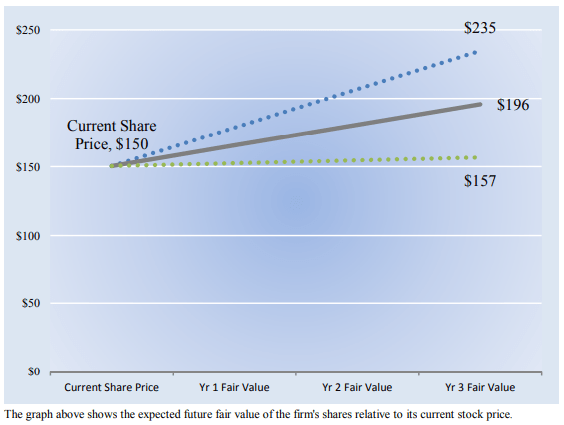
Concluding Thoughts
In addition to its bread-and-butter iPhone, Apple’s growing ‘Services’ business should provide a major tailwind for Apple’s revenue growth trajectory, aided by secular growth tailwinds such as the growing adoption of fintech offerings (Apple Card is well-positioned here) and the ongoing proliferation of video streaming services (Apple TV+ is well-positioned here). We’re also excited about its offerings in the realm of health and fitness. For instance, Apple’s Fitness+ exercise tracking app powered by its Apple Watch is a prime example of its efforts on this front.
That said, Apple is not immune to the headwinds facing global supply chains (as its iPad division revealed more recently), though its fortress-like balance sheet and stellar free cash flow generating abilities should help the company ride out near-term hurdles with its bright growth trajectory intact. All told, we are huge fans of the tech behemoth, like its shares, and could envision them running to the high end of our fair value estimate range, to north of $190. Apple’s firm financial foundation remains unshaken in this volatile stock market. What an unbelievable moaty, net cash rich, free cash flow generating, secular growth powerhouse with strong dividend growth prospects to boot!


