

The accumulation trend score is an on-chain indicator used to determine whether entities are actively accumulating coins. It’s a much better indicator of the overall market sentiment toward buying and selling, as one can apply it to any cohort to determine the behavior of any particular group.
The indicator comprises two metrics — an entity’s participation score and balance change score. An entity’s participation score represents its overall coin balance, while the balance change score represents the number of new coins bought or sold over one month.
An accumulation trend score closer to 1 shows that the largest part of the network is accumulating, while a score closer to 0 shows that the network is mainly distributing its coins.
When applied to Bitcoin, the accumulation trend score provides great insight into market participants’ balance size and behavior over one month. Exchanges and miners are excluded from the metric to make the data more representative of the market conditions,
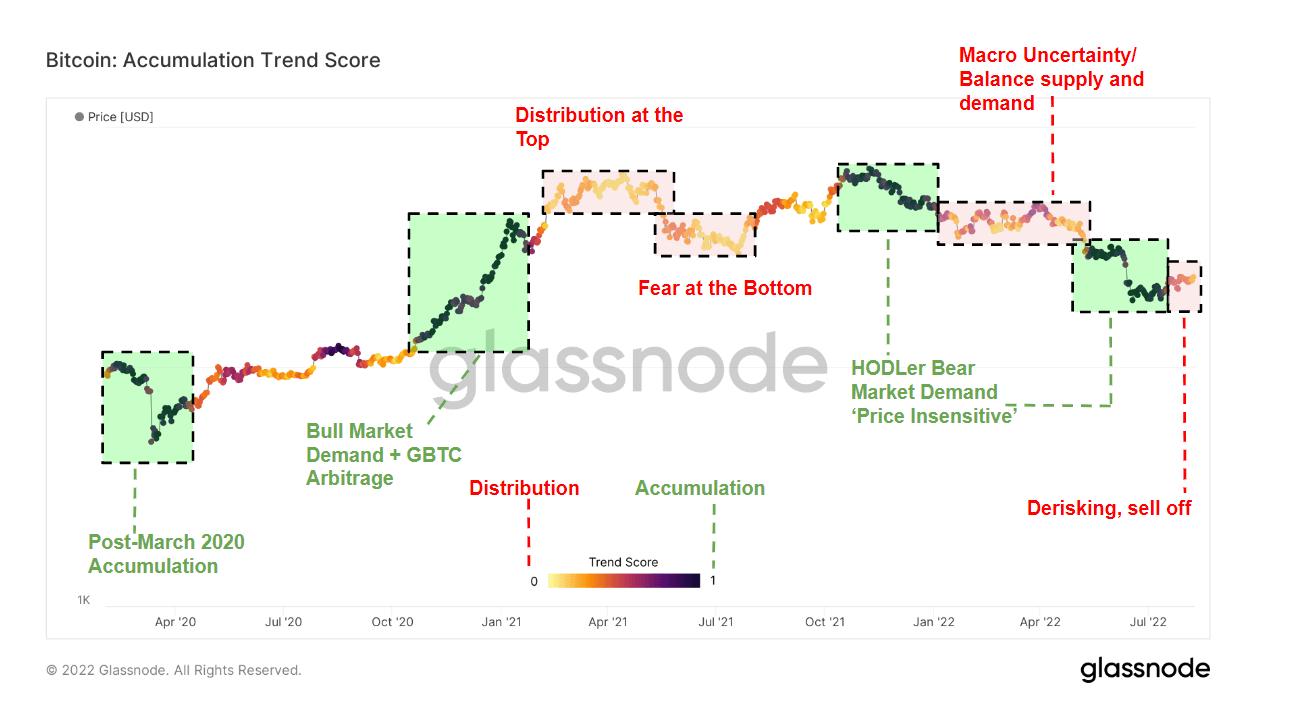
Bitcoin’s accumulation trend score from April 2020 to August 2022 shows four distinct accumulation periods. Highlighted green on the chart above, the accumulation periods occurred in March 2020, early 2021, early 2022, and late May 2022. The most significant accumulation rate was seen in March 2020 as the onset of the COVID-19 pandemic crushed global markets. The major sell-off we’ve seen in the wake of the Terra (LUNA) crash in late May and early July triggered a major accumulation spree.
Highlighted in red and yellow, periods of coin distribution followed all periods of accumulation. Some of the highest rates of coin distribution were seen during the exodus of miners from China in the summer of 2021 and the start of Russia’s invasion of Ukraine in February 2022. This summer has also seen many addresses sell their BTC as macro uncertainty pushes more investors to de-risk their portfolios.
Breaking down the accumulation trend score by cohorts reveals the behaviors of two major groups on the Bitcoin network — whales and shrimps. Whales are defined as addresses owning more than 1,000 BTC, while shrimps are addresses with less than 1 BTC.
Throughout July, both whales and shrimps have been aggressively accumulating BTC. The chart below shows the rate of accumulation by cohorts, with whales, shrimp, and everyone in between accumulating for the entire month.
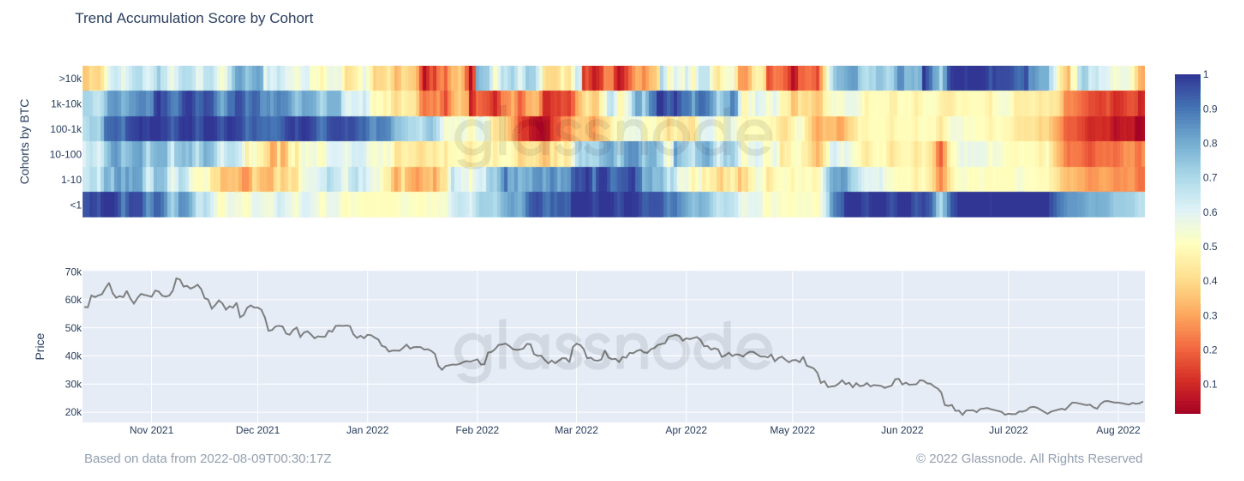
However, as August progresses, the rate of accumulation among whales is beginning to decrease. The overall macro uncertainty has pushed many large holders to de-risk and sell off their BTC holdings. Many investors are anticipating a hard winter and looking to get as much liquidity as possible.
The only entities still stacking BTC are shrimps, which have kept accumulating even when the majority of large holders began selling off. July was the most significant accumulation month for small holders since 2018, with shrimp increasing their balance by over 60,000 BTC in a single month. The second-largest accumulation was in December 2017 as Bitcoin reached its all-time high when shrimp accumulated 52,000 BTC in a month.
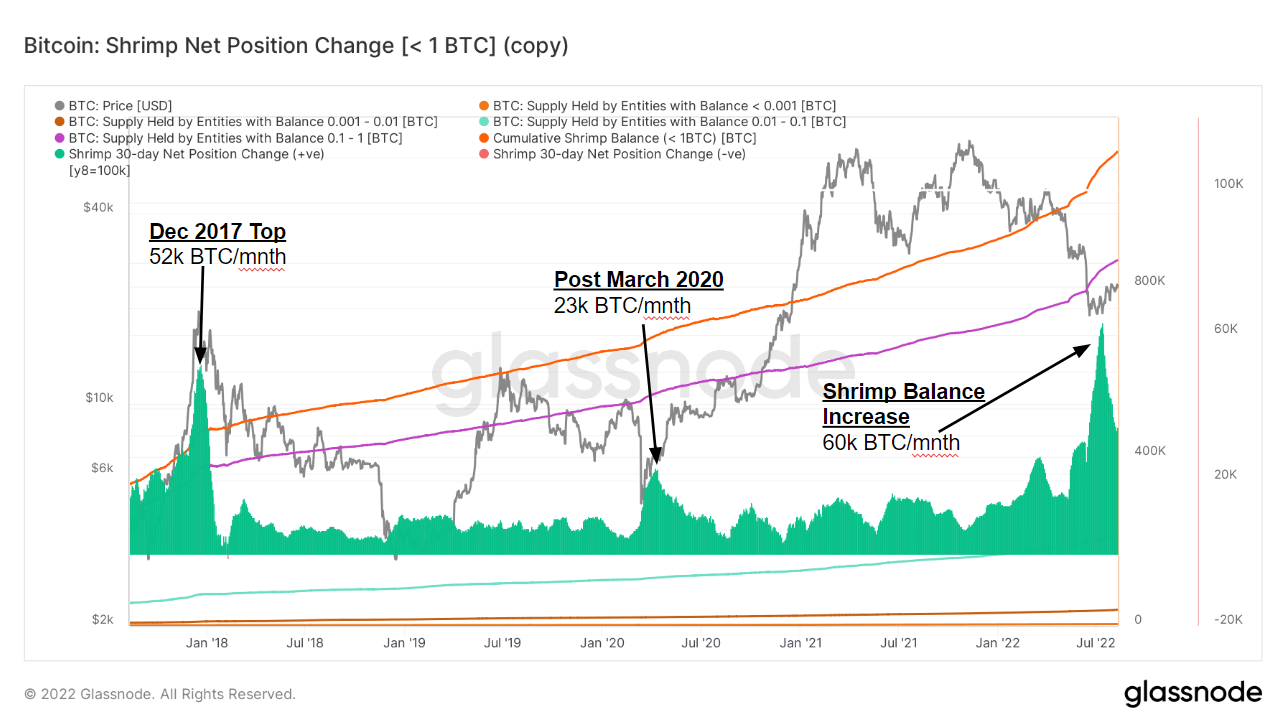
This shows that small holders see Bitcoin’s price of around $20,000 as very attractive and continue to acquire coins for long-term investment, even if its price remains flat.

 launches blockchain-based private social club")
