

- Market could be making a mistake by pricing in a 100% Fed rate cut for September
- Bitcoin maintained a bearish bias on the weekly chart and could struggle to recover till October/November
The Federal Reserve’s Open Market Committee (FOMC) statement on 31 July noted that inflation had eased in recent months. Even so, it remained elevated and targeted a federal funds rate of 5.25%-5.5%.
This has reduced the chances of a major Fed rate cut in September, the likelihood of which affected traditional equities and saw Bitcoin initiate its freefall toward $49k. The Japanese Yen carry trade took BTC to its lows, but also brought in talk of a significant rate cut to combat recession risks.
Market expectations of a Fed rate cut
Such a cut can be beneficial for risk-on assets such as Bitcoin [BTC]. In fact, an uptick in global liquidity can spark the next bull run.
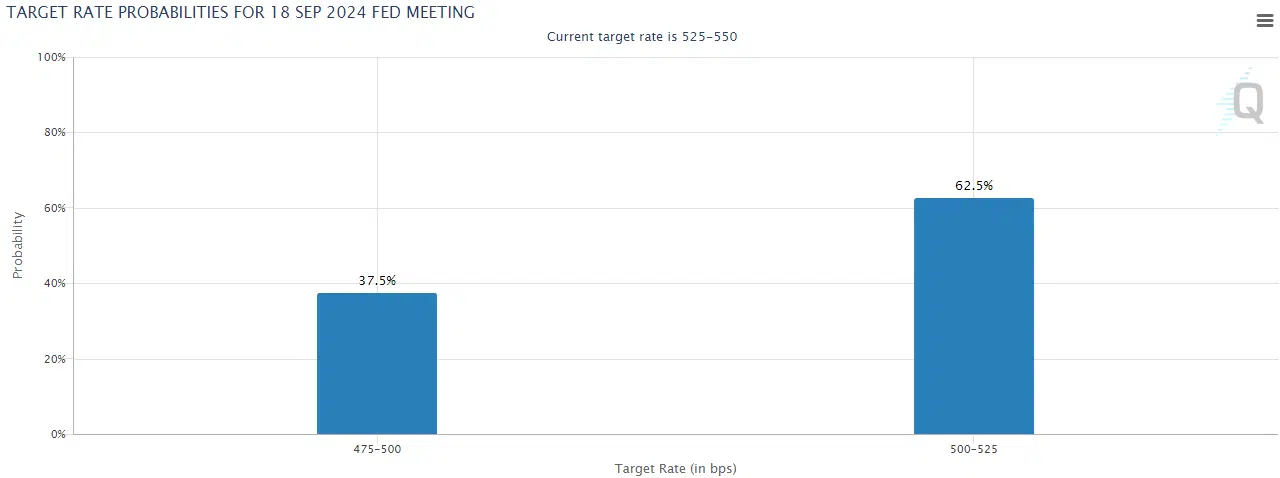
Source: FedWatch
The target rate probabilities revealed that a majority of the market anticipates a 25 basis point rate cut in September, with the more optimistic but minority group expecting a 50 bps cut.
And yet, the market could be making a mistake by pricing in a 100% Fed rate cut for September, warned an equity analyst. In an interview, Justin Elliot, portfolio manager at Caldwell Investment Management, noted that the market might be getting ahead of itself.
“The market pricing in a 100 basis points of cuts by the end of the year is a potential risk. The economy is still holding up fairly well, retail sales are fairly strong, unemployment is still rising but low on a historical basis.”
This could see estimate cuts as the year goes on, he added. This perspective could help ground the more enthusiastic market participants that BTC is probably not going to the moon in Q4 2024 and Q1 2025 on the back of the Fed rate cuts.
Where does Bitcoin stand in the bigger picture?
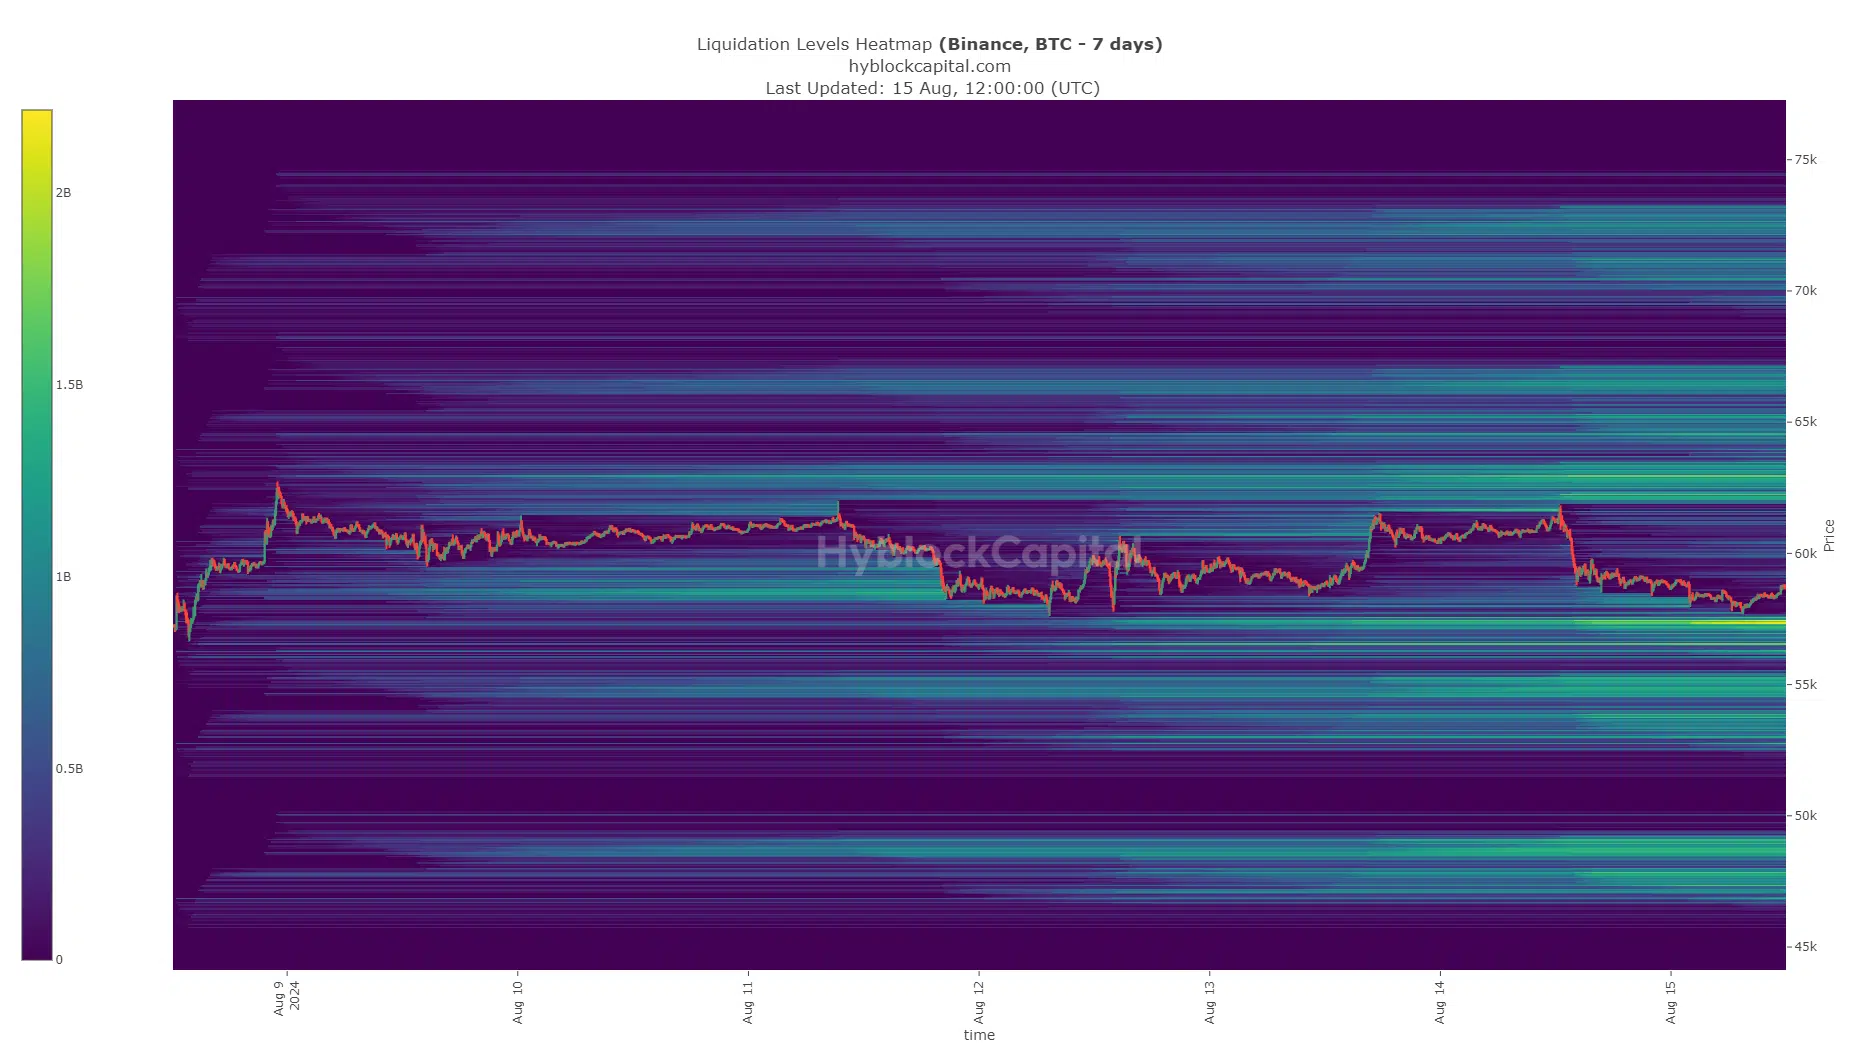
Source: Hyblock
The short-term liquidity chart revealed that towards the south, $57.4k was the immediate target, with $55k another likely target. To the north, the $62k-$63k zone was also an attractive liquidity zone.
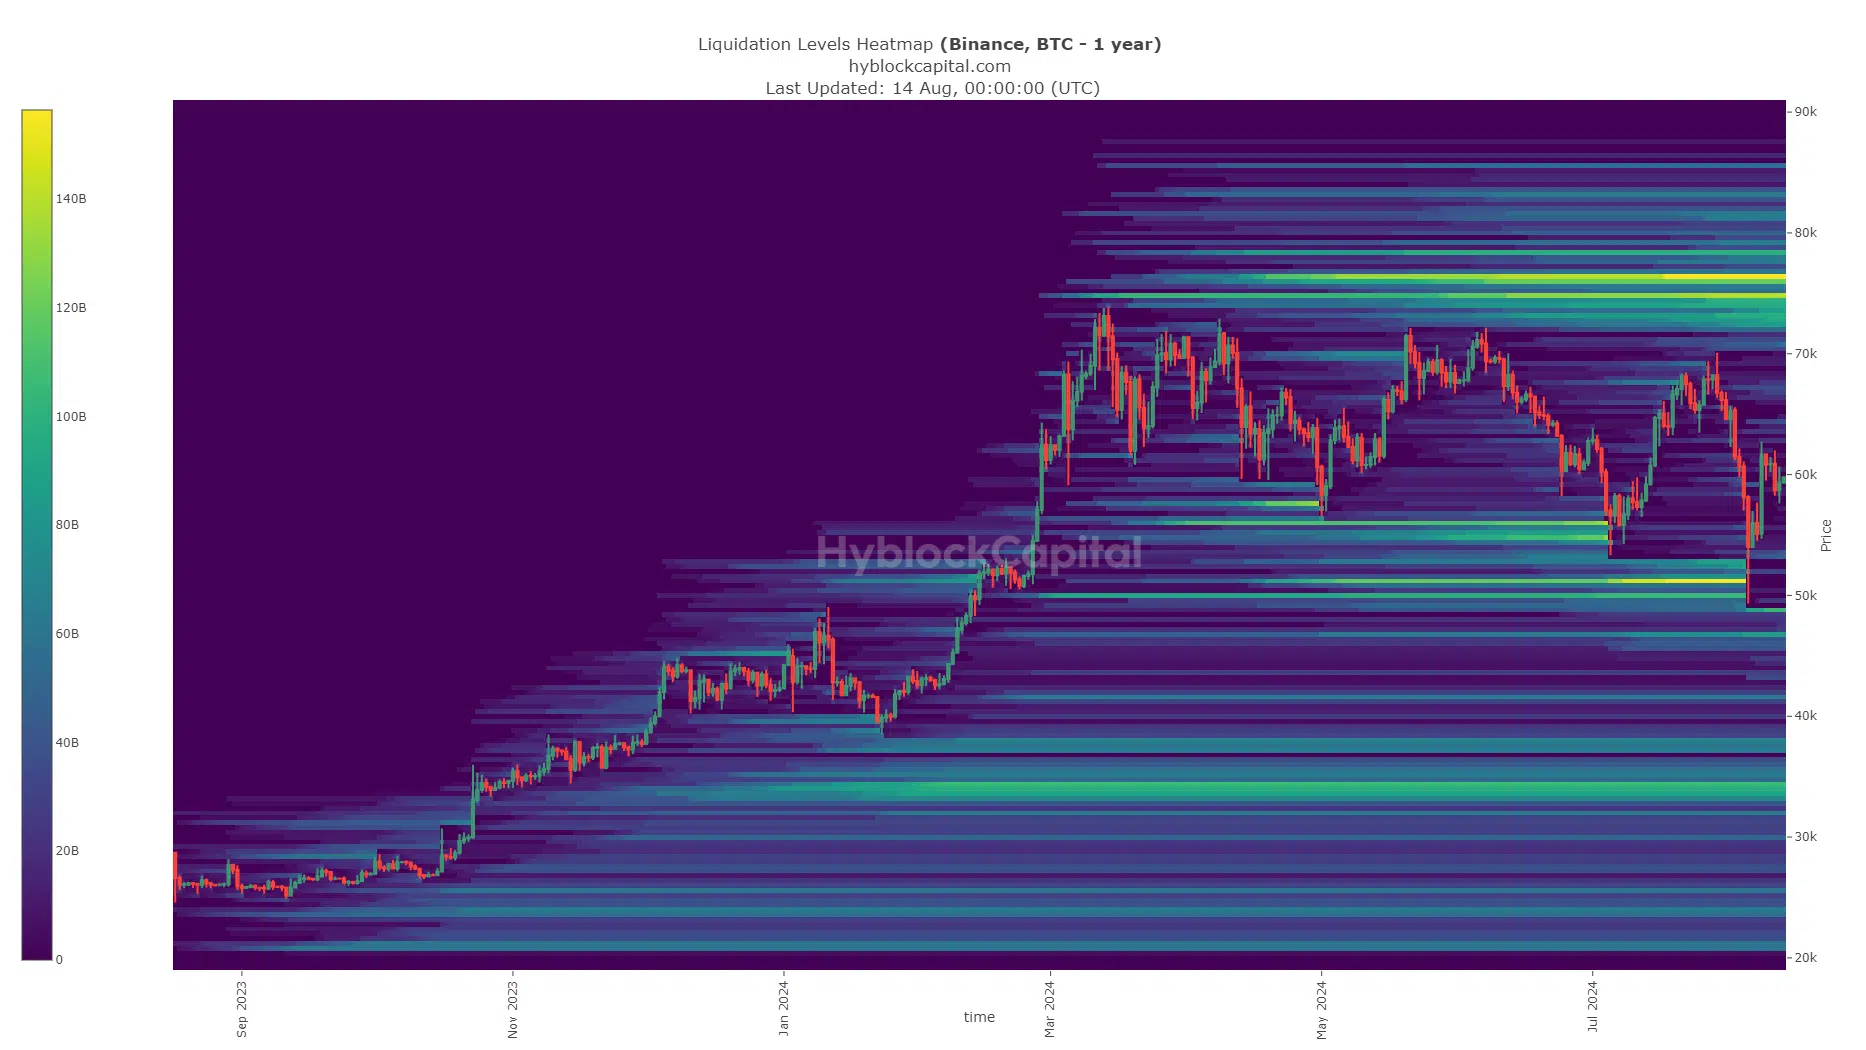
Source: Hyblock
On the contrary, the 1-year lookback chart highlighted how key the $51.2k zone was. A sweep of this level was followed by a swift bounce.
Here, it’s worth noting that the strong band of liquidation levels above $70k is not under immediate threat.
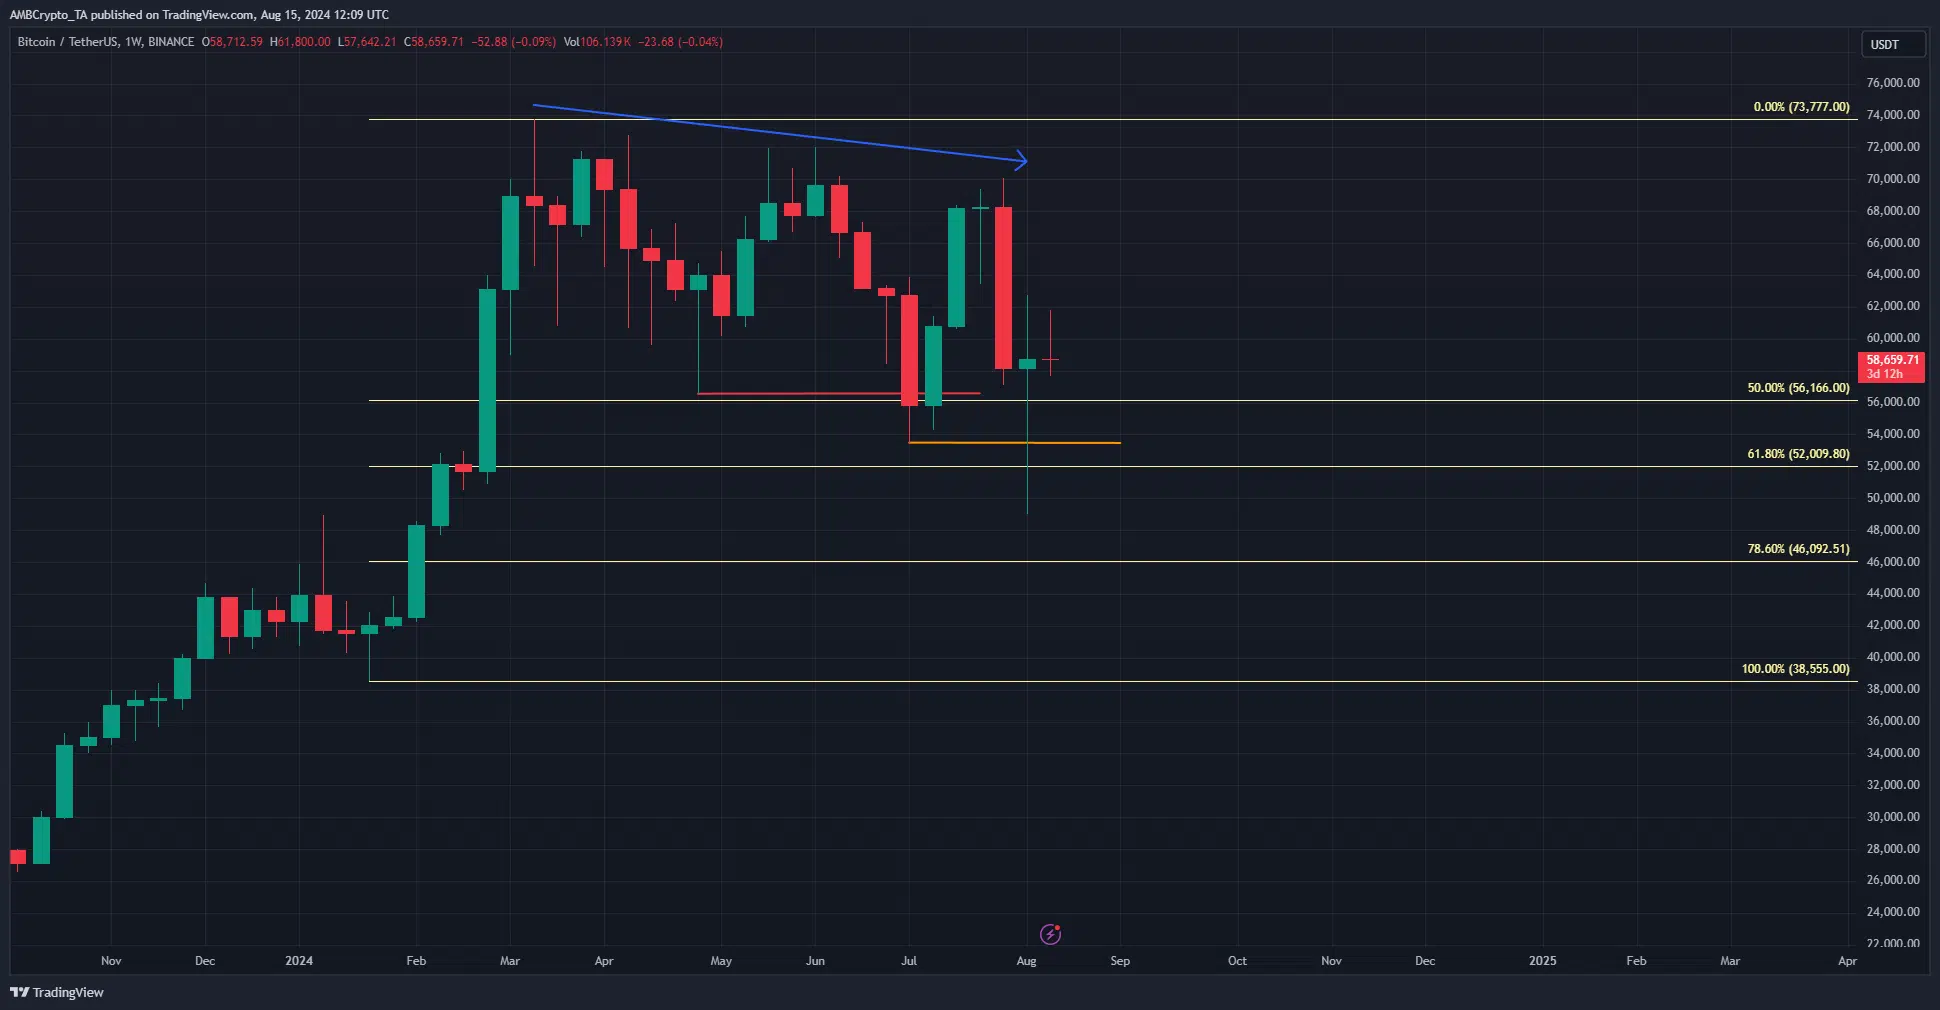
Source: BTC/USDT on TradingView
This, because of the bearish structure of Bitcoin on the weekly chart. It has formed two lower lows since April. The plunge to $49k on 5 August was quickly reversed, but the bearish trend remained.
Is your portfolio green? Check the Bitcoin Profit Calculator
A weekly trading session close above $70k is required to shift the trend, and this might not happen in the next month or two. After a sharp retracement, BTC generally requires time to consolidate.
News of a Fed rate cut in September and November might see a trend shift begin. However, as things stand, Bitcoin does not yet appear ready to break out past $70k.


