

Despite its recent push for recovery Bitcoin is currently dealing with a potentially negative development. Bitcoin is currently trading at $87,124 down 0.44% on the day. It has come across a crucial technical formation, a mini-death cross which is the intersection of the 50 and 100 EMA and is frequently seen as an early indicator of trend reversal and waning momentum.
When the market as a whole lacks the volume to support long-term rallies this crossover between the 50-day and 100-day EMA usually indicates increasing bearish pressure in the medium term. The declining slope of both moving averages in the case of Bitcoin tells a different story even though the price action has remained relatively strong with higher lows and a strong bounce from the 200 EMA near $85,500.
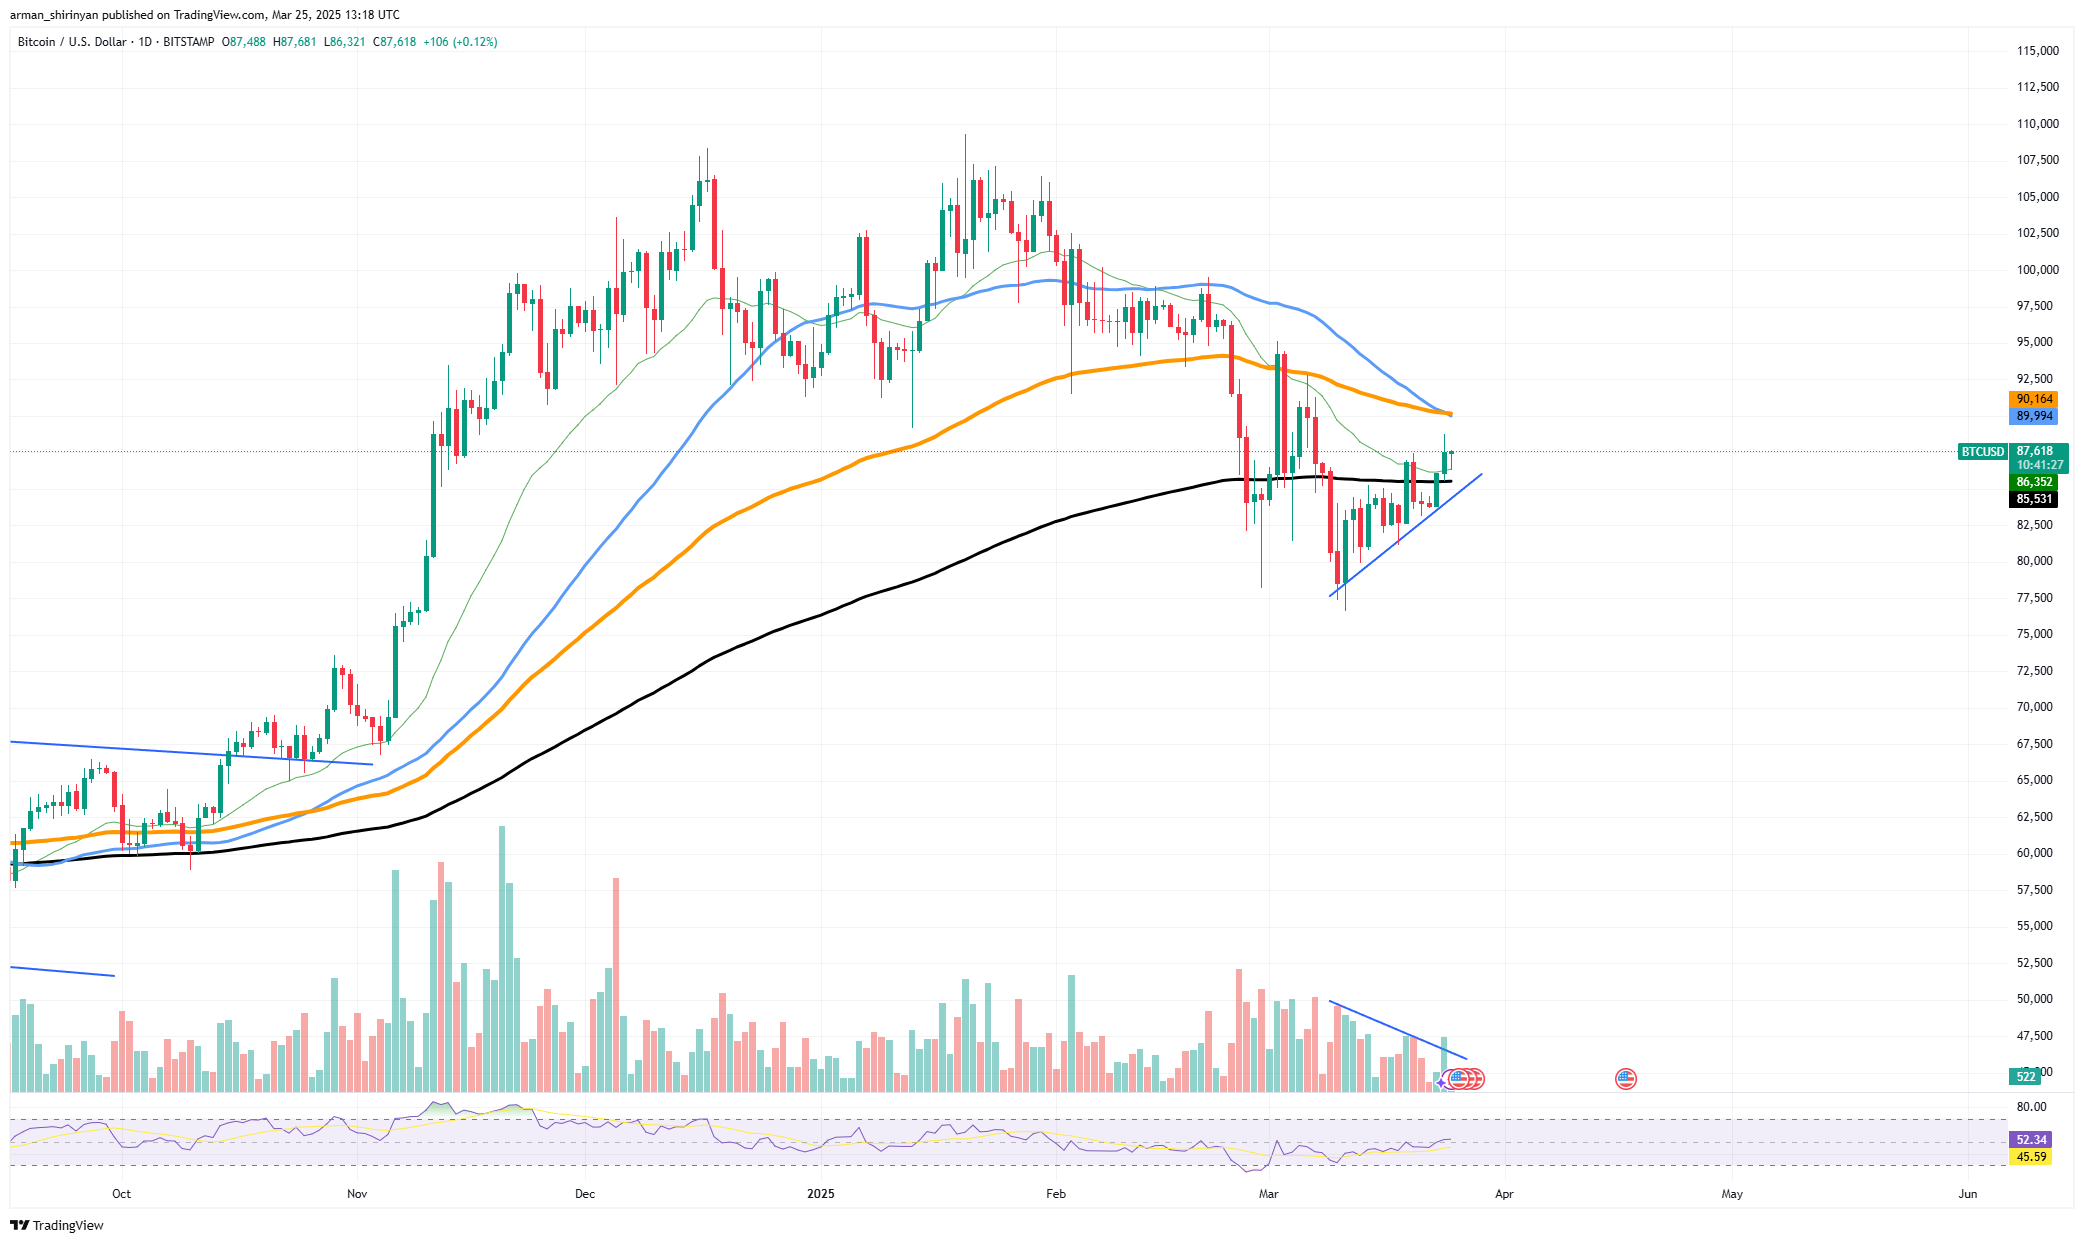
Volume is still low which adds to the ambiguity surrounding Bitcoin’s recent surge. The attempt by Bitcoin to recover $90,000 was stopped just short of the crucial resistance zone indicated by the 50 and 100 EMA even though it had risen from local lows. If there isn’t a breakout supported by substantial volume this moves momentum could stall. The market’s indecision is reflected in the RSI’s neutrality at 51.39.
This level does not confirm strong bullish pressure but it does allow for additional upward movement. In summary the crossover of the 50 and 100 EMA serves as a warning sign even though Bitcoin’s short-term structure may still appear positive. The bullish recovery may be in jeopardy if Bitcoin doesn’t make a strong break above $90,000 in the near future as indicated by this mini-death cross.
The next support level to keep an eye on is around $85,500 if downward pressure returns and the price drops below the rising trendline. Even though the general sentiment is still positive the technicals currently point to caution.
XRP momentum winds down
Just days ago XRP seemed to make a technical breakout but now it is displaying signs of indecision. After attempting to challenge the upper boundary of the descending channel and pushing above the 50 EMA around $2.39 the asset has slightly retracted and is currently trading at $2.44 with a daily loss of 0.32%. Although the price is still above the 50 EMA there are worries that the most recent move may have been a fake breakout due to the lack of follow-through and decreasing volume.
Related

This hesitancy is reflected in momentum indicators such as the RSI which shows that the index is neutral at 51.84 with no obvious bullish or bearish signal. XRP is currently hovering just above a support cluster on the chart that was created by the 50 EMA ($2.39) and 100 EMA ($2.31). Maintaining these levels will be essential for the asset to continue moving upward.
The next level at which the 200 EMA serves as macro support could be exposed by a breakdown below $2.31. XRP encounters resistance to the upside in the $2.60–$2.70 region which is the upper trendline of the descending channel. A move toward $3.00 might be triggered by a confirmed daily close above this level which would revalidate the bullish breakout narrative.
Investors should keep an eye on the following important levels for the time being: $1. 92 as the last line of defense for the current structure $2. 60 as breakout confirmation and $2. 31 as short-term support. Given that the market is waiting for a catalyst to decide on its next course, the lack of volume indicates that caution is necessary.
Dogecoin falls behind
Dogecoin, one of the major digital assets, is still one of the few that has not confirmed a significant breakout. It is currently trading at $0.18 up a meager 1.76% intraday. DOGE is still trailing behind battling at a crucial technical threshold the 26-day EMA while the majority of the top-tier cryptocurrencies have either broken above important moving averages or started trend reversals.
Related

The 26 EMA is currently at $0.18 just below DOGE which has not managed to achieve a clear daily close above this short-term resistance. This moving average is usually the first barrier that separates early trend recovery from bearish continuation. Higher resistance levels at $0.21 and possibly the 50 EMA close to $0.24 would become accessible with a clear break above it.
The price structure indicates that DOGE has just recovered from a solid support base that has been in place since mid-March at $0.15. Nevertheless the asset has failed to garner enough momentum to replicate the recoveries observed in Bitcoin XRP and Shiba Inu all of which have broken above at least one significant EMA despite the bounce.
With the RSI at 48.57 right now there isn’t much bullish or bearish momentum which indicates indecision. Additionally the volume is still low indicating that traders are holding off on reentering the market until a more distinct technical signal is received.


