Editor’s note: Seeking Alpha is proud to welcome Andrew Feazelle as a new contributor. It’s easy to become a Seeking Alpha contributor and earn money for your best investment ideas. Active contributors also get free access to SA Premium. Click here to find out more »

da-kuk/E+ via Getty Images
Bitcoin (BTC-USD) is near fair value and has the potential to rise significantly over twelve months based on its network driven fundamentals. As its user base grows, as evidenced by a growth in total unique addresses that ever appeared in a transaction on the network, such should drive price appreciation per the historical relationship between its price and network size. Considering its network is still relatively small and still has plenty of room to grow, long term investors would not do wrong in dollar cost averaging into BTC at the present, while also holding dry powder for pull backs that will likely occur throughout 2022, secondary to inflation and Federal Reserve policy related headlines, etc. Portfolio allocation should be consistent with an individual’s tolerance for speculative assets (generally 1%-6% of one’s portfolio, as per Yale economist Aleh Tsyvinski).
The Network Effect
When searching for value in blockchain tokens one must first examine the concept of building value in traditional business via network effects. Large-cap tech companies like Amazon (NASDAQ:AMZN) and Meta Platforms (NASDAQ:FB) have utilized the network effect to drive growth over relatively short periods of time. For example, the former was able to build their business by allowing merchants from all facets of the retail world to come to a single trading post. This then drove greater volumes of consumers, motivated by the ease of finding anything they want in one place, which then motivated more merchants to show up, and so on; a positive feedback loop was born.
Furthermore, as more people became Prime members, this drove the construction of local warehouses, which then attracted more prime members, etc. Ratings and reviews gave shoppers a chance to read the opinions of multiple previous buyers of a given product, giving them a higher degree of confidence in their purchase and thus garnering sales and more reviews. This “social networking” concerning the quality of a given product, which couldn’t be replicated at the brick-and-mortar level, again provided exponential increases in consumer traffic to the site.
Peter Fisk explains Metcalfe’s Law as it applies to the digital business world:
Metcalfe’s Law says that a network’s value is proportional to the square of the number of nodes in the network. The end nodes can be computers, servers and simply users. For example, if a network has 10 nodes, its inherent value is 100 (10×10=100). Add one more node, and the value is 121. Add another and the value jumps to 144. Non-linear, exponential, growth.
Network effects have become an essential component of successful digital businesses. First, the Internet itself has become a facilitator for network effects. As it becomes less and less expensive to connect users on platforms, those able to attract them in mass become extremely valuable over time. Also, network effects facilitate scale. As digital businesses and platforms scale, they gain a competitive advantage, as they control more of a market. Third, network effects create a competitive advantage.
Incidentally this network effect may also explain Bitcoin’s “moatiness,” or resistance to other “me too” blockchain networks from cannibalizing it; it has a first mover advantage. Indeed, having been born in 2009, it has survived over 10 years – the time interval in which, in the traditional equity markets, a stock’s price reflects its underlying fundamental value over 90% of the time, hence the Warren Buffett saying: “If you’re not willing to hold the stock 10 years, don’t even think of holding it 10 minutes.”
Calculating Fair Value
Taking into account the network effect and that Bitcoin must have some fundamental value for lasting over 10 years in the market, can this value be quantified utilizing the size and growth of its network? Similar to how a value investor may examine a stock’s forward P/E against its average P/E over a 10-year period (i.e., at what price were traders willing to pay for a given earnings on average inside this period), we could attempt to examine at what price were Bitcoin traders willing to pay for the coin, based on its network size at the time of the transaction.
I pulled 10 years’ worth of two sets of data off of Glassnode: spot price quantized at a monthly interval, and corresponding “total unique addresses ever to have been involved in a transaction on chain,” which I utilize as a proxy for network size. I then looked at these monthly prices divided by the total addresses metric, the latter being noted in the millions.
P/N = Price to Network
P = BTC price
N = total addresses / 1,000,000

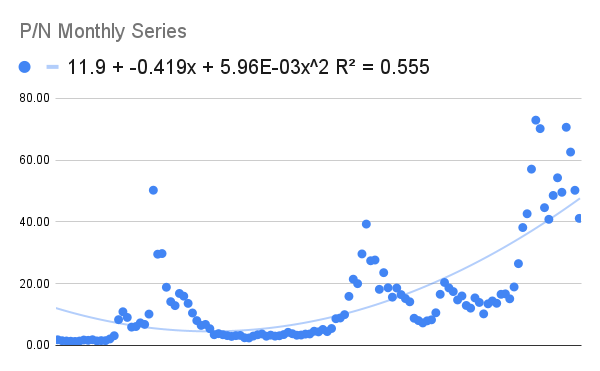
Price to Network Size, Monthly Series for Last 10 Years (Glassnode)
What we can see from this 10-year P/N series is that each subsequent bear market supports higher lows regarding the metric. This exponential trend makes the 10-year average P/N less relevant, especially since we have been recently transitioning away from retail speculation and into institutional investment. Still, for those wishing to respect the last 10 years of trading I’ve calculated the average:
Average P/N over 10 years = 15.5
The number is a bit spooky when considering the long term S&P P/E average is in the 15-16 range. Adding to the spookiness, I’ve also calculated the average BTC P/N from the nadir, occurring after the 2017 run up, to last month’s metric:
Average P/N from latest cycle bottom to last month = 29.22
Still kinda sounding like recent S&P P/E’s, right? Or at least those of the dot-com bubble, which all these blockchain token price actions seem to be mirroring. Back then any business with a website was being bid up to excessive P/Es (if they had earnings); these days any blockchain token that might show some future utility is getting the same treatment.
As of January 2022, there were approximately 935 million unique addresses registered on the blockchain, and thus the two numbers above would imply a fair value of $14,492 per BTC if we respect the 10 year history, or a fair value of $27,320 if we respect the trading found in the current bull market.
P/N x N = P
15.5 x 935 = $14,492
29.22 x 935 = $27,320
However if we respect the polynomial trendline built from the 10 year history (which out of all available curve fitting options – linear, exponential, power, etc. – yielded the best R value; though I have to admit 0.555 is not the best from a statistical point of view), such implies a current P/N “average” of 47.15. This then provides the following fair value:
47.15 x 935 = $44,085 = current fair value with respect to the trendline.
Such takes into account the idea that each subsequent market cycle will likely see higher highs and higher lows regarding P/N based on what we know so far.
Let’s now take a look at monthly price appreciation for a trend:

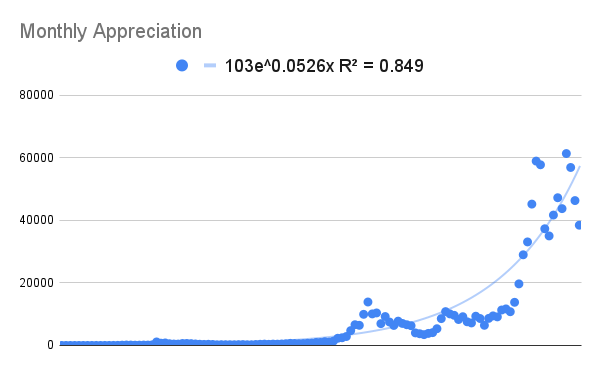
Price Appreciation, Monthly Series for Last 10 Years (Glassnode)
Note that the exponential trendline not only has a much higher R value than in our last chart, but that it acts as a basis for fair value. Buying Bitcoin underneath the trendline allows mostly good things to happen both in the near term and long term, while buying over the trendline makes it more likely to see near-term losses. Current fair value based on this line is as follows:
103 x e^(0.0526 x M) = $59,833
Where M = month number in the series = 121 for the month of January 2022.
I would be hesitant to extrapolate the trend out into the future too far as the number gets big quick and such is incongruent with real world capitalization limits. But we could examine a 12-month price target based on the trend:
103 x e^(0.0526 x M) = $112,479 where M = January 2023
We could finally examine a price series based off of our network adoption:

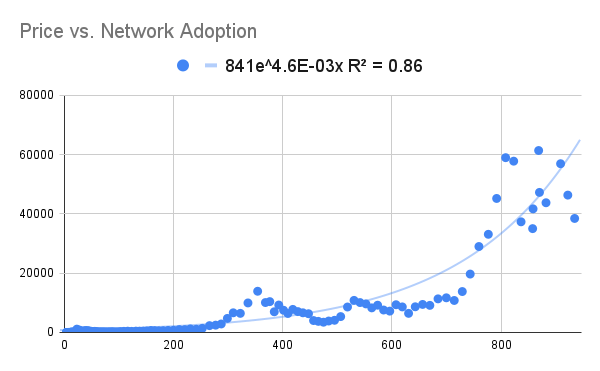
Price Vs. Network Size for Last 10 Years (Glassnode)
For our January 2022 network count of 935M addresses we are able to find a fair value of $62,043. Again, a relatively high R value may indicate we are onto something.
841 x e^(0.0046 x N) = $62,043
Where N = number of addresses
Respecting all of our different methodology above, we can find an average fair value for January 2022:
|
FV based on LT History (Average PN) |
$14,492 |
|
FV based on ST History (Average PN) |
$27,320 |
|
FV based on P/N Monthly Series Trend |
$44,085 |
|
FV based on Price Appreciation Trend |
$59,833 |
|
FV based on P vs. N Trend |
$62,043 |
|
Average FV for January 2022 |
$41,554 |
As of the time of writing this article Bitcoin is sitting at a little above $44,000, so traders are mostly correct with regard to my current fair value.
Calculating a January 2023 Price Target
We can now attempt a 12-month target based on the averages and trends explained above, but first we must calculate the number of addresses that will be on the network at that time:

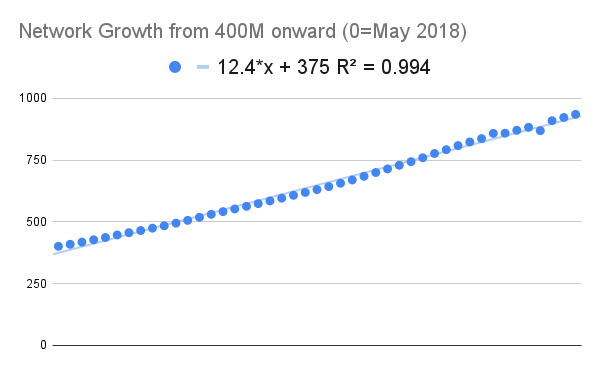
Network Growth Monthly Series, May 2018 to Present (Glassnode)
We can see with a high degree of correlation that for the last 4 years the network growth has been linear. If we are zeroed out in May 2018 on the series above then month 56 is where we need to look for our extrapolated 12-month number:
12.4 x 56 + 375 = 1,069 million unique addresses shown on the block chain in 12 months’ time.
This provides us with our first four numbers that are based on P/N averages and trends:
15.5 x 1,069 = $16,569 (Long Term Historical FV)
29.22 x 1,069 = $31,236 (Short Term Historical FV)
841 x e^(0.0046 x 1,069) = $114,920 (Price versus Network FV)
11.9 – 0.419x + (0.00596)x^2 = 61.6 = 12-month P/N
N = 1069
61.6 x 1069 = $65,849 (P/N monthly series trend FV)
Our fifth number is just the price appreciation trend extrapolated 12 months out:
103 x e^(0.0526 x M) = $112,479
M = month number 133 in the series
Again we can average all of our methodology to get our final January 2023 price target:
|
FV based on LT History (Average PN) |
$16,569 |
|
FV based on ST History (Average PN) |
$31.236 |
|
FV based on P/N Monthly Series Trend |
$65,849 |
|
FV based on Price Appreciation Trend |
$112,479 |
|
FV based on P vs. N Trend |
$114,920 |
|
Average FV for January 2023 |
$68,210 |
From the price of the time of writing to this 12-month price target we are thus looking at a potential 55% return on investment, all else being equal.
Conclusion
Bitcoin’s January 2022 fair value is $41,554 and its January 2023 price target is $68,210, based on the growing size of its network. Even though long-term investors should currently consider it similar to a “risk on” speculative small cap growth security, when calculating how much of their portfolio to allocate to it, its growth potential is compelling enough to currently initiate dollar cost averaging into a position, while keeping dry powder on hand for headline-related pullbacks throughout the year concerning inflation and Fed policy. Per Aleh Tsyvinski, this allocation should be between 1% and 6% of one’s portfolio.


