

Key Insights:
-
On Sunday, bitcoin (BTC) rose by 0.18% to end a record nine-week losing streak.
-
The upside came despite investor jitters over Fed monetary policy and a likely shift in the crypto regulatory landscape.
-
Bitcoin (BTC) technical indicators are bullish, with bitcoin sitting above the 100-day EMA.
On Sunday, bitcoin (BTC) rose by 0.18%. Following a 0.56% gain on Saturday, bitcoin ended the week up 1.51% to $29,898.
A bearish morning saw bitcoin fall to an early morning low of $29,517 before finding support.
Finding support at the First Major Support Level at $29,554, bitcoin struck an afternoon intraday high of $30,151.
Coming up against the First Major Resistance Level at $30,045, bitcoin fell back to end the day at sub-$30,000 for a third consecutive day.
For the bitcoin bulls, however, ending a nine-week losing streak could deliver much-needed support.
The Bitcoin Fear & Greed Index Hovers Deep in the Extreme Fear Zone
Today, the Fear & Greed Index rose from 10/100 to 13/100. The upside was modest, however, when considering bitcoin avoided a tenth consecutive week in the red.
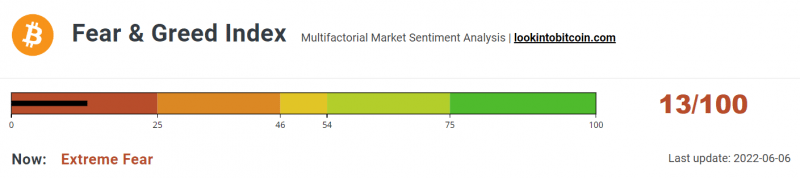
While remaining deep within the “Extreme Fear” zone, the Index continued to hold above May’s low of 8/100.
Chatter from lawmakers remained an area of interest over the weekend, with little else for the markets to consider.
Lawmakers talked of the risks to retail investors and the need for greater regulatory oversight, which limited the upside.
After brushing off a weekly loss for the NASDAQ last week, bitcoin tracked the NASDAQ in the early hours of this morning.
In recovery mode from Friday’s 2.47% sell-off, the NASDAQ Mini was up 42.75 points this morning.
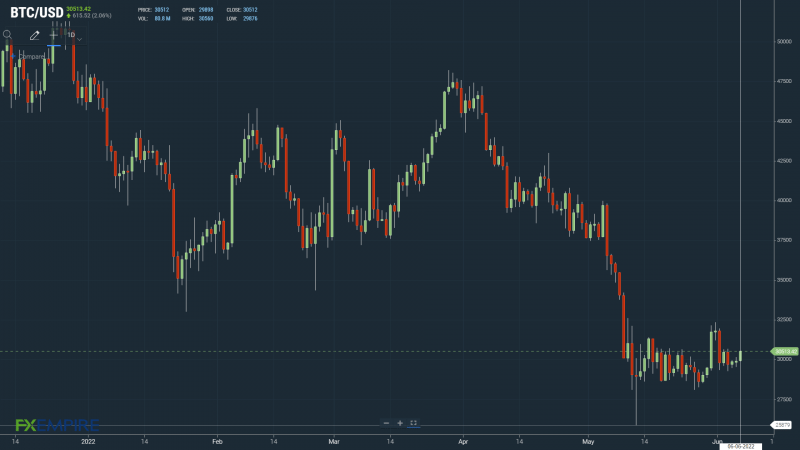
Bitcoin (BTC) Price Action
At the time of writing, BTC was up 2.06% to $30,512.
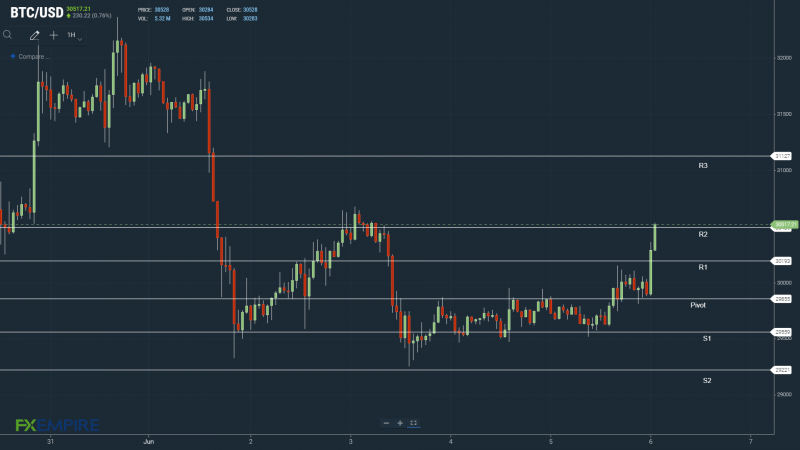
A bullish start to the day saw BTC break through the First Major Resistance Level at $30,193 and the Second Major Resistance Level at $30,489.
Significantly, bitcoin moved through $30,500, a key resistance level.
Technical Indicators
BTC will need to hold above the Major Resistance Levels and the $29,855 pivot to target the resistance at $31,000 and the Third Major Resistance Level at $31,127.
BTC would need the broader crypto market to support to return to $31,000 for the first time since May 30.
An extended rally would test resistance at $31,500.
A fall through the Major Resistance Levels and the pivot would test the First Major Support Level at $29,559. Barring an extended sell-off, BTC should steer clear of sub-$29,000 levels. The Second Major Support Level at $29,221 should limit the downside.
Looking at the EMAs and the 4-hourly candlestick chart (below), it is a bullish signal. Bitcoin sits above the 100-day EMA, currently at $30,256. The 50-day narrowed to the 100-day EMA. The 100-day EMA flattened on the 200-day EMA; BTC positive.
A move through to $31,000 would bring the 200-day EMA, currently at $31,686, into play.

This article was originally posted on FX Empire


