


Disclaimer: The opinions expressed by our writers are their own and do not represent the views of U.Today. The financial and market information provided on U.Today is intended for informational purposes only. U.Today is not liable for any financial losses incurred while trading cryptocurrencies. Conduct your own research by contacting financial experts before making any investment decisions. We believe that all content is accurate as of the date of publication, but certain offers mentioned may no longer be available.
Contents
As it battles to stay above the critical $60,000 support level, Bitcoin is now in a critical situation. This breach may indicate that the current bull run is coming to an end, which would make this bullish cycle weakest of them all.
Bitcoin is holding onto the $60,000 level, which is a significant psychological and technical support level, according to the daily BTC/USD chart. The picture that the moving averages present is unsettling. If this is broken, there could be a significant decline. A look at volume indicates more trading activity, particularly on the days when Bitcoin crossed the $60,000 threshold.
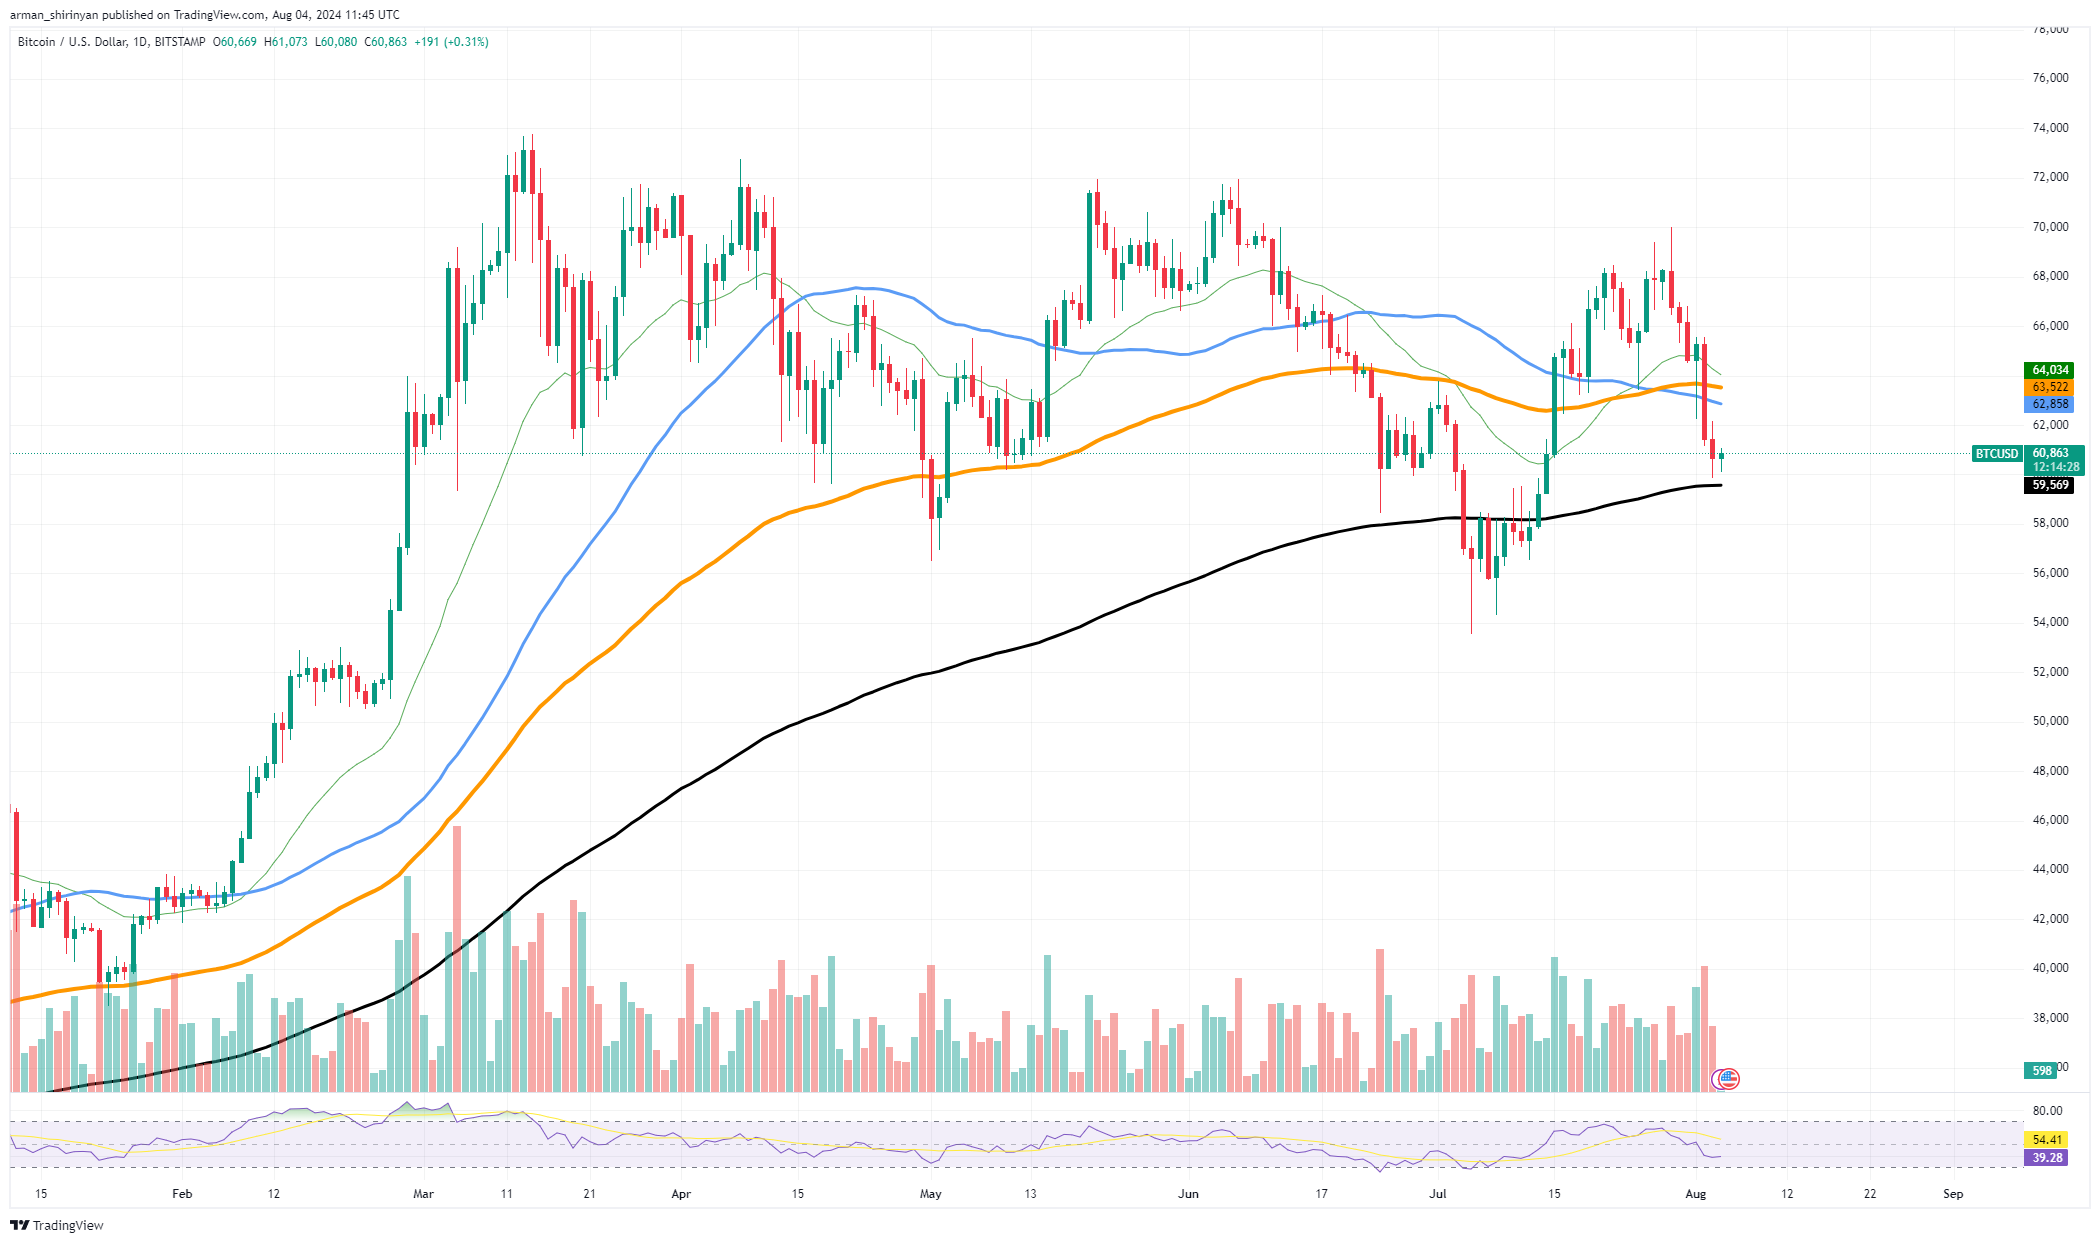
This volume spike indicates increased selling pressure, which could be a sign that investors are liquidating their holdings due to concerns that the bull market is ending. For Bitcoin, the $60,000 mark has been a pillar of support, and its breach indicates possible additional drops.
Such breaches have historically exacerbated the downward trend by causing panic selling. The next important support level is at $58,000, but if it is broken, there may be a more severe decline in Bitcoin, possibly testing the $55,000 mark.
The general outlook for the market is gloomy, with many investors doubting whether the bull run can continue. The selling pressure is increased by the apparent reduction in holdings by institutional investors, who have been a major factor in Bitcoin’s rally.
XRP finds support
With XRP touching the 200-day exponential moving average (EMA) support level, a critical turning point has been reached. This level frequently acts as a strong support and might cause the asset to reverse upward. A reversal of this kind might not however result in significant gains, given the current state of the market and historical trends given the low purchasing power.
As can be seen from the daily XRP/USDT chart, XRP is presently resting on the 200-day EMA (black line). This support level is significant because it frequently denotes a turning point in price corrections that may lead to a possible rebound. As seen by the unsuccessful breakout from the descending triangle pattern, XRP’s recent performance however points to strong resistance near the $0.65 mark.
Related

Since then, the price has dropped again, emphasizing the market’s general bearish mood. Volume analysis indicates a decrease in trading activity, which suggests a decrease in investor interest. Although XRP appears to be lacking momentum, the relative strength index (RSI) is circling 45, indicating that it is neither overbought or oversold.
A possible upward reversal could find support at the 200-day EMA notwithstanding the bearish signals. XRP may see a brief uptick if buying pressure picks up at this point. An encouraging sign to keep an eye out for could be a golden cross in which the 200-day EMA crosses above the 50-day EMA.
Usually interpreted as a bullish signal, this event may draw in additional buyers and result in a longer-lasting upward trend. Market sentiment is still cautious right now. Lower trading volume and liquidity across the board in the cryptocurrency space have hurt XRP’s chances of making a significant comeback. Due to likely broader economic uncertainties, institutional interest appears muted and retail investors are hesitant.
Solana goes all-in
Solana has experienced a substantial decline, wiping out almost all of the gains it had made in the previous few months. With SOL returning to the crucial support levels it last visited several months ago, the recent price action has been brutal. This sharp decline is seen in the daily SOL/USDT chart.
Solana had risen sharply, reaching its zenith in the first part of July. Nevertheless, the asset has been declining ever since. The price dropped significantly, wiping out the majority of its prior gains from a high of about $175 to its current level of about $144.
Related

This bearish sentiment is reflected in key technical indicators. An indication of a momentum loss is the breach of the 50-day EMA. SOL is currently testing the 200-day EMA, a crucial support level. A violation of the aforementioned support could result in even bigger drops. With the RSI circling 36, SOL is getting close to the oversold area. Although this could point to the possibility of a quick recovery, the general outlook for the market is still negative.
Solana’s decline has been aggravated by major challenges facing the cryptocurrency market as a whole. Growing selling pressure is a result of institutional investors appearing to be retreating. The price decline is consistent with a spike in selling activity as indicated by the volume analysis. The next support level could be much lower if the 200-day EMA is broken, which could result in further losses.


