

Bitcoin (BTC) holders faced a rough period last Monday as the price crashed from $61,000 to $54,000 within a few hours. This decline, tagged as one of the worst days for BTC this year, caused massive losses and liquidations.
While the coin has reclaimed the previously lost peak, data shows that the BTC price may still be in danger of another decrease.
Bitcoin HODLer Behavior Lacks Confidence
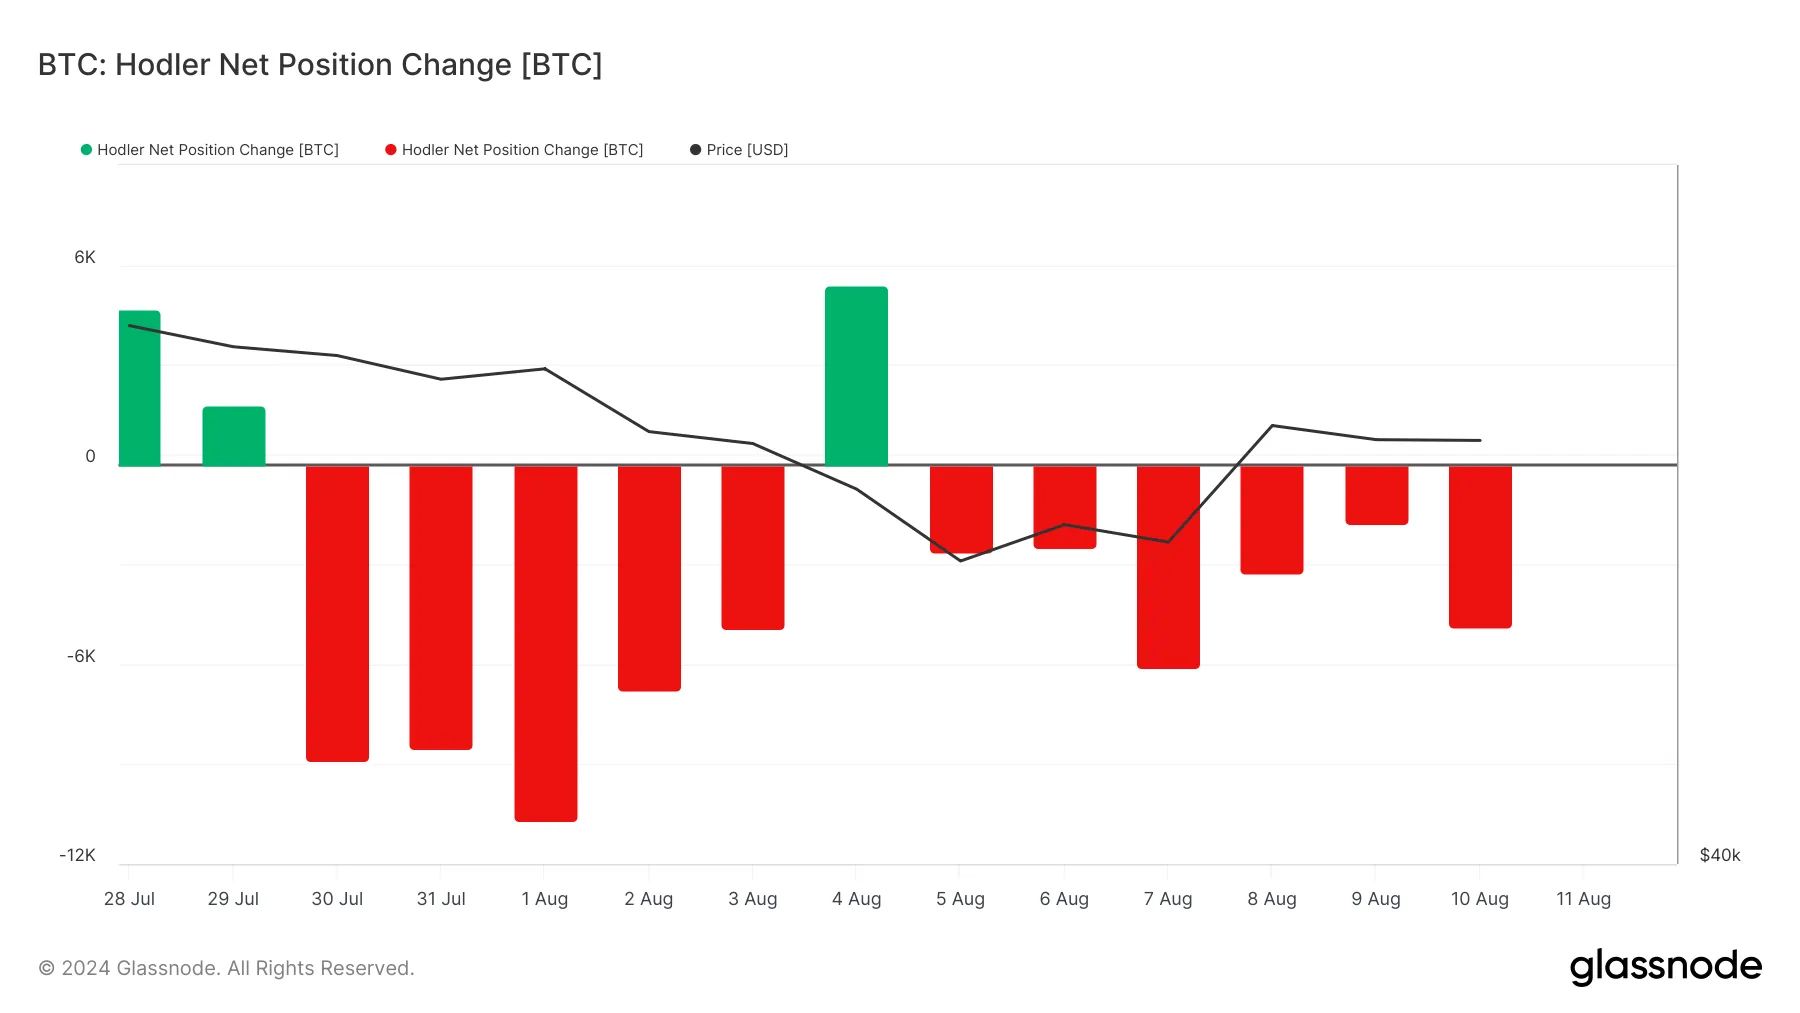
A crucial metric fueling this bias is Bitcoin’s Holder Net Position Change. The Holder Net Position Change tracks if long-term holders are accumulating more coins or decreasing their exposure to a cryptocurrency.
When this number rises, it means that holders are buying more BTC, suggesting that the price may increase. However, a decrease implies that these long-term holders are cashing out and putting downward pressure on the price.
According to Glassnode, long-term holders have sold some of their coins since August 5. Despite the spot-driven rally BTC had, this group still let go of 4,881 BTC on Saturday, August 10.
Read more: Who Owns the Most Bitcoin in 2024?
Another factor that suggests a price decrease in the spot ETFs netflow. Last Wednesday and Thursday’s trading sessions saw the 12 Bitcoin ETFs collectively register inflows.
But on Friday, according to SoSoValue, the financial products recorded a netflow of -$89.73 million, indicating that there were more outflows than inflows. A surge in inflows into the ETFs was vital to Bitcoin’s run to its all-time high of $73,750 in March.
The series of outflows in the second quarter of the year also revealed that institutional capital has been instrumental in raising BTC’s price.
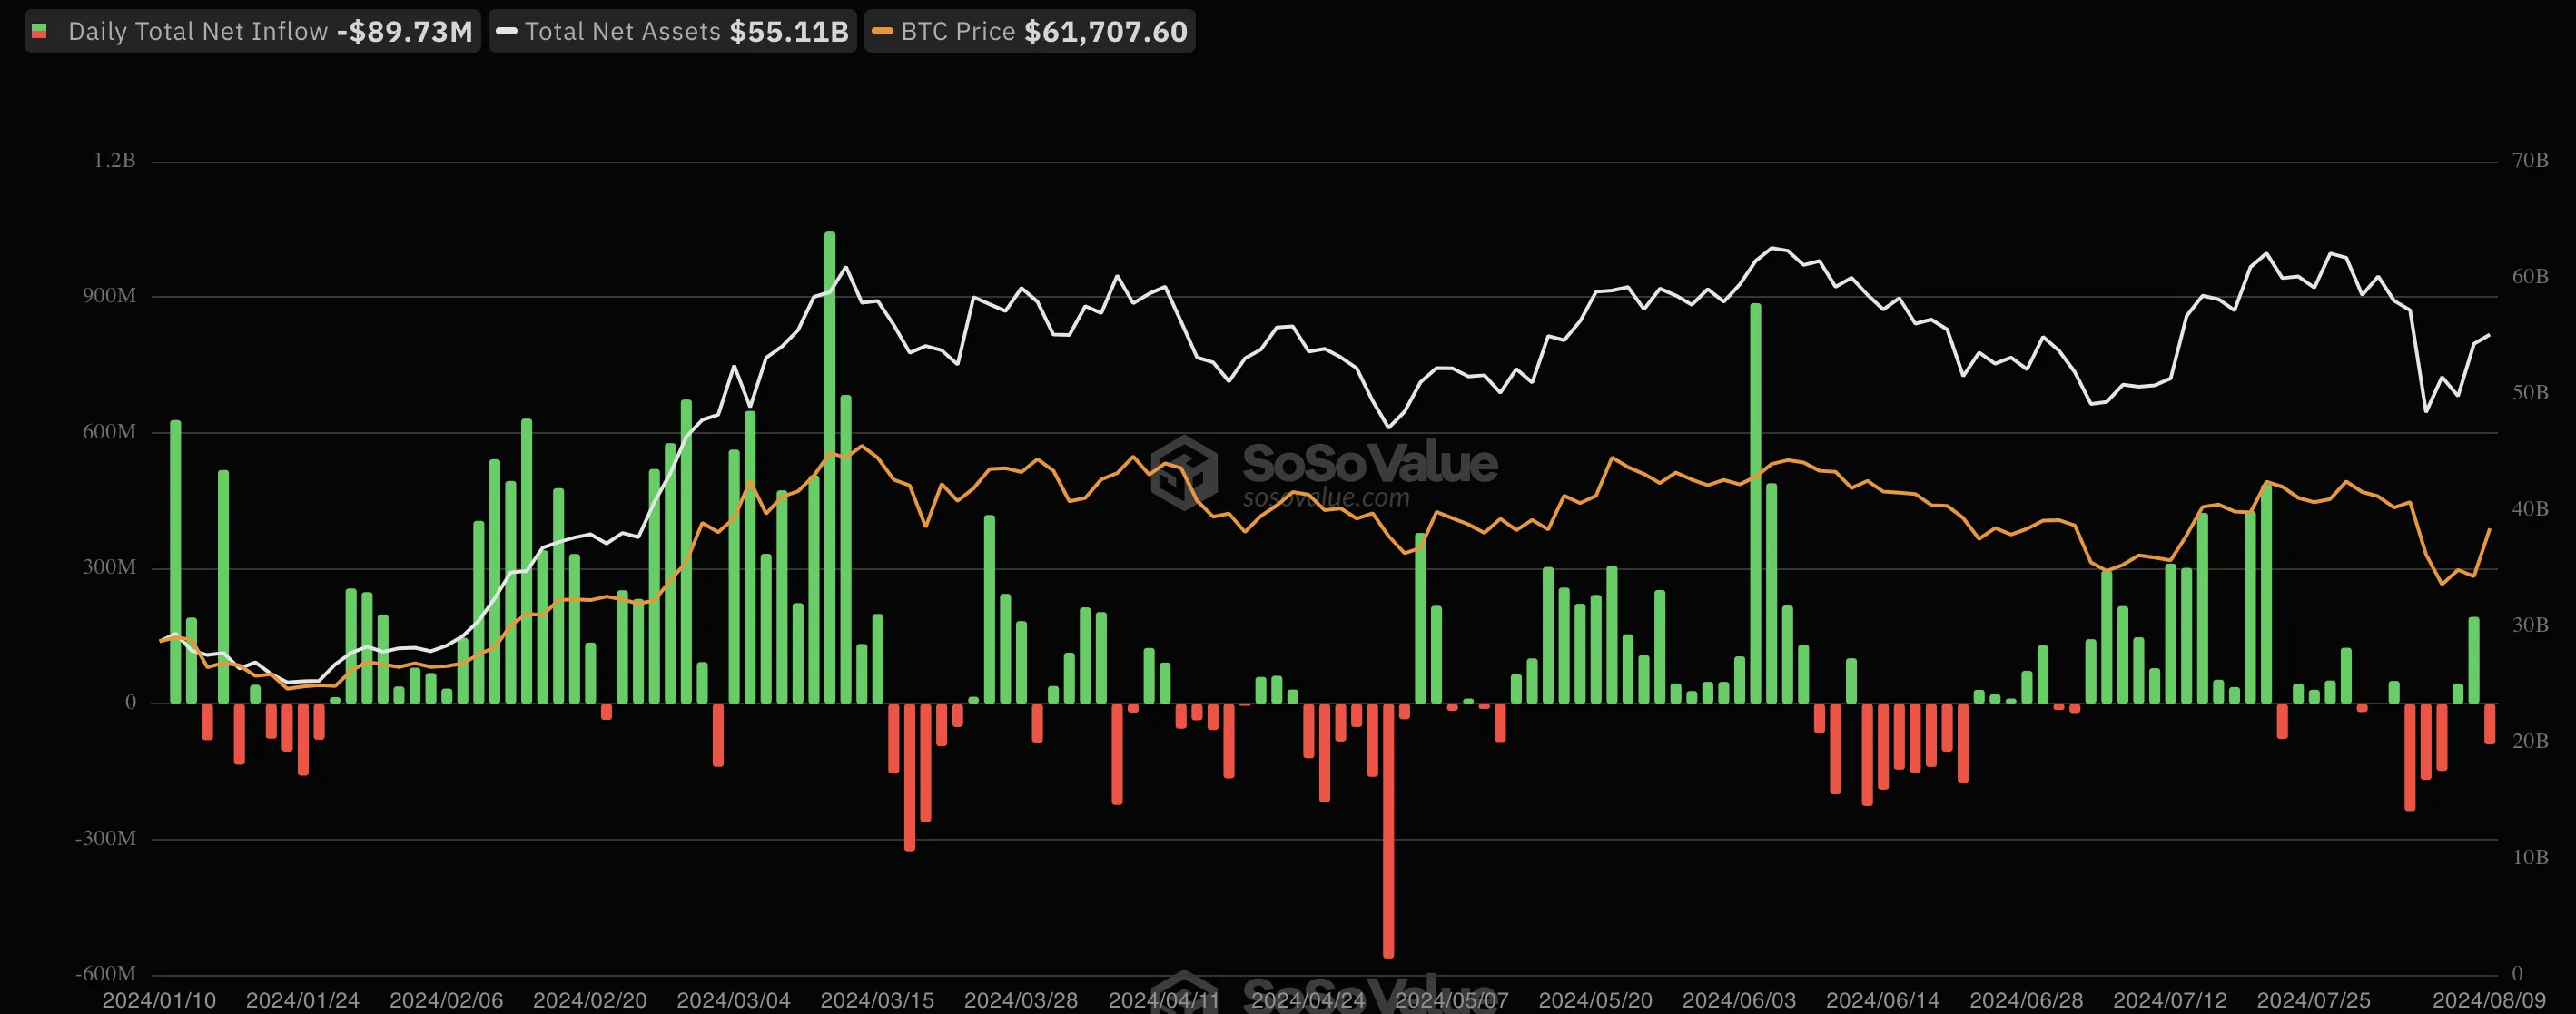
During that period, millions of dollars exited the ETFs, leading BTC to record a notable price drop. Therefore, if the inflows remain negative as a new week begins, then BTC may struggle to hold on to the $60,000 region.
Meanwhile, analyst Michaël van de Poppe shared his opinion on Bitcoin’s price action.
“It’s still early in the month, but if the monthly candle of BTC closes around $60K, it seems like it’s consolidation before the big bull breakout,” he noted.
BTC Price Prediction: $61,000 Is a Fragile Level
BTC currently trades at $61,122. However, the daily chart shows that the cryptocurrency is approaching a supply zone between $61,616 and $62,477. If Bitcoin eventually reaches this region, it could face rejection, possibly propelling a decrease below $60,000.
Additionally, the Awesome Oscillator (AO) remains negative despite the slight bullish cues. The AO compares short and long-term price movements to determine momentum. A positive reading of this indicator suggests that momentum is bullish and price may increase.
Therefore, the negative reading at press time signifies that momentum remains bearish, and a decrease could be close. While BTC may not face a double-digit correction, the price may decline to $60,499 in the short term.
Read more: Bitcoin (BTC) Price Prediction 2024/2025/2030
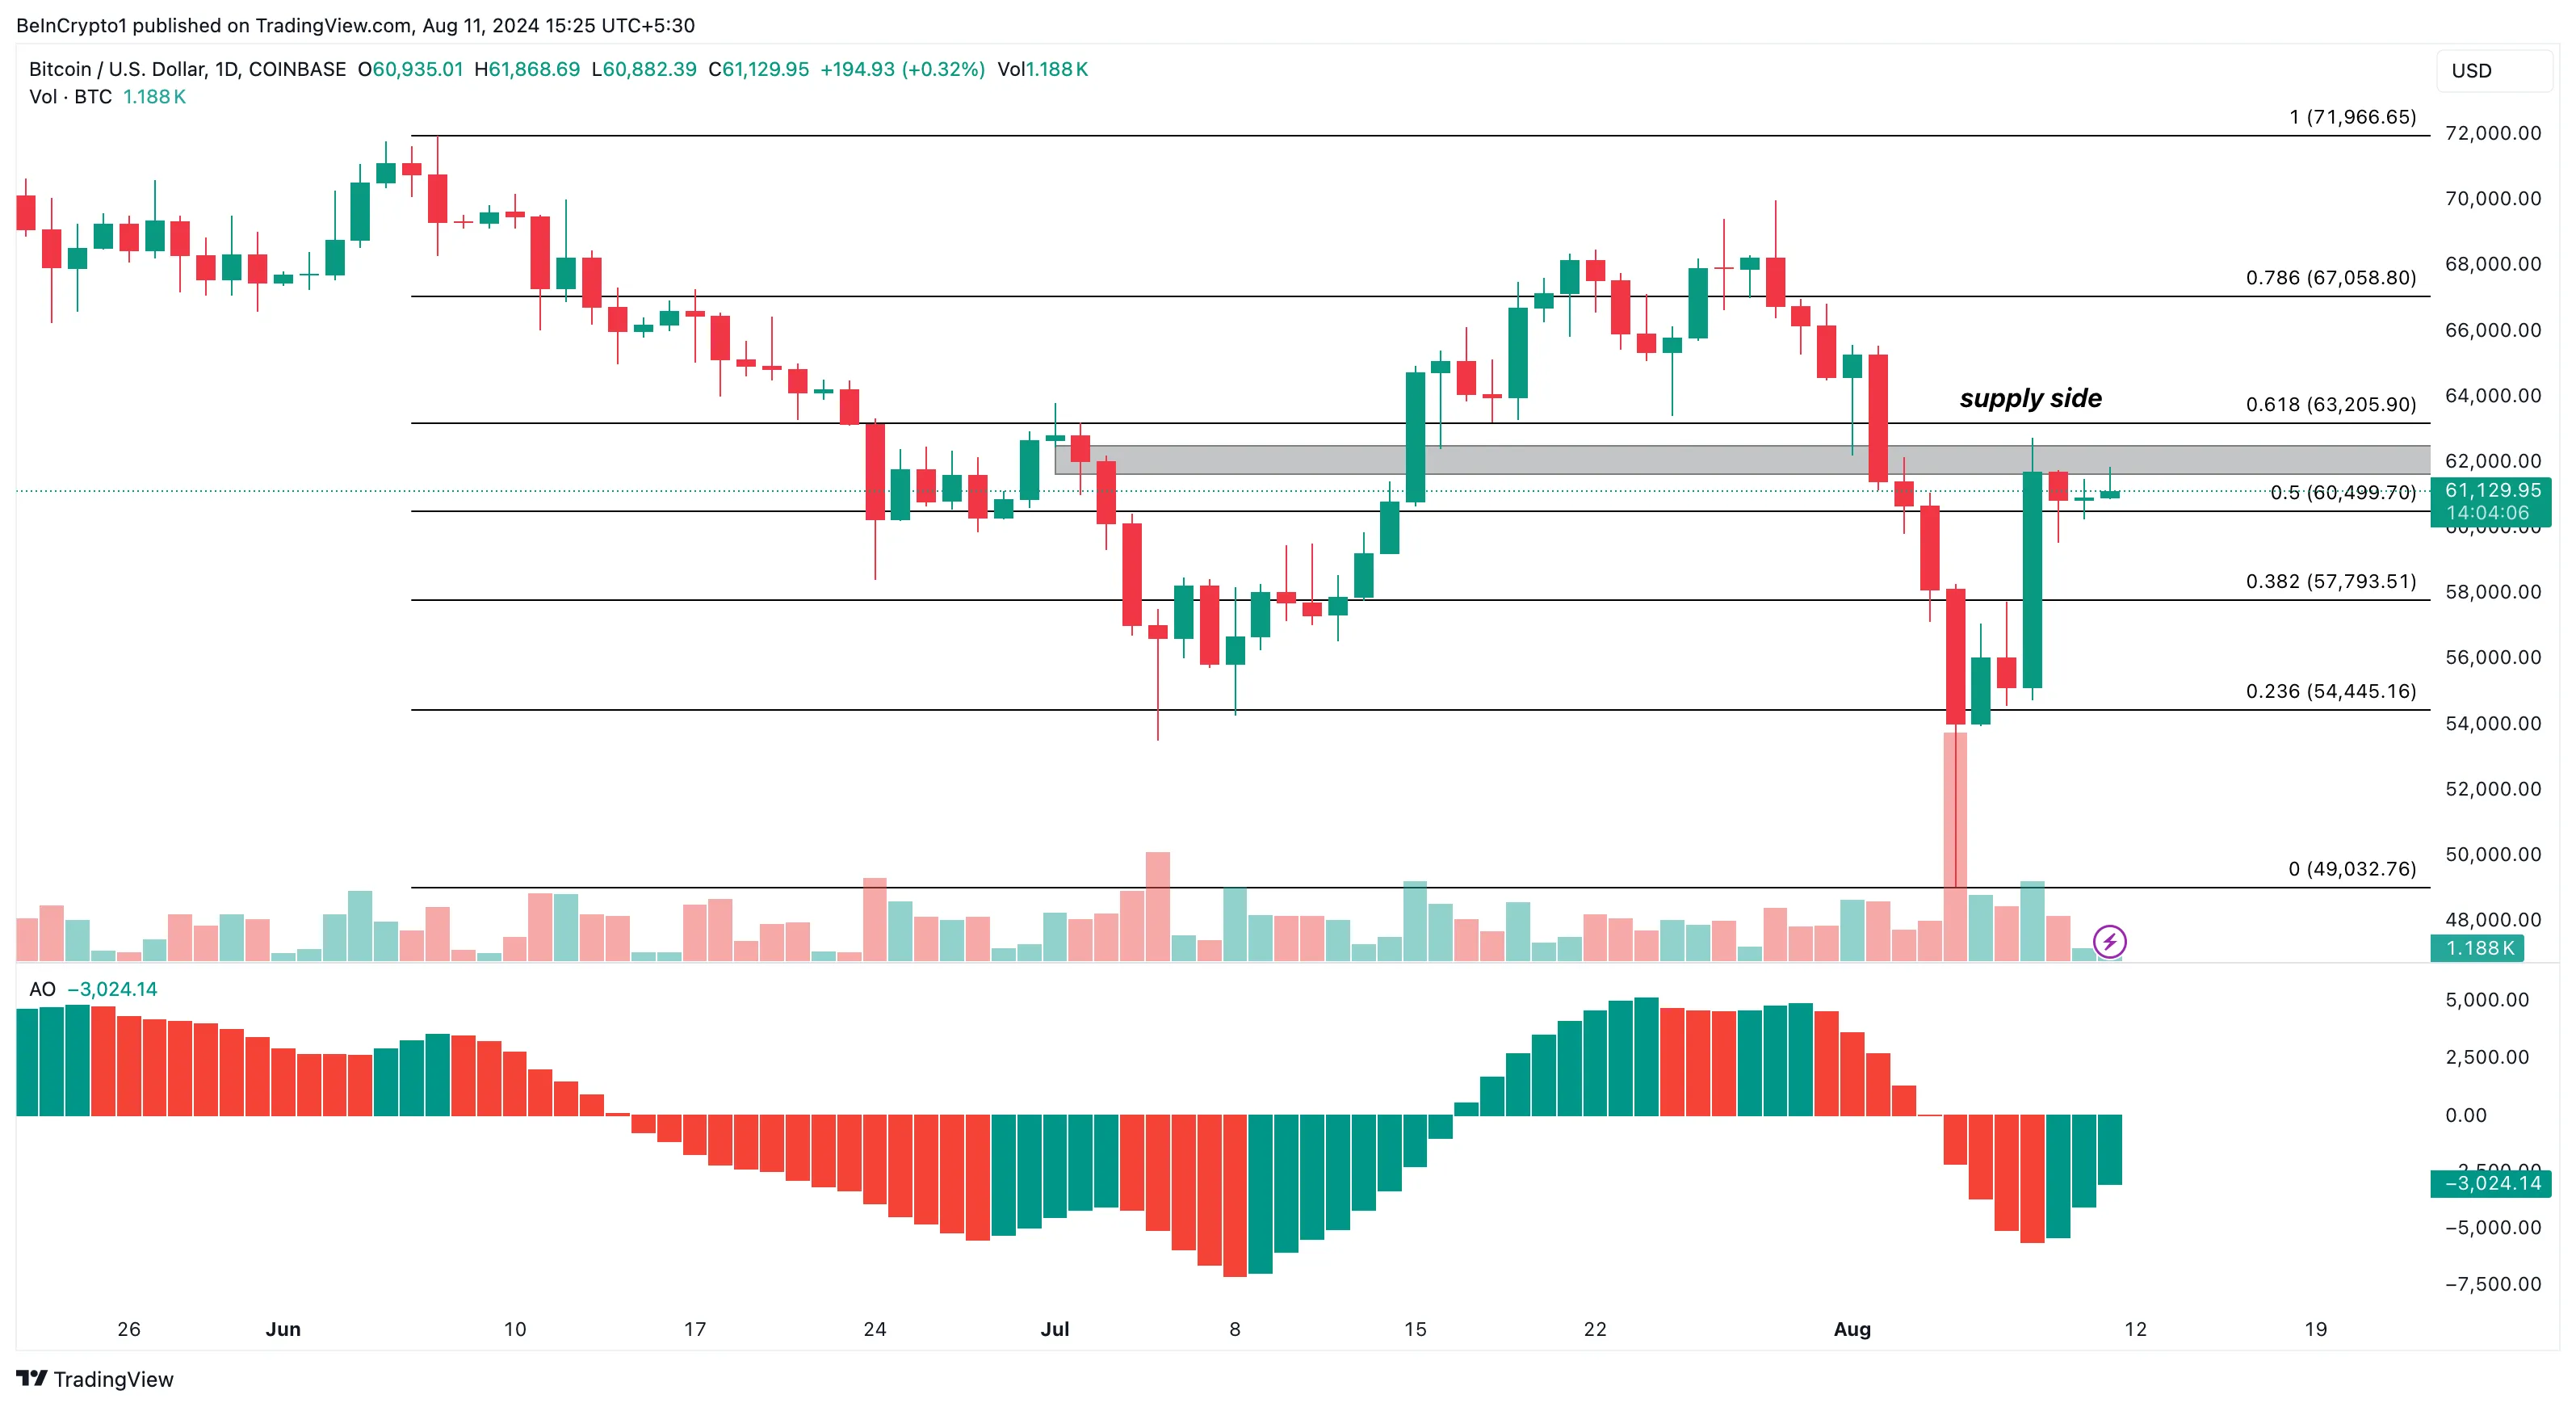
However, an increase in the ETF inflows accompanied by a surge in long-term holder accumulation may invalidate the thesis. If this happens, Bitcoin price may bounce toward $63,205 or $67,058.
Disclaimer
In line with the Trust Project guidelines, this price analysis article is for informational purposes only and should not be considered financial or investment advice. BeInCrypto is committed to accurate, unbiased reporting, but market conditions are subject to change without notice. Always conduct your own research and consult with a professional before making any financial decisions. Please note that our Terms and Conditions, Privacy Policy, and Disclaimers have been updated.

