

Bitcoin (BTC) Testing Technical Resistance, Gold (XAU) Nudging Higher
Recommended by Nick Cawley
Building Confidence in Trading
For all high importance data releases and events, see the DailyFX Economic Calendar
Bitcoin has recovered all this week’s losses and is back at levels seen just before last Friday’s NFP release sent risk markets tumbling on US recession fears. Over this week these worries have been dialed back and risk markets, including Bitcoin, have made a strong recovery. Printing a fresh lower low leaves the chart with a negative bias, while the 50- and 200-day simple moving averages are being tested but have held firm so far. These two moving averages must be broken convincingly before BTC can make the next move higher. If BTC/USD can break above$70k, a cluster of prior highs will prove difficult to overcome in the short term with $72k a notable double top. To the downside, $56.5k should hold if tested.
Bitcoin Price Daily Chart
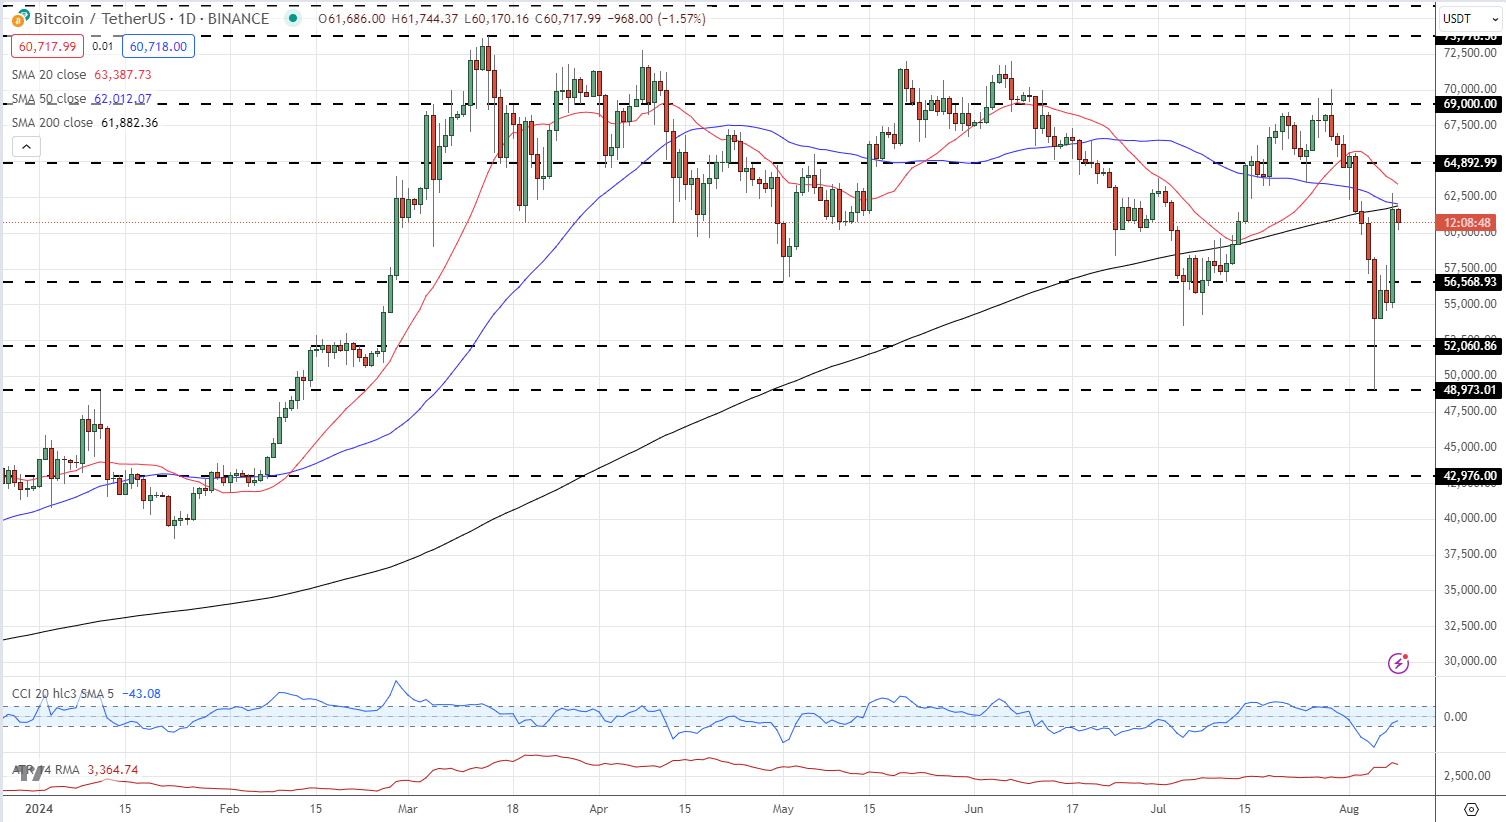
Chart via TradingView
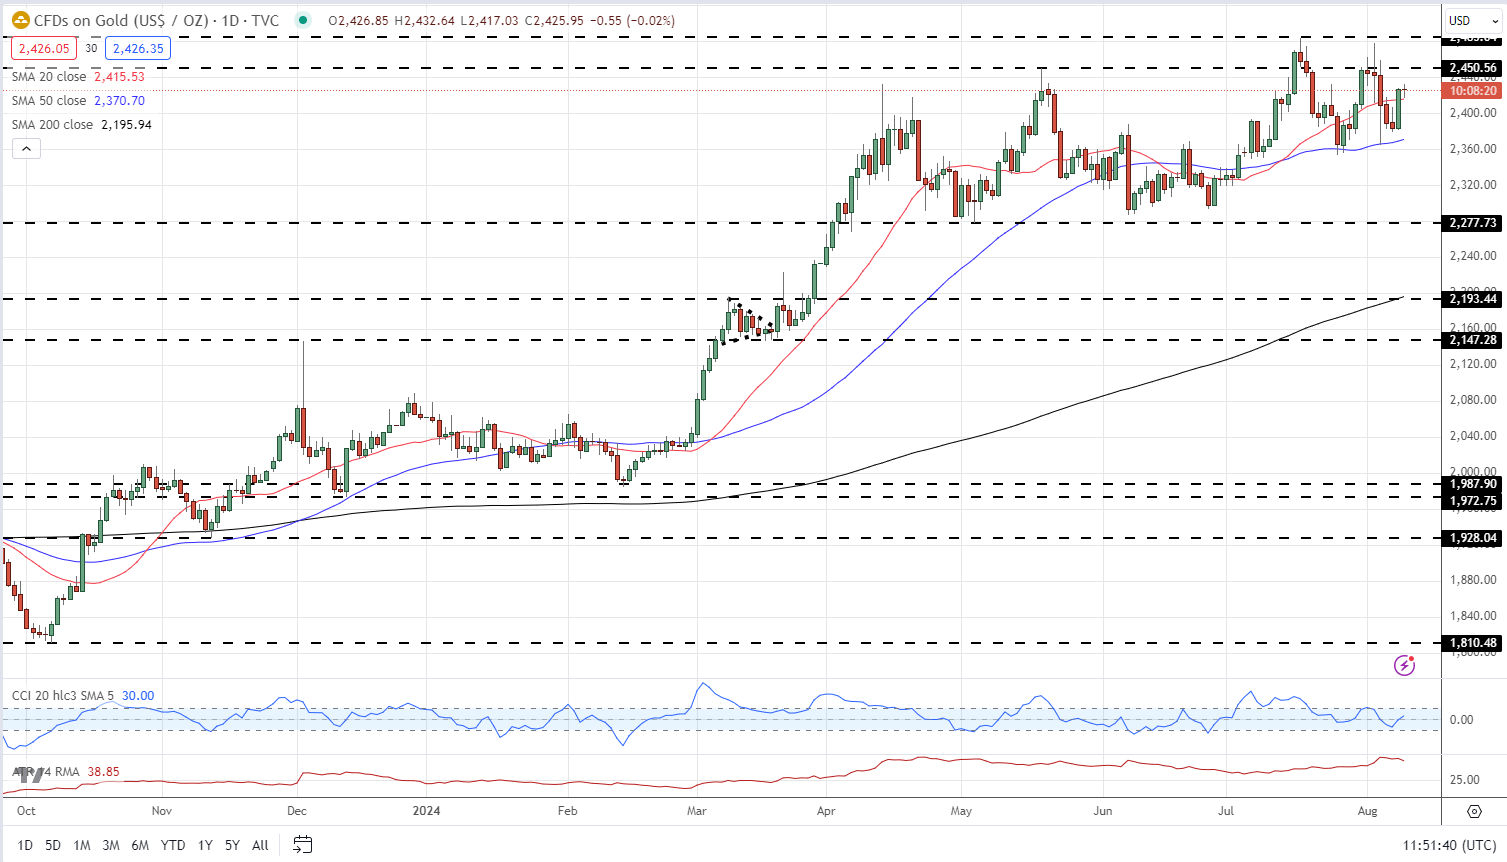
The longer-term gold chart remains positive with a series of slightly higher lows and higher highs in place. The precious metal has been drifting sideways to marginally higher since early April with two breaks of resistance ($2,450/oz.) quickly reversed. Gold seems to be setting up for another attempt at this level and if successful the all-time high at $2,485/oz. will be quickly tested.
Gold Price Daily Chart
Recommended by Nick Cawley
How to Trade Gold
Chart via TradingView
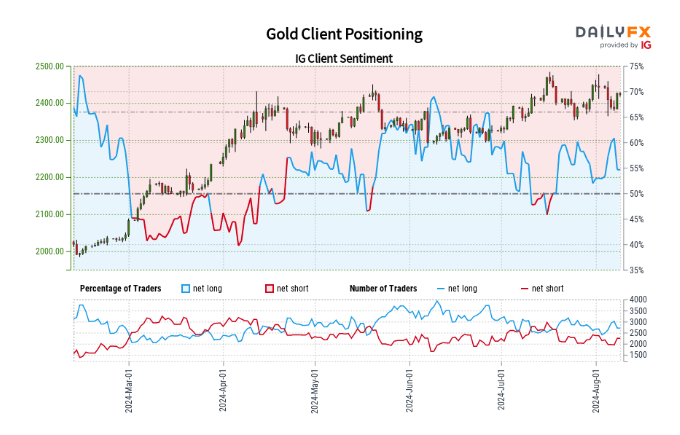
Retail trader data shows 53.72% of traders are net-long with the ratio of traders long to short at 1.16 to 1.The number of traders net-long is 12.76% lower than yesterday and 1.54% higher from last week, while the number of traders net-short is 19.83% higher than yesterday and 1.97% lower from last week.
We typically take a contrarian view to crowd sentiment, and the fact traders are net-long suggests Gold prices may continue to fall. Positioning is less net-long than yesterday but more net-long from last week. The combination of current sentiment and recent changes gives us a further mixed Gold trading bias.
| Change in | Longs | Shorts | OI |
| Daily | -4% | 9% | 1% |
| Weekly | 8% | -10% | -1% |
What is your view on Gold and Bitcoin – bullish or bearish?? You can let us know via the form at the end of this piece or you can contact the author via Twitter @nickcawley1.

 Price Volatility")
