

Bitcoin, Ethereum Price Analysis
- A week after the Fed and both Bitcoin and Ethereum remain relatively subdued.
- Bitcoin is testing a key spot of trend support, while Ethereum tests the support side of a recent range.
- The analysis contained in article relies on price action and chart formations. To learn more about price action or chart patterns, check out our DailyFX Education section.
Last week brought the fireworks on the Central Bank front and despite the comments from Chair Powell and the Fed about near-term rate policy, risk markets appear to be treading cautiously as Quarter-end nears.
To be sure, the Fed has made little signal of removing support. Markets, on the other hand, have started to get wound up about the potential that the Fed may have to begin removing that support sooner rather than later. We’re likely going to see at least some of this reconciled in the next week and a half, as the end of Q1 nears. Risk parity funds allocating away from stocks and into bonds to capture those new higher rates may lead to a bit of a shift; but if we do see flows into bonds, stoking higher prices, the rates problem may begin to start solving itself without the Fed having to push on any levers.
In crypto markets, both Bitcoin and Ethereum remain on their back foots after extremely strong starts to the year. This could perhaps be a bit of window dressing ahead of Quarter-end, with the recent bullish trend in Bitcoin showing the possibility of a deeper pullback while the flatter price action of Ethereum may offer some range setups in the week ahead.

Recommended by James Stanley
Building Confidence in Trading
Bitcoin Threatens Deeper Pullback
Bitcoin had a super-charged start to the month – rising by 43% in the first two weeks of March trade. This entailed another fresh all-time-high as Bitcoin mounted above the 60k figure for the first time ever.
But that 60k marker appeared to be too much for bulls to handle at this point, as prices quickly dropped back before buckling up for resistance on the big figure twice more before pulling back a bit deeper. So, at this stage – the bullish trend is not yet done as there’s a very reasonable level for why buyers have pulled back on the throttle, and this is why psychological levels can often take a few attempts before finally being taken-out.
To learn more about psychological levels, join us in DailyFX Education
That pullback from 60k has pushed prices into a support zone spanning from Fibonacci levels at 57,032-57,354; and a bit deeper another confluent zone exists from 53,998-54,615. Support holds in either zone could re-open the door for bullish continuation prospects; and on the other side of the matter, topside breaks through the 60k level can re-open the door for breakout approaches in Bitcoin.
To learn more about Fibonacci or Trendlines, check out DailyFX Education
BTC/USD Four-Hour Price Chart
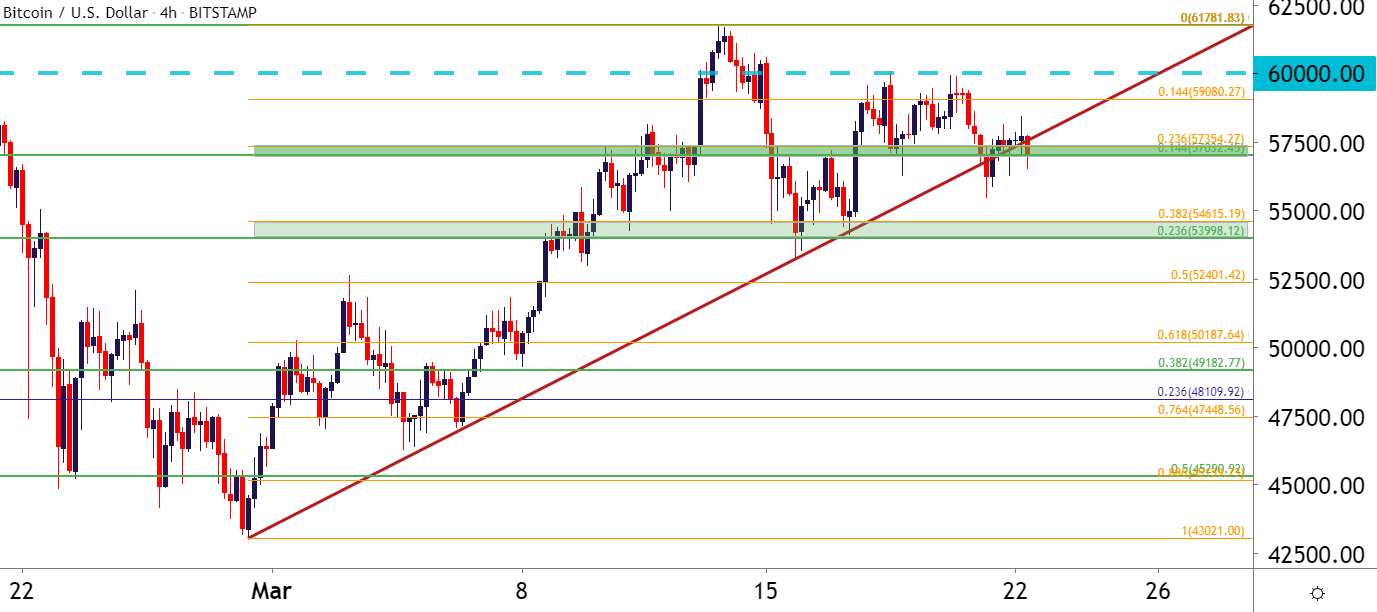
Chart prepared by James Stanley; Bitcoin on Tradingview
Ethereum Digs into the Range
Ethereum has not set a fresh high in the month of March. But there’s still a week and change left, and given the fact that the Fed has shown no signs of slowing down, it would seem that there’s upside potential remaining in ETH/USD.
By comparison to Bitcoin above, ETH/USD has been range-bound with a consistency of support around the 61.8% retracement of the February sell-off. This plots around 1755 and has already produced a number of support inflections.
This can keep the door open for bullish scenarios, looking for prices to move towards recent range resistance around the 76.4% retracement of that same major move. If bulls do kick the trend back up, then there could be deeper target potential around the March high of 1943 before ‘big picture’ resistance plots in around the 2k psychological level.
ETH/USD Four-Hour Price Chart
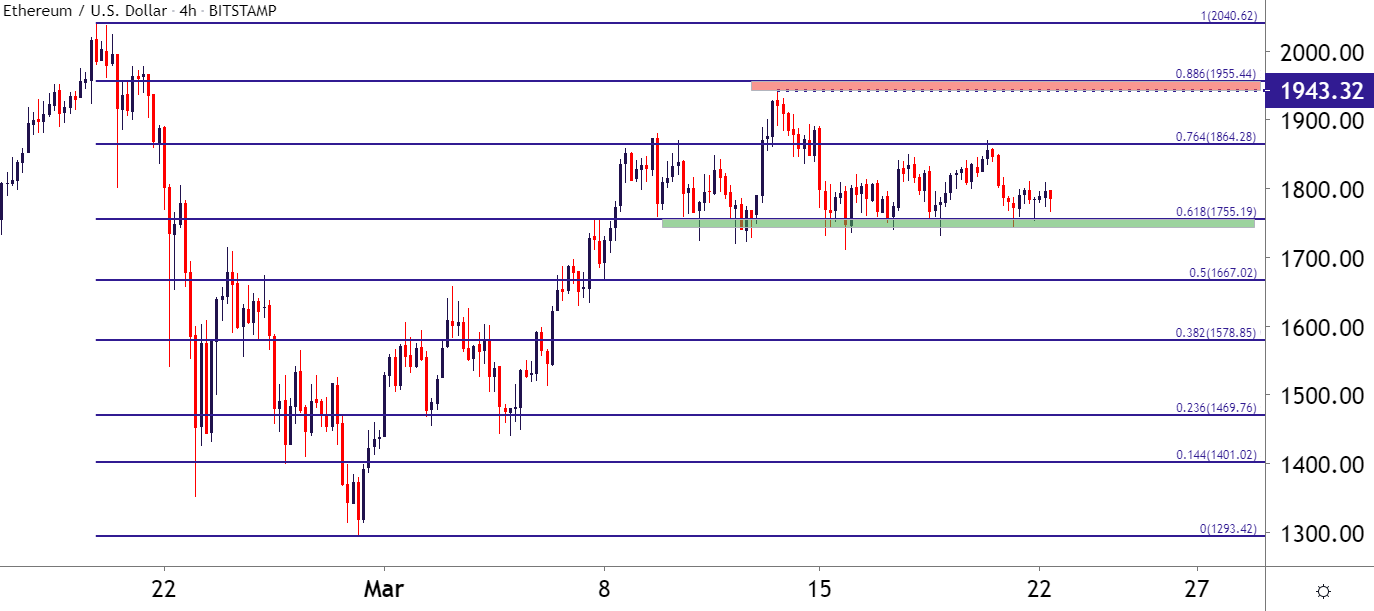
Chart prepared by James Stanley; Ethereum on Tradingview
— Written by James Stanley, Senior Strategist for DailyFX.com
Contact and follow James on Twitter: @JStanleyFX

