

anilakkus/iStock via Getty Images
Thesis Summary
With CPI data coming out on Thursday the 12th, the age-old inflation/deflation has been reignited. At this point, it’s becoming clear to most that inflation is subsiding. But just how much, and for how long?
I certainly believe we could even see some form of deflation in the short term, and this could act as a catalyst for Bitcoin (BTC-USD) and other risk assets. Contrary to popular belief, Bitcoin performs better in deflation.
However, depending on what the Fed does, we could see inflation spike again towards the end of the year, so even if Bitcoin can bottom and rally soon, I still expect a turbulent year ahead.
What I expect in 2023
We leave behind a historically bad year for stocks and bonds, and head into 2023 with cautious optimism. A lot of financial assets are now much more attractively valued due to lower prices, but they might not be so undervalued if we consider recession is very likely.
ISM Manufacturing Index (Trading Economics)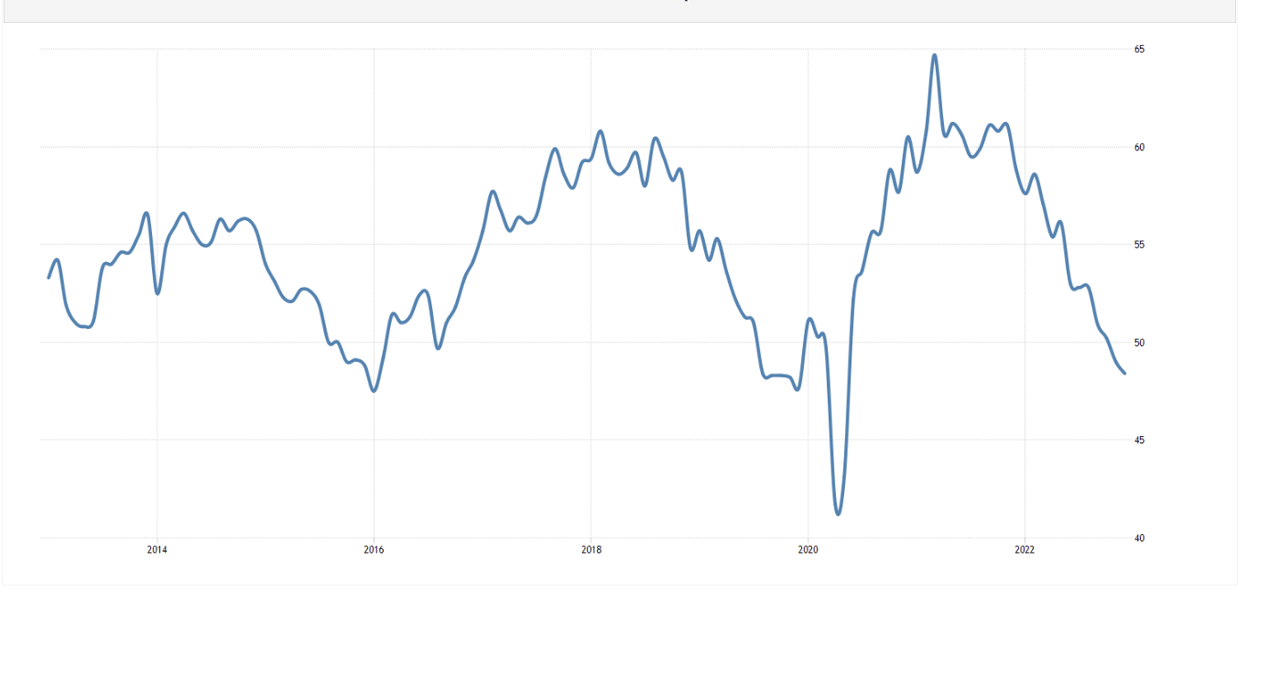
The chart above shows the ISM manufacturing index, and we can see that it has been declining rapidly. In the past, every time this chart falls below 45, a recession has taken place.
The good news is that we might at least see a break in inflation:
CPI Less shelter (St. Louis Fed)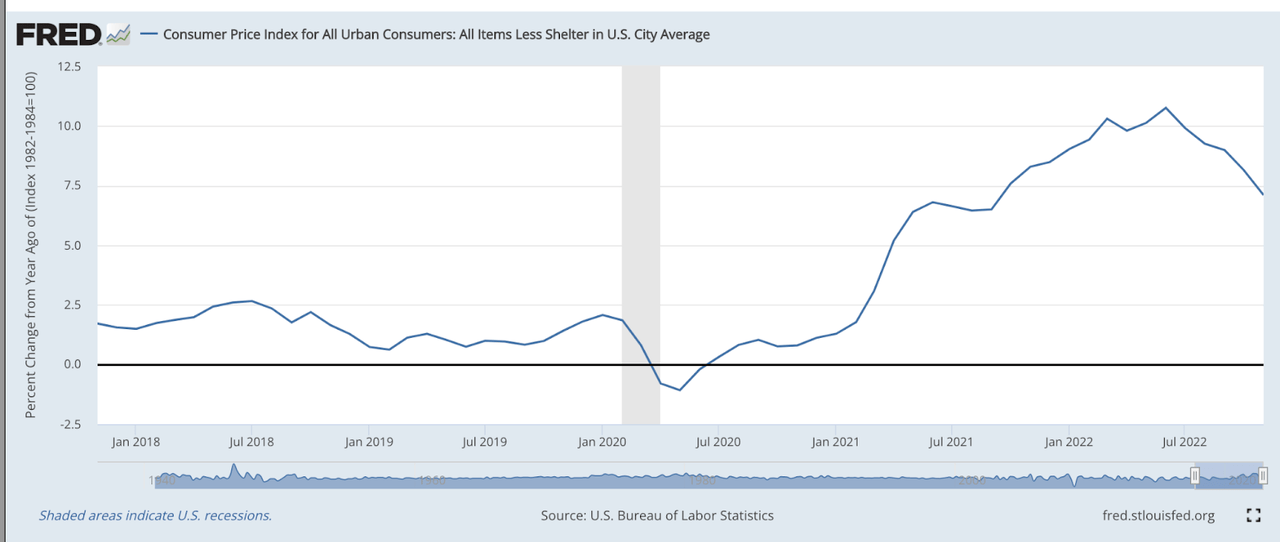
This chart shows CPI minus shelter costs in the U.S. and it is also showing a very clear downward trend since June-July. Inflation will be severely reduced if housing finally starts coming and energy stabilizes.
It’s not over till the Fed sings
Whatever happens, moving forwards will strongly depend on the Federal Reserve. The latest Fed minutes continued to paint a hawkish stance. The Fed isn’t looking to pivot yet, especially with employment holding up strong, but we will see a pivot if we get lower inflation and enter a recession. Lower inflation seems quite likely, though a recession could still take some time to materialize.
Either way, we could see inflation repeating the path it took in the 1970s.
Inflation 1970s (St. Louis Fed)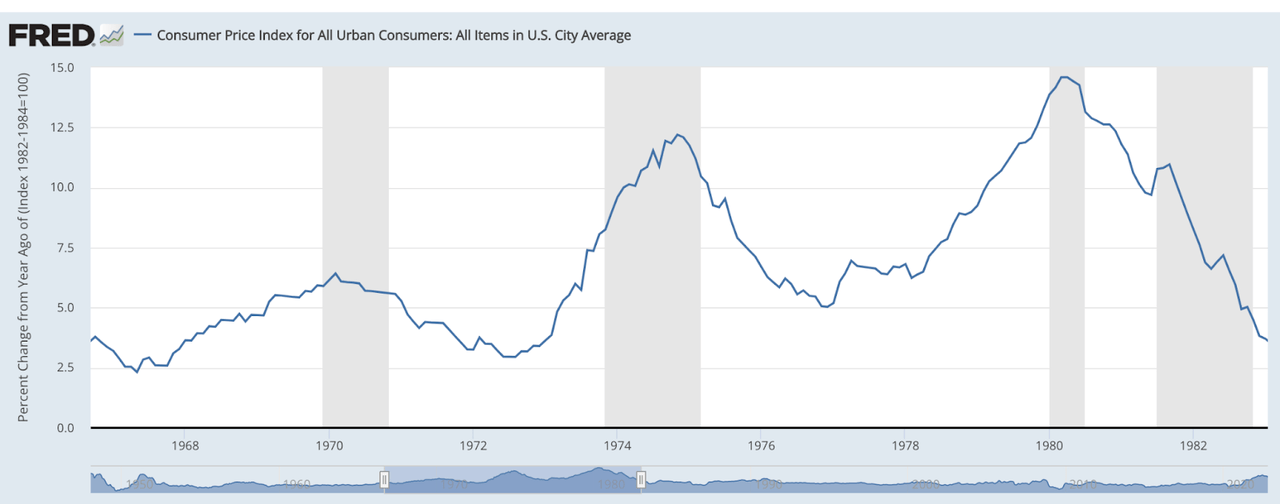
What we can appreciate above is how inflation formed almost a double top. It first hit almost 12.5% in 1975, came down towards 5% through 1977 and then finally peaked at nearly 15% in 1980 before finally coming down convincingly.
There are two interesting takeaways from this chart. First off, inflation peaked as the economy entered a recession. Secondly, the Fed may have been to blame for this double-top inflation since it may have lowered rates too soon.
U.S. Unemployment (St. Louis Fed)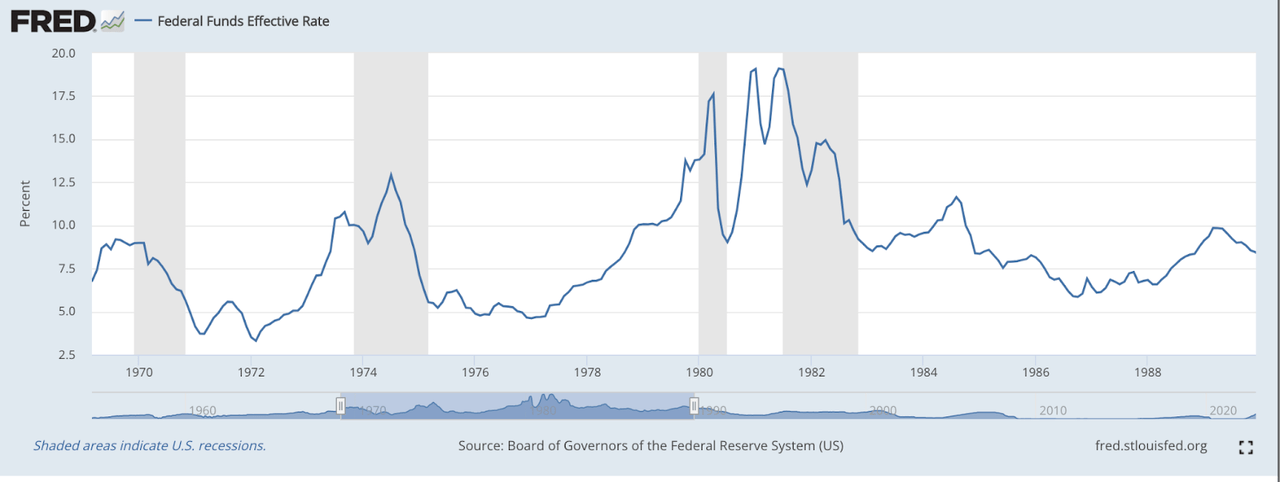
The big difference here is unemployment, which back in the 70s was increasing and near 9% in 1975, versus today’s historically low unemployment.
Bitcoin as a disinflation and recession hedge
The way I see it, the Fed isn’t going to pivot right now, at the risk of reigniting inflation as happened in the 1970s. This means we could continue to see disinflation. However, despite strong employment we have evidence that a recession is likely, which doesn’t bode well for stocks.
Bitcoin is generally touted as an inflation hedge, but in reality, as it stands right now, it trades in line with risk assets, evidenced by its strong correlation with the Nasdaq index.
BTC and NDX chart (TradingView)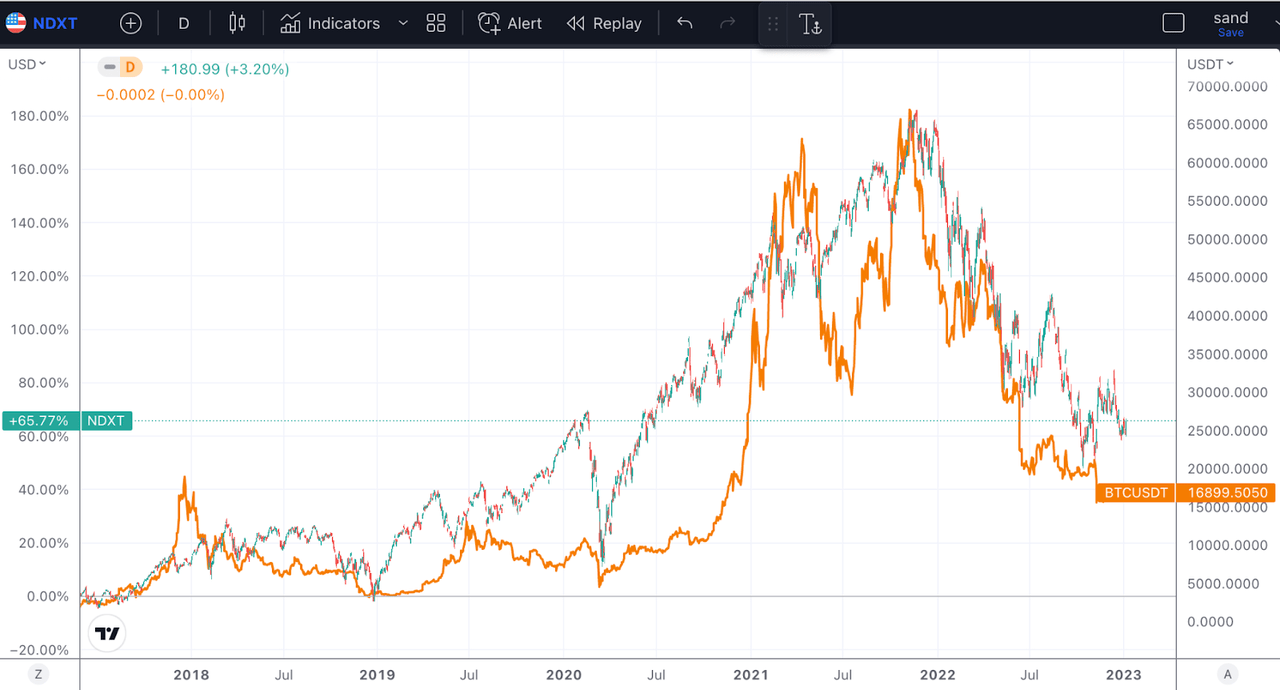
This is why I believe now is a good time to accumulate Bitcoin. While prices could certainly head lower from here, as disinflation takes hold, tightening will stop, and the faucet of liquidity will pour into Bitcoin and other “risk-on” assets.
The issue for stocks, though, is that they may be facing a recession, with lower earnings ahead of them. This means that Bitcoin could potentially outperform individual companies moving forward since it is moved more by liquidity.
What this means for Bitcoin
In short, I see two possible paths Bitcoin could follow in the coming months. Below is a very simplified chart of my analysis.
Bitcoin chart (Author’s work)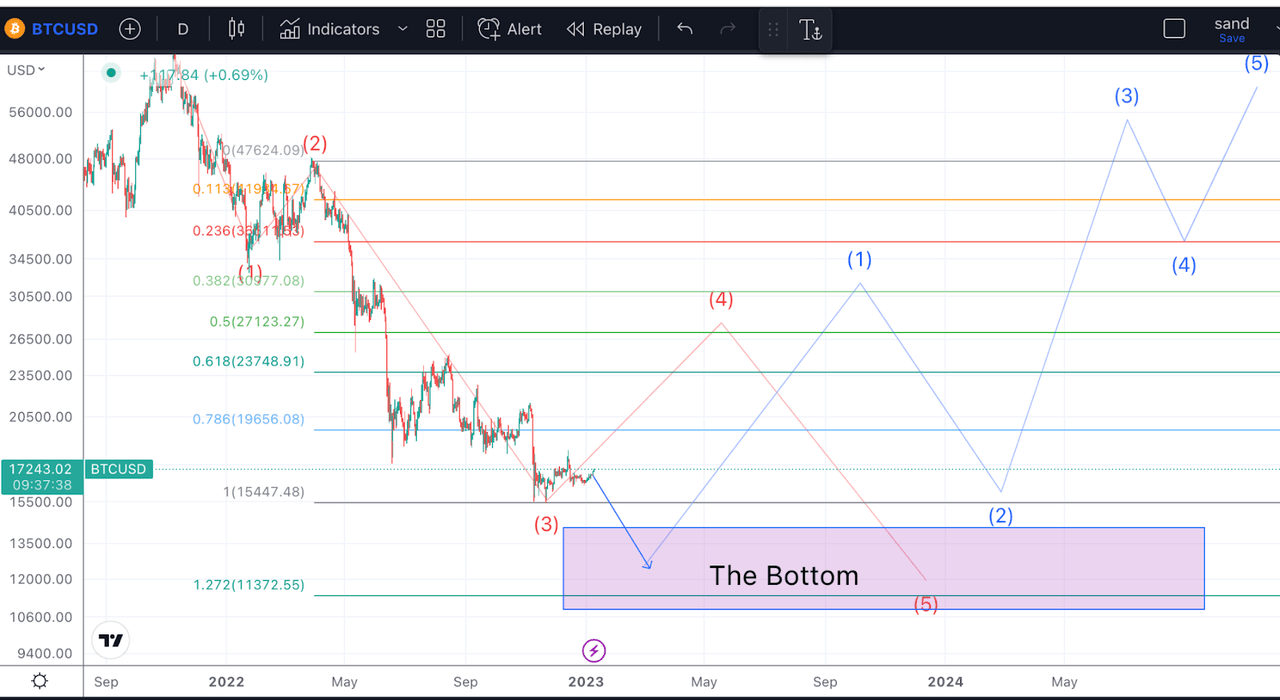
If we get strong enough deflationary signals and the economy stays strong, in the coming days, weeks and months, Bitcoin could conceivably rally back towards the $30,000 area. This is my ideal target since it represents the 61.8% retracement of this last wave 3 down. However, with the Fed remaining more hawkish than people expect, I’d expect the market to head lower eventually, and this could happen as tight monetary policy finally pulls us into recession. This would lead to a quick sell-off into my target bottoming area of $12,000-$14,000, followed by a fast V-shaped recovery once the Fed starts pumping liquidity back into the market.
Alternatively, and preferably, Bitcoin could bottom much sooner if inflation remains elevated or if we enter a recession and a credit panic sooner rather than later. In this case, we could see Bitcoin grind towards our target area in the coming months before we see a convincing reversal.
In either case, though, I’d expect Bitcoin to provide us a 1-2 setup, meaning lows will be revisited at some point. This also makes sense when we consider how Bitcoin consolidates before it begins a new bull cycle.
Takeaway
While I still see many options on the table, there are two takeaways that seem clear to me. Firstly, Bitcoin should be near the bottom right now, at least in terms of price. My target is around the $14,000 region, which I’ve discussed in previous articles.
My other conclusion is that Bitcoin will outperform other assets and act very well as a disinflation and even reflation hedge. While stocks may suffer from a weaker economy, I believe Bitcoin will ultimately come out stronger when liquidity flows back into the market.


