

Following a bearish end to the Bitcoin ETFs market last week, the Bitcoin (BTC) price failed to hold onto the $60K mark. Crashing 3.65% on Sunday, the rising volatility and the constant threat of the U.S. market facing a recession leads to increased supply.
As the BTC price fails to surpass the 50D EMA, which acts as a dynamic resistance, let’s take a closer look at the possibility of downfall. Will Bitcoin reclaim $60K this week, or is a downfall to $50K inevitable?
Bitcoin Price Performance
Following the massive surge from the support trendline, the BTC price managed to reclaim the 200D EMA and the $60K mark. The recovery rally in the week of Black Monday resulted in a V-shaped reversal for Bitcoin and improved the overall market sentiment.
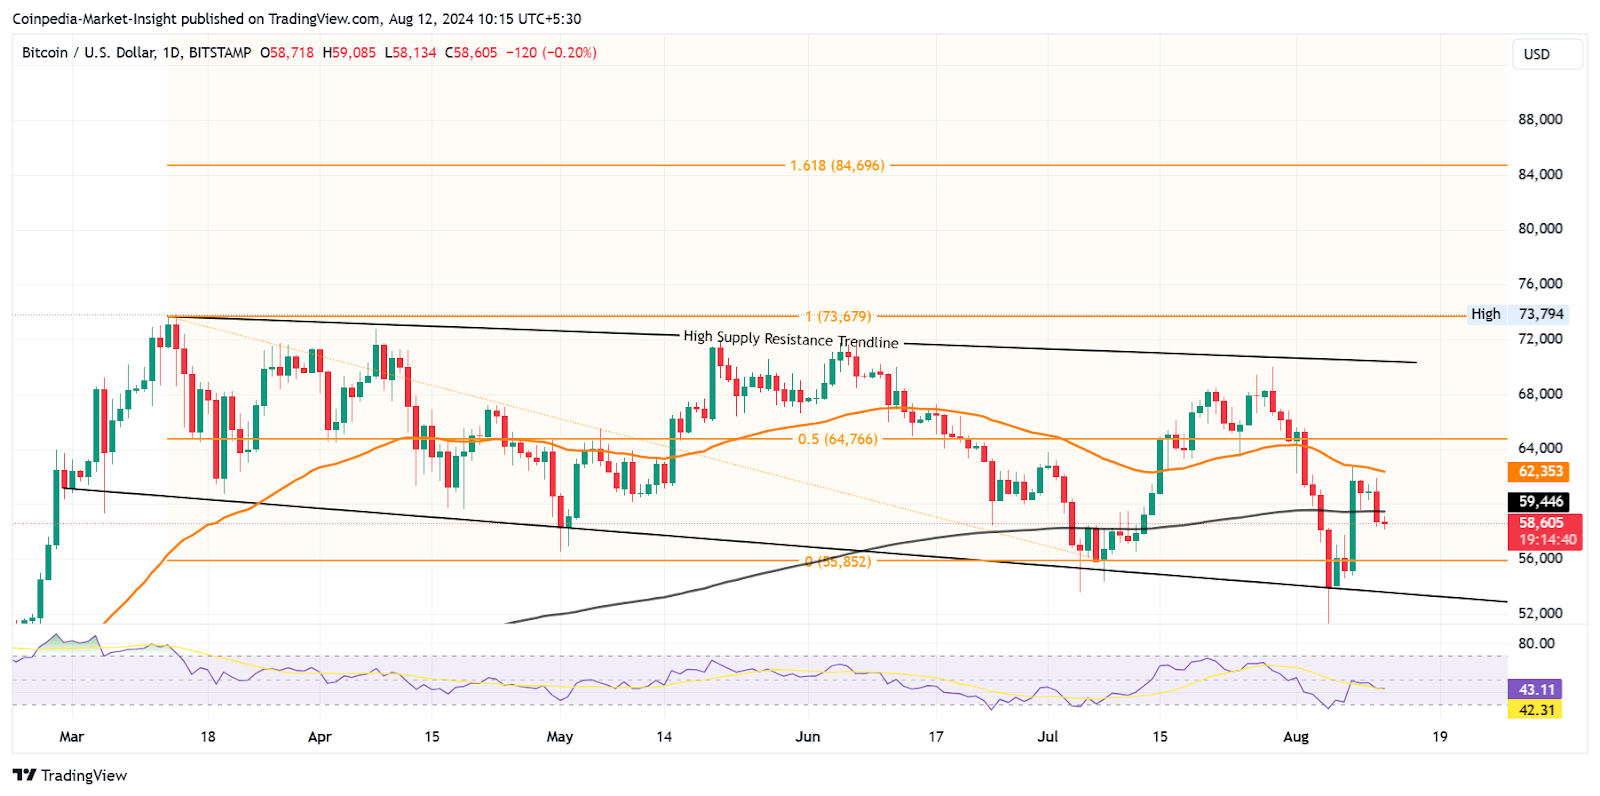
However, the bullish momentum failed to sustain immediately after the 12% jump on Thursday. With a pullback from the 50D EMA, the downfall witnessed a surge in supply pressure on Sunday, accounting for a 2,227-point drop.
Breaking below the $60K mark, BTC price trades at $58,515, with an intraday Doji visible during the Asian market hours.
Weak Bullish Hands Get Shaken Out
In the last 24 hours, the surge in supply pressure in the market resulted in a spark in liquidation numbers. With total liquidations standing at $156.48M, the bullish hands are taking a big hit. As the long-positions REKD accounts for $123.74M, the short positions are conservative with $32.74M.
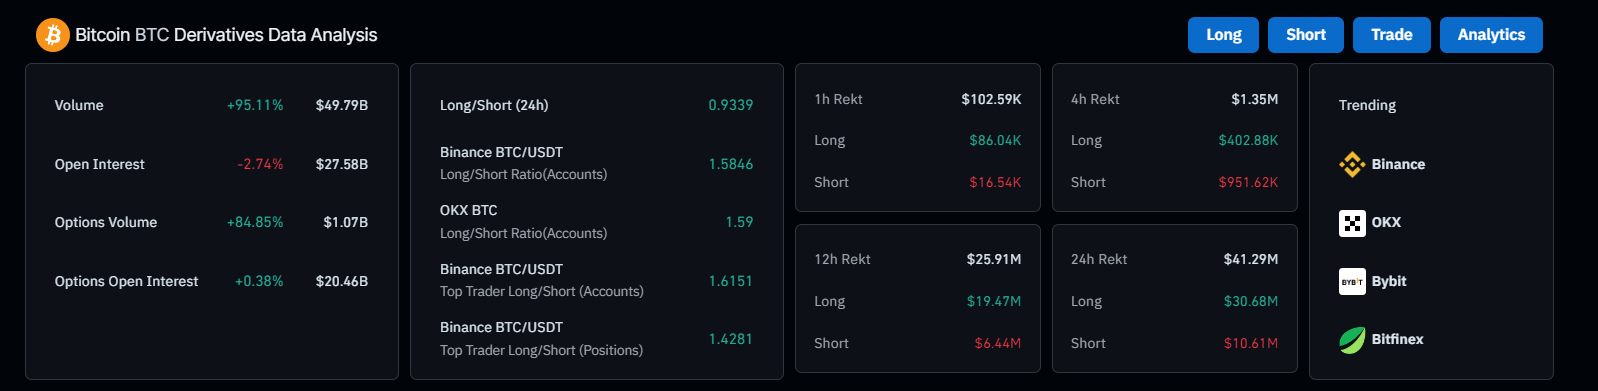
Over the last 24 hours, the Bitcoin liquidations ratio is almost 1:3. This is because $10.61M shorts are liquidated in exchange for $30.68 on the long side. Hence, a weak bullish side is evidently clear in the current market conditions.
However, the derivatives market wears a tiny optimistic lens in the current situation. With a 95% surge in trading volume at $49.79B, the Open Interest is down to $27.58B by 2.74%.
Top Binance traders anticipate a bullish trend continuation in BTC price. This is revealed from the long/short ratio of 1.6151 based on accounts and 1.4281 based on positions.
Technical indicators:
RSI: The daily RSI line bouncing back from the oversold boundary struggles to surpass the halfway line, resulting in another pullback.
EMA: The BTC price pullback from the 50D EMA breaks under the 200D EMA. Thus, the dynamic average lines warn of a looming death cross possibility.
Will BTC Price Hit $50K?
As the crypto market conditions remain volatile, with the U.S. presidential elections and the threat of recession, the BTC price will be shaken to the limit. However, the bottom formation at $50K promises solid support with a trendline confluence.
The ongoing correction could lead to a price fall to $50K. However, the cyclical pattern is expected to continue. With a potential rate cut coming before the US elections, the BTC price could surpass the $73K mark. Thus, the chances of a new all-time high for Bitcoin before 2024 ends are increased.


