- Bitcoin broke below $25,300 after Fed’s decision
- Meanwhile, Ethereum tested $1,750 resistance
- Can both cryptos break out of the bearish trend this week?
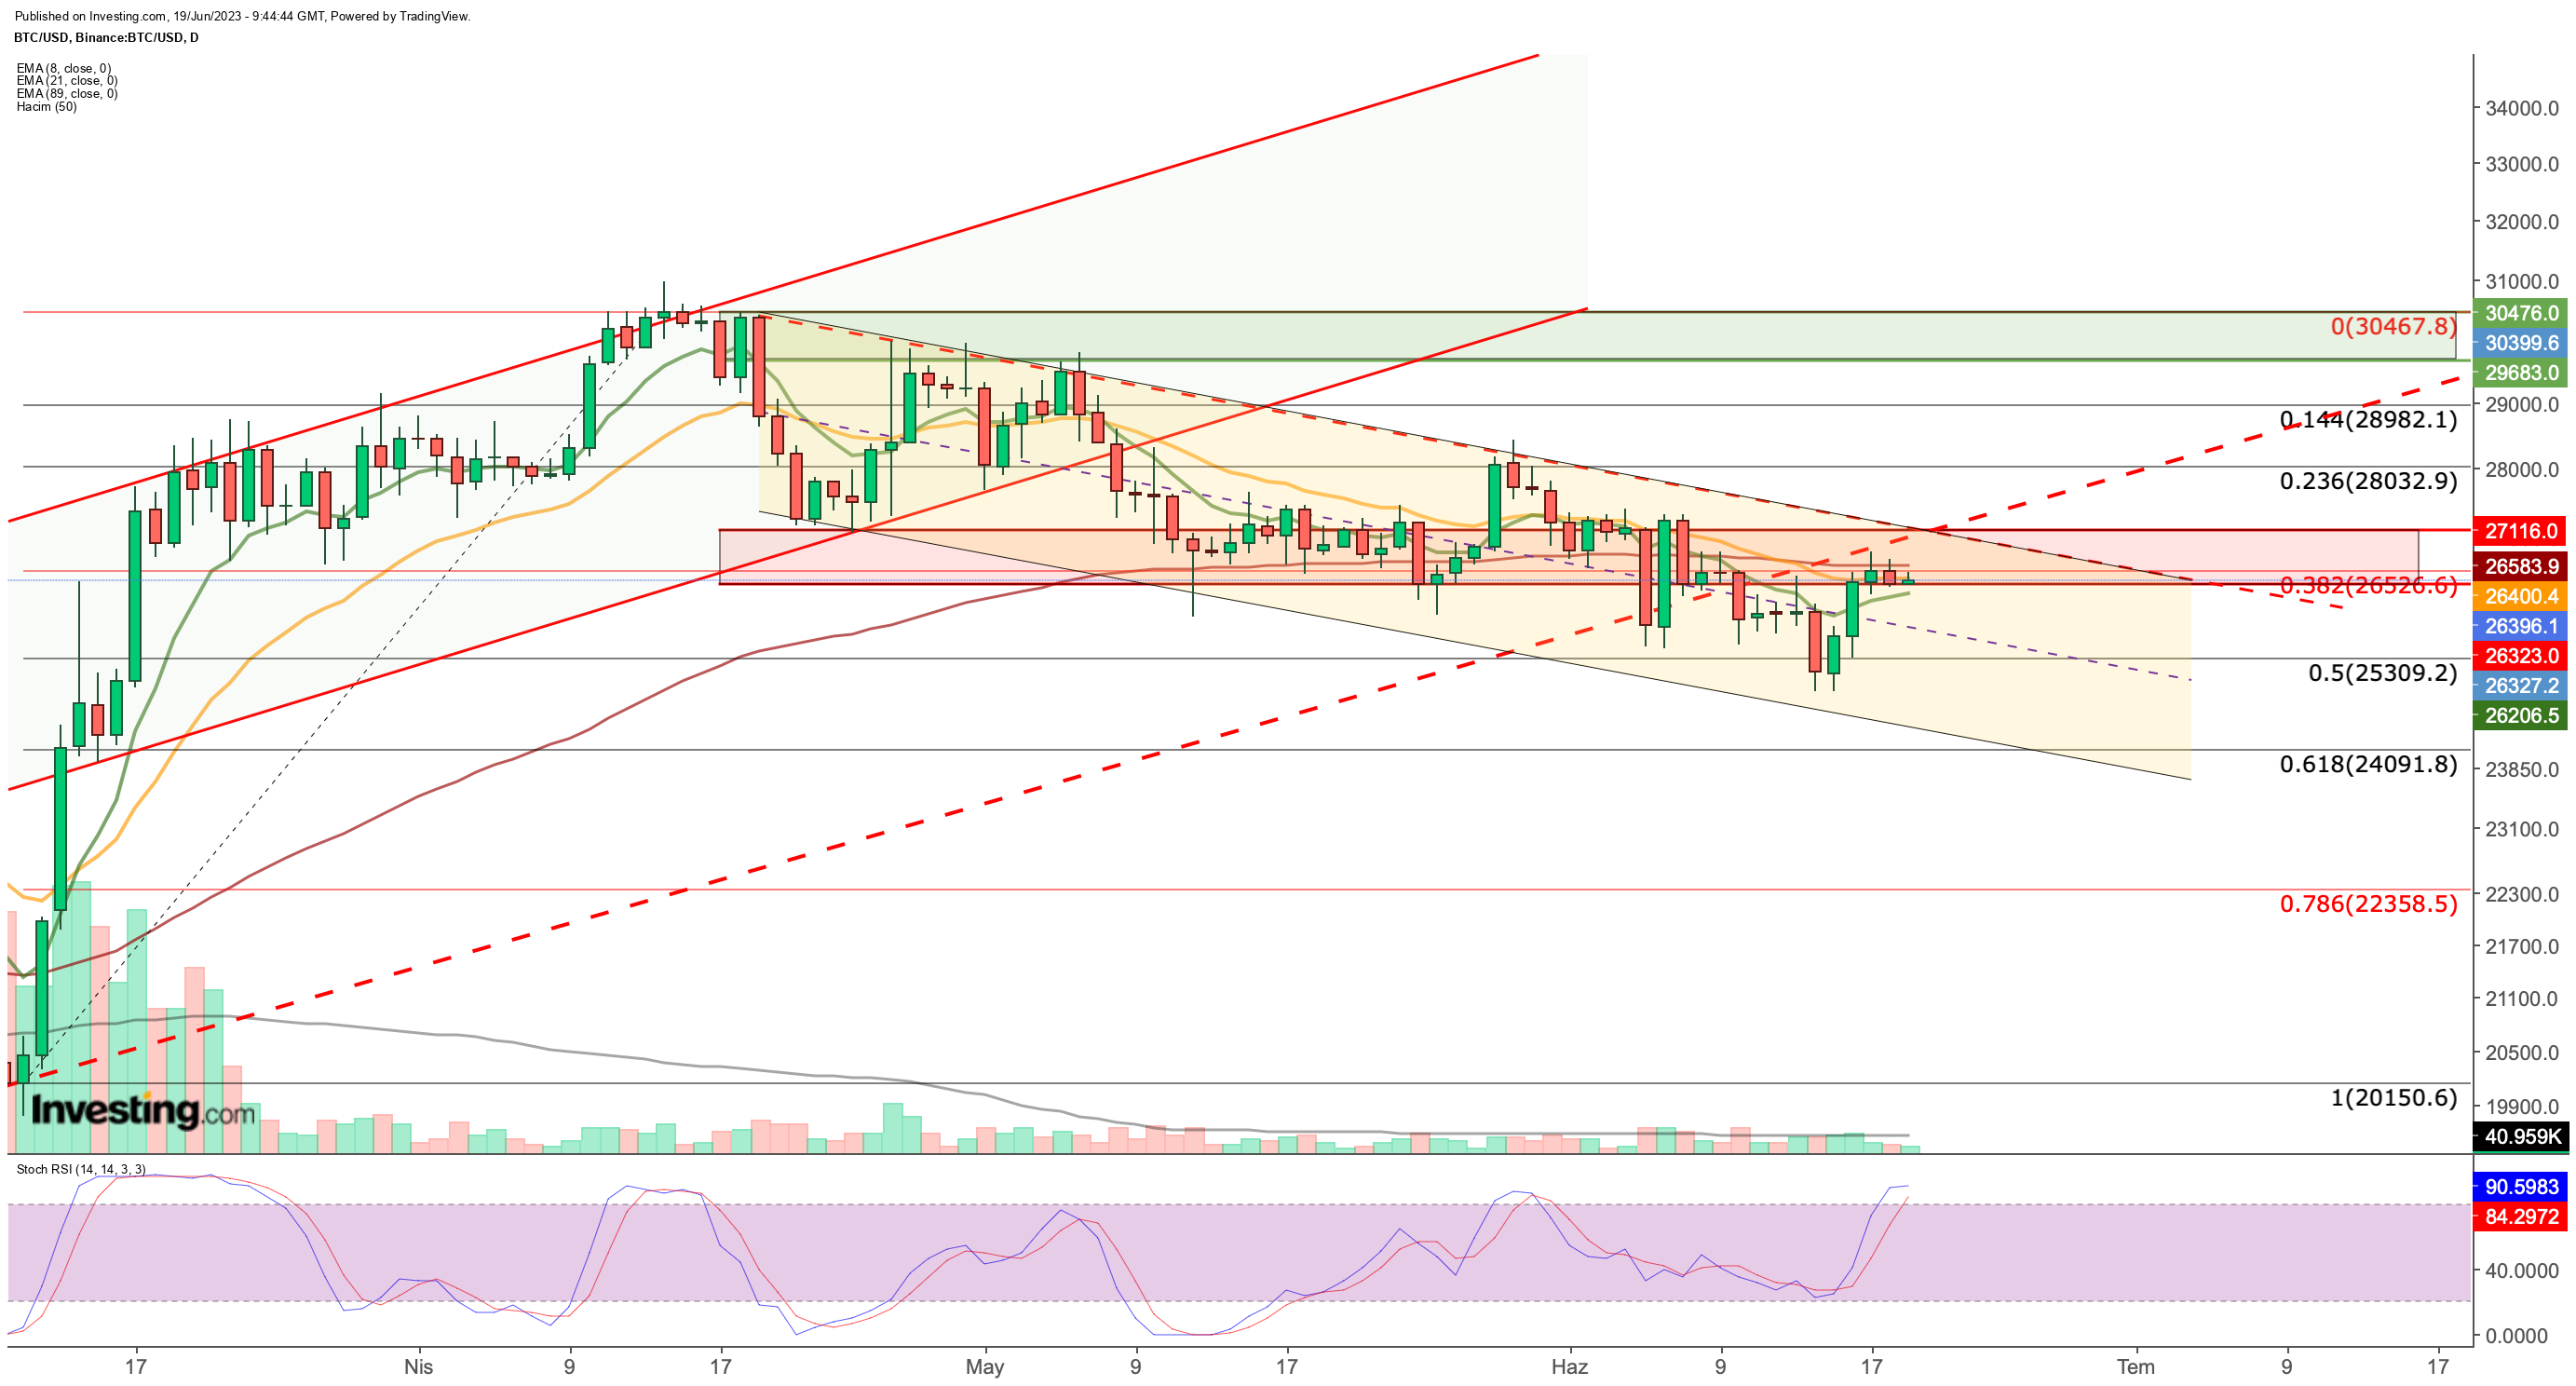
broke below $25,300 last week, but thanks to BlackRock’s Bitcoin spot ETF application, it managed to reclaim the 26,500 support level.
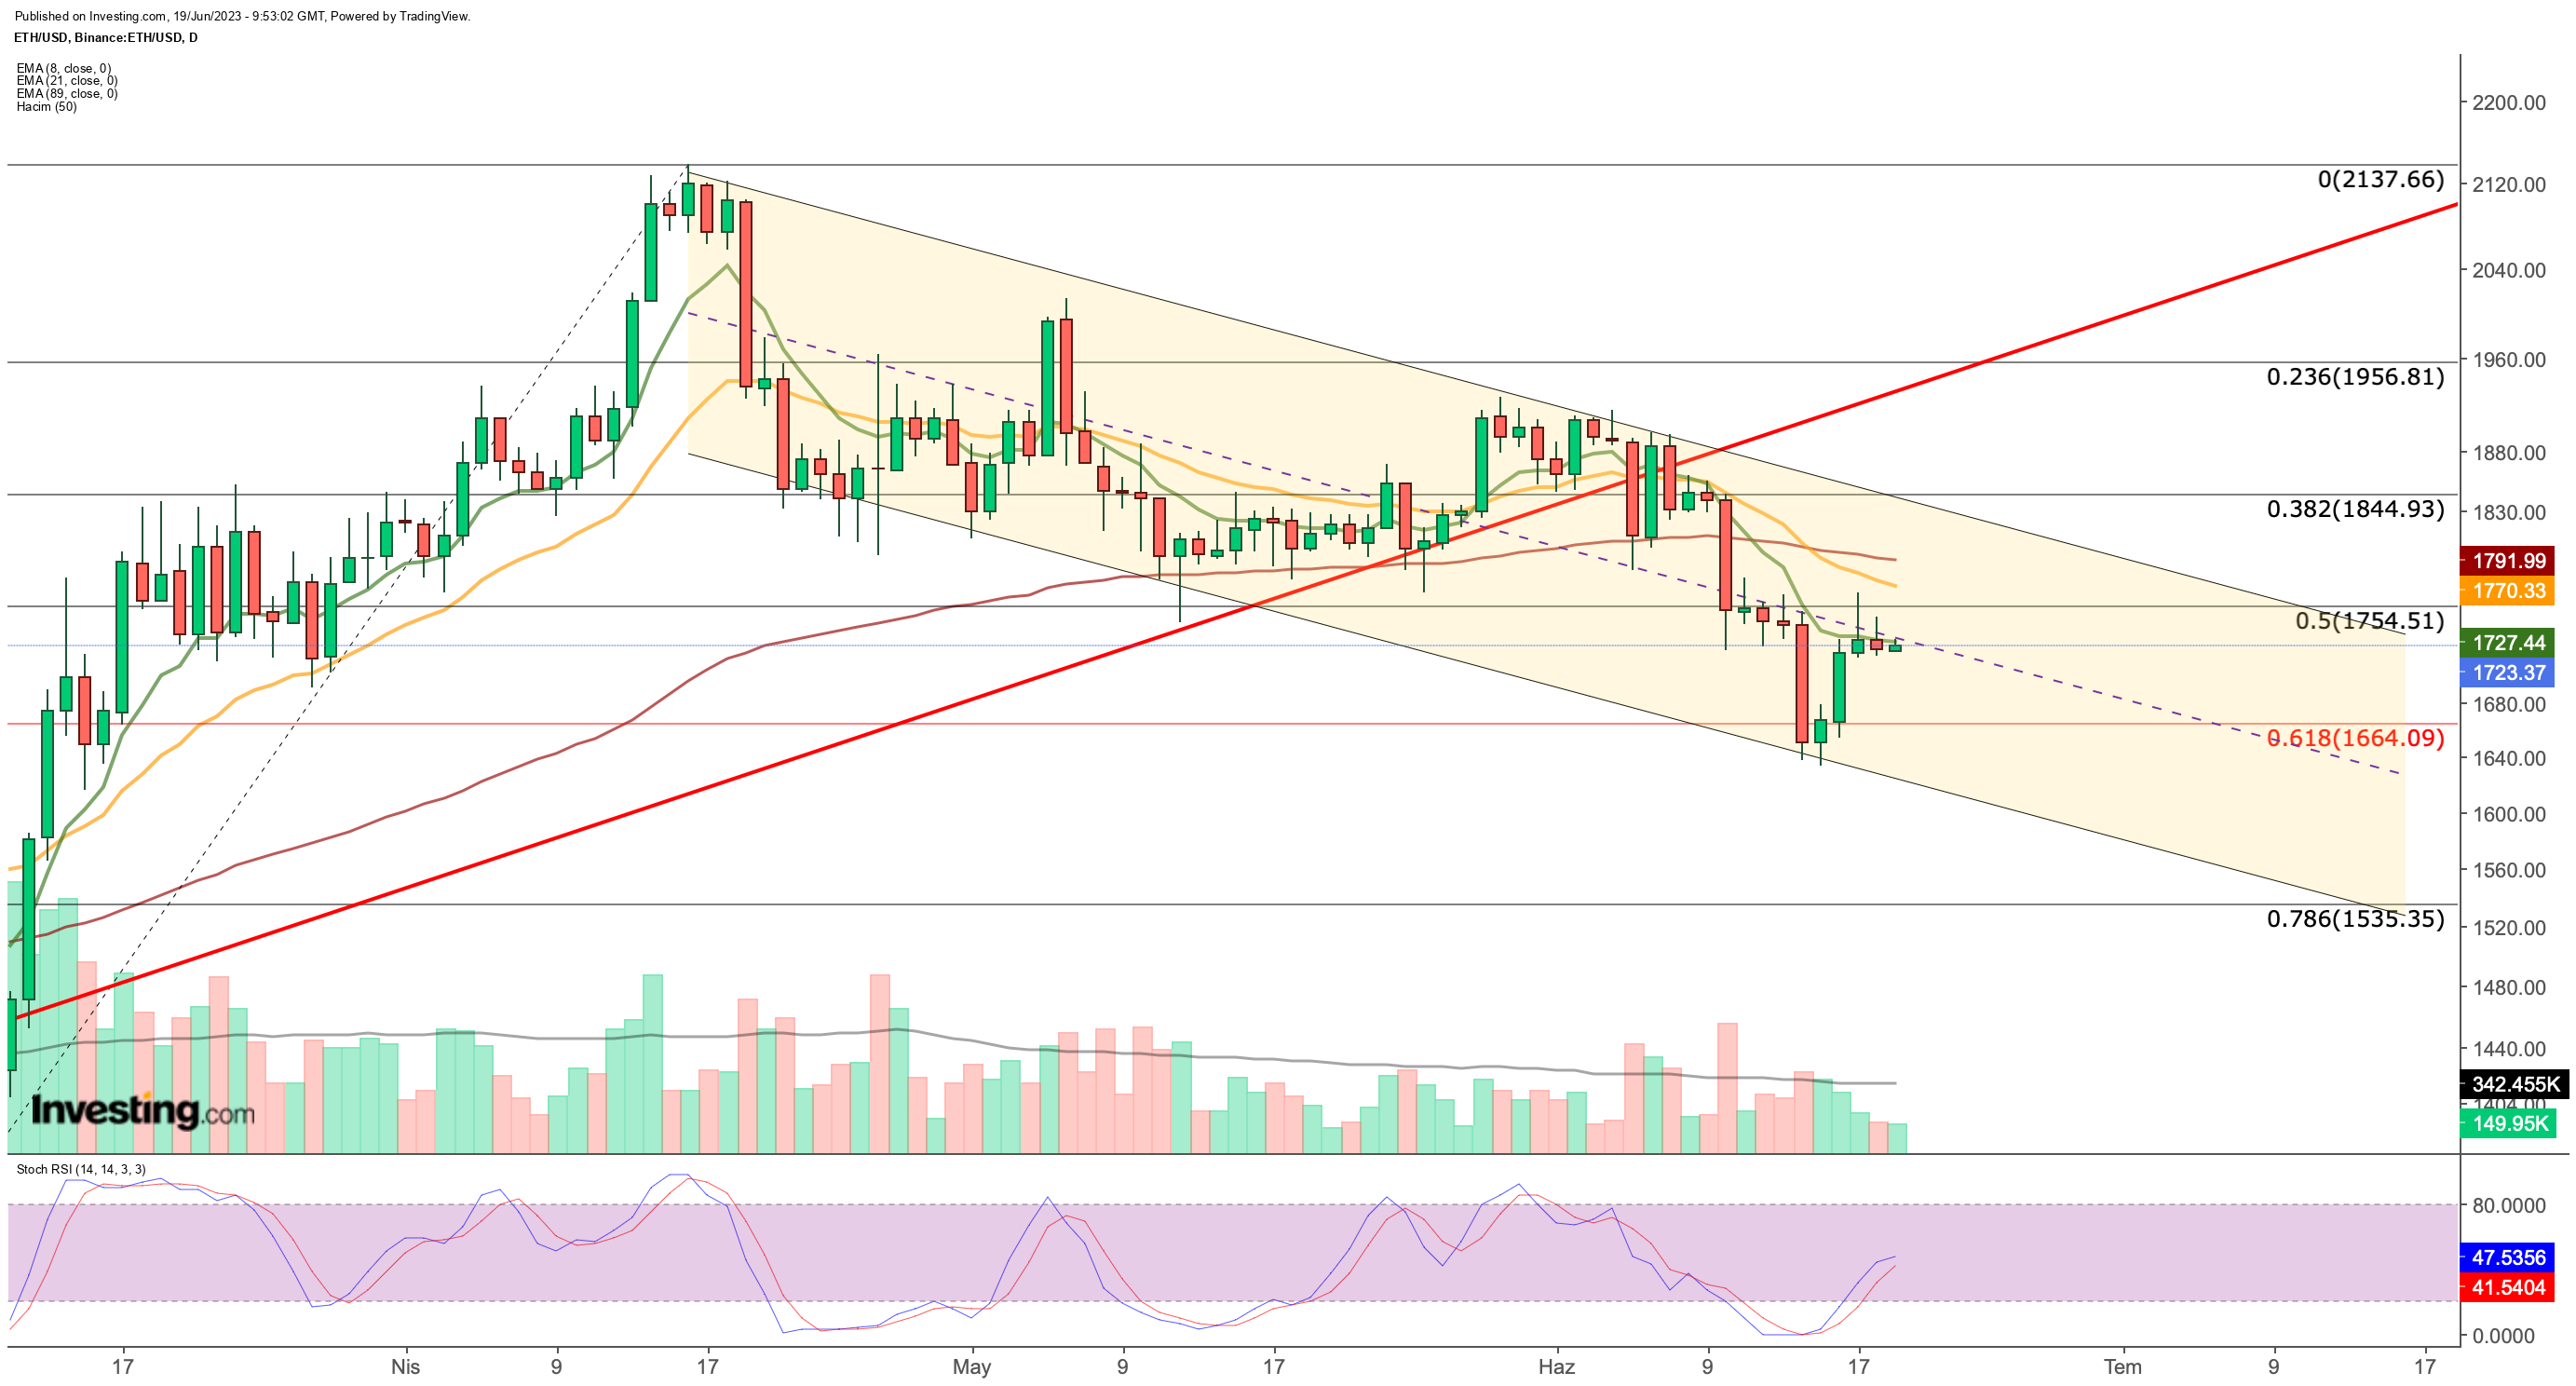
Similarly, attempted to surpass the $1,750 resistance level after maintaining support at $1,660. Nevertheless, both cryptocurrencies remain in a bearish trend.
Bitcoin Trying to Regain Support
Bitcoin tried to recover and move back into the $26,500-$27,100 support range last week, which served as a key level in May.
The absence of buyers at the $26,500 level indicates that selling pressure in the cryptocurrency market remains strong.
Currently, it is crucial for Bitcoin to maintain support above $26,500. If it can consistently close above this level, the next target will be to break above $27,100.
Achieving this would signify a reclaiming of the upward trend and a break of the short-term downtrend that has persisted since April.
If Bitcoin manages to move above the $27,000 level, it will encounter intermediate resistance levels at $28,000 and $29,000. The short-term target remains in the range of $29,600 to $30,500.
However, there is a risk of Bitcoin’s downward trend accelerating if it falls below $27,000. If selling pressure intensifies within the current support zone, BTC may decline toward the $24,000 level.
If hourly closes dip below $26,400, it could trigger bearish momentum. Conversely, hourly closes above the intermediate resistance at $26,600 could lead to a test of the falling trend line around the $27,100 area.
Ethereum Moving in a Falling Channel
After breaking below the 2023 uptrend, Ethereum’s downtrend accelerated. Following the rejection at the $1,900 level, Ethereum remained within the descending channel that started in April.
Eventually, it reached the lower boundary of the channel, falling to $1,640 last week.
ETH has shown some upward momentum after finding support in the $1,640 region. However, it is currently facing resistance in the $1,720 to $1,740 range.
If it manages to reclaim the $1,750 level, it could potentially test the upper boundary of the falling channel around $1,820 this week. A successful breakout above this level could pave the way for a rapid move towards $1,950.
On the downside, if ETH fails to reclaim the $1,800 level, it may retreat toward the $1,500 level. Ethereum’s next moves will be dependent on whether the midline of the falling channel is broken or not.
InvestingPro tools assist savvy investors in analyzing stocks. By combining Wall Street analyst insights with comprehensive valuation models, investors can make informed decisions while maximizing their returns.
You can conveniently access a single-page view of complete and comprehensive information about different companies all in one place, saving you time and effort.
Disclaimer: This article is written for informational purposes only; it is not intended to encourage the purchase of assets in any way, nor does it constitute a solicitation, offer, recommendation, advice, counseling or suggestion to invest. We remind you that all assets are evaluated from different perspectives and are extremely risky, therefore the investment decision and the associated risk rest with the investor


